Since I started trading, I have seen many posts claiming that chart figures, such as Double Bottoms, yield a success rate greater than 80%! With some success, I traded double-bottom figures in weekly and monthly time frames. However, my results have not been nearly as promised. This post will present the real success rate of double bottoms to help you better operate this trading strategy. I will demonstrate an algorithm capable of shape recognition and run backtests on the ProRealTime platform.

What is a double bottom?
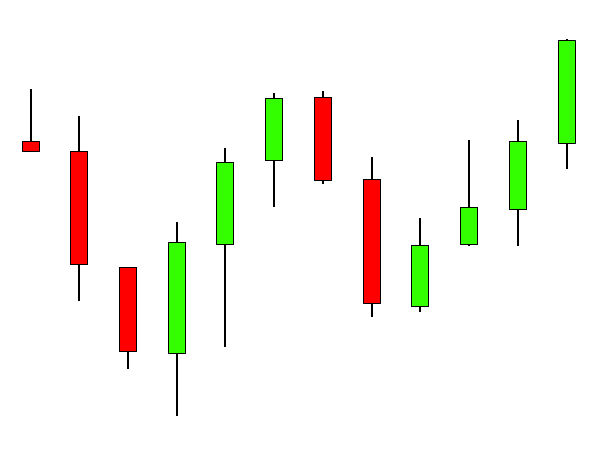
The double bottom is one of the most well-known chartist figures among traders. It is a figure that looks like the « W » letter. It is considered a bullish reversal. This chartist figure is primarily used to identify technical rebounds in the short-term perspective or to initiate a medium-term entry in the case of a recovery trading strategy.
How to recognize a double bottom using an algorithm?
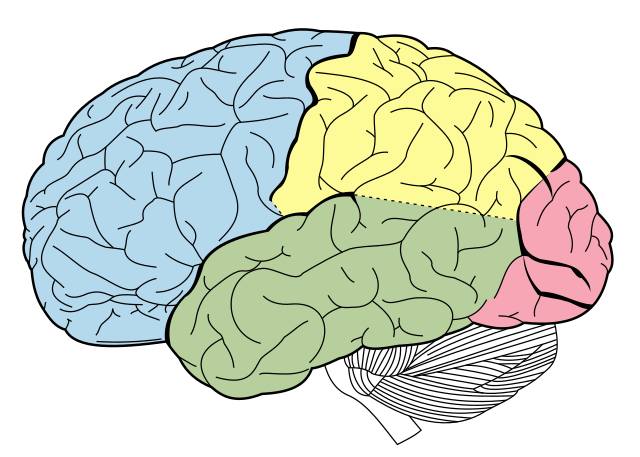
The visual recognition of things is as wide and exciting in algorithmics. The human brain is exceptionally gifted in recognizing shapes. You are capable of recognizing any object around you at first glance. The occipital cortex supports the cognitive processing of visual recognition at the back of your brain. The occipital lobe represents 18% of your brain and is almost exclusively reserved for image processing and understanding!
I will leave you to imagine the needed number of code lines and computing power to reproduce this part of human capacity using an algorithm or artificial intelligence.
Don’t panic, there is a tip!
Luckily, there will always be some algorithm or trick to help us solve a problem. First, we can reduce the problem space to recognizing an object in a given context.
For this example, I will demonstrate an algorithm that recognizes only the double bottom shape with a width of ten candles. That will be sufficient to make some tests and get the first conclusions. Besides, since we work on two dimensions — price and time —the complexity is reduced, making the processing easier.
Recognizing a shape thanks to a little mathematical trick
If you remember your school mathematics courses, you have undoubtedly heard about correlations at least once. They allow comparing two curves to know if they vary simultaneously. If two curves, c1 and c2, are correlated, they vary simultaneously. That means if c1 increases, then c2 also increases; if c1 decreases, then c2 decreases. That is precisely what you need to recognize a chartist figure. You will calculate the correlation between a chartist figure and the market price movement. If the price is correlated with the chartist figure, this figure is likely to have appeared.
Double bottom recognition source code
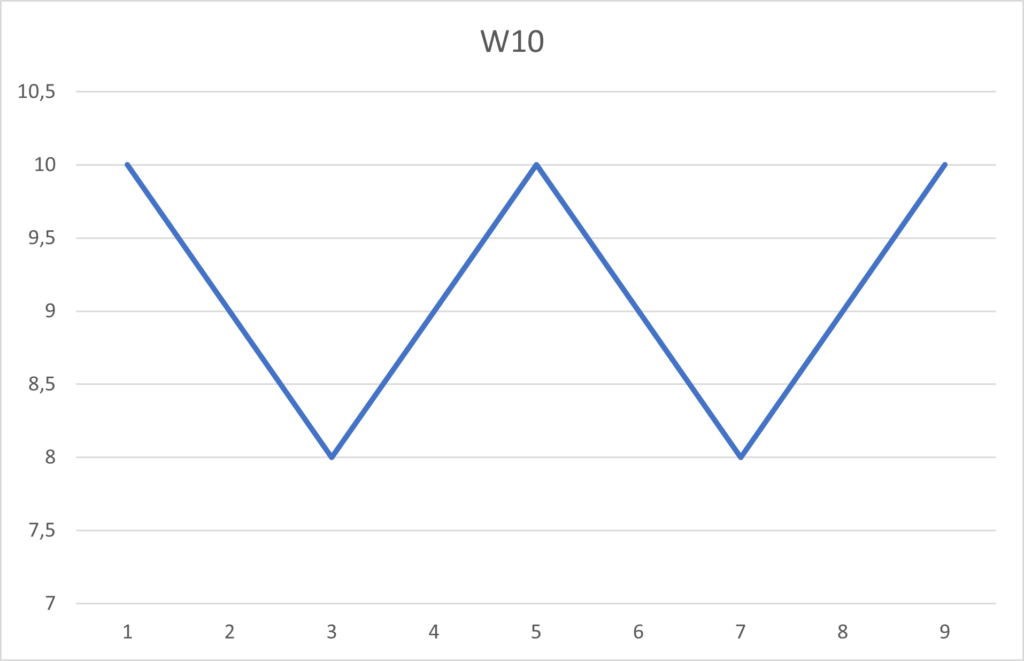
To recognize a double bottom, you need to process two steps: describe the shape in a table and then calculate the correlation with the price. To simplify this example, I artificially created an elementary double-bottom figure. I drew a W letter in an Excel sheet, starting with a price equal to ten and a width of ten candles.
Description of the double bottom figure in a table
The table expressing the double bottom figure is the following: [10, 9, 8, 9, 10, 9, 8, 9, 10]. Now, you have to code it in the Prorealtime platform.
// Chartist Figure to recognize
$x[0] = 10
$x[1] = 9
$x[2] = 8
$x[3] = 9
$x[4] = 10
$x[5] = 10
$x[6] = 9
$x[7] = 8
$x[8] = 9
$x[9] = 10
Comparison between the price and the chartist figure
Now, you must compare the similarity between this double bottom and the price movement. To make this comparison, you need to compute the correlation between the ten points of the previous table and the last ten candles. If the correlation is greater than 0.80, you can consider that a double bottom occurred:
xBar = 0
FOR i = 0 TO lastset($x) DO
  xBar = xBar + $x[i] / period
NEXT

varianceX = 0
FOR i = 0 TO lastset($x) DO
  varianceX = varianceX + SQUARE($x[i] - xBar) / period
NEXT

ecarTypeX = SQRT(varianceX)

$y[0] = Close[9]
$y[1] = Close[8]
$y[2] = Close[7]
$y[3] = Close[6]
$y[4] = Close[5]
$y[5] = Close[4]
$y[6] = Close[3]
$y[7] = Close[2]
$y[8] = Close[1]
$y[9] = Close[0]

yBar = Average[period](Close)
ecarTypeY = STD[period](Close)

covarianceXY = 0
FOR i = 0 TO lastset($x) DO
  covarianceXY = covarianceXY + (($x[i] - xBar) * ($y[i] - yBar)) / period
NEXT

// Coeficient de correlation
R = covarianceXY / (ecarTypeX * ecarTypeY)
The correlation coefficient will be contained in the R variable in the previous code.
Double bottom indicator
Now, you have all that is necessary to succeed in creating a double-bottom indicator for the Prorealtime platform. You have to add a boolean condition that will be true when the correlation coefficient is greater than a threshold. In principle, it is admitted that two curves are correlated when the correlation coefficient is greater than 0.8.
Double bottom indicator source code
This is the source code of the double-bottom indicator. To implement it on the Prorealtime platform, you have to open the indicator interface, copy-paste the code, and run the execution.
//W10.INDICATOR
ONCE period = 10
ONCE threshold = 0.8
R = 0

$x[0] = 10
$x[1] = 9
$x[2] = 8
$x[3] = 9
$x[4] = 10
$x[5] = 10
$x[6] = 9
$x[7] = 8
$x[8] = 9
$x[9] = 10

xBar = 0
FOR i = 0 TO lastset($x) DO
	xBar = xBar + $x[i] / period
NEXT

varianceX = 0
FOR i = 0 TO lastset($x) DO
	varianceX = varianceX + SQUARE($x[i] - xBar) / period
NEXT

ecarTypeX = SQRT(varianceX)


$y[0] = Close[9]
$y[1] = Close[8]
$y[2] = Close[7]
$y[3] = Close[6]
$y[4] = Close[5]
$y[5] = Close[4]
$y[6] = Close[3]
$y[7] = Close[2]
$y[8] = Close[1]
$y[9] = Close[0]

yBar = Average[period](Close)
ecarTypeY = STD[period](Close)

covarianceXY = 0
FOR i = 0 TO lastset($x) DO
	covarianceXY = covarianceXY + (($x[i] - xBar) * ($y[i] - yBar)) / period
NEXT

// Correlation coefficient
R = covarianceXY / (ecarTypeX * ecarTypeY)

// Double Bottom detection
IF R >= threshold AND R < 1 THEN
	w10 = 1
ELSE
	w10 = 0
ENDIF

RETURN W10 AS "W10"
In the previous example, if the value of the R variable is greater than 0.8, the algorithm will send a double bottom detection signal. I also added a condition that checks if R is lower than 1. For specific reasons related to the treatment of temporal series, the data is missing some candles. In this case, the correlation coefficient could be greater than 1. This result is a mathematical error because the correlation coefficient must be between -1 and 1.
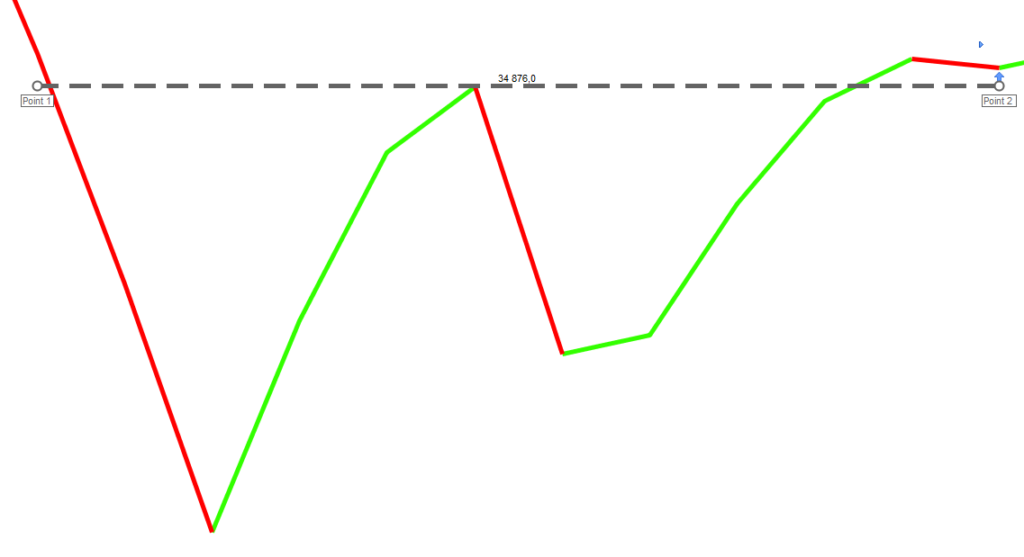
Automatic double bottom detection example
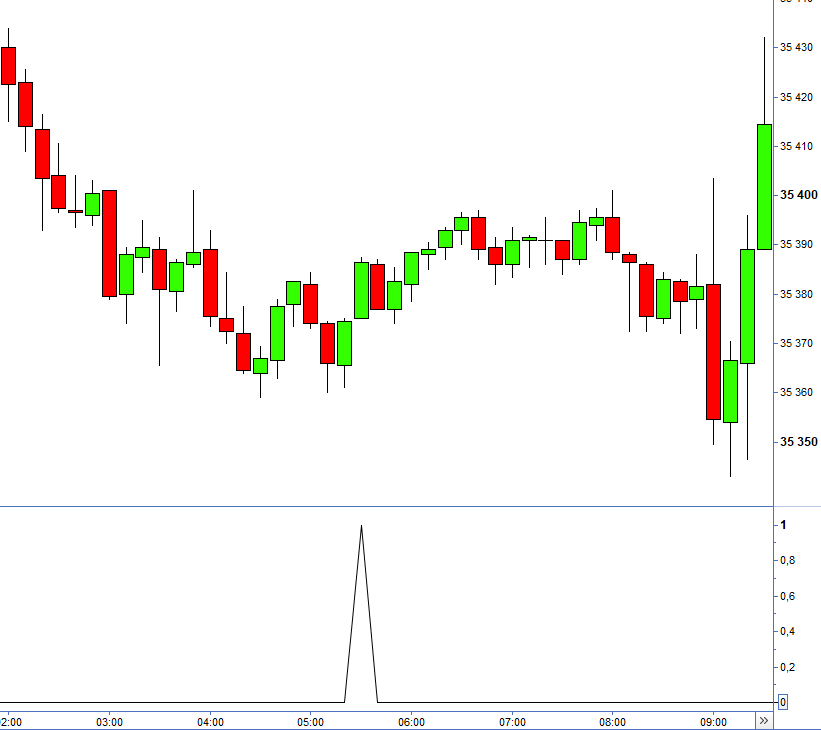
Here is an example of a double bottom detection thanks to the previous chartist indicator run on the Prorealtime platform:
Create a chartist bot
You will easily create a chartist bot using the previous source code of the double bottom indicator. This trader bot can open a long entry after a double bottom occurs in the market.
Source code of Double Bottom bot
//--------------------------------------------------------------------------
// Double Bottom backtest Example
// AUTOR: Vivien Schmitt
// https://artificall.com
// THIS STRATEGY MUST BE RUN ON THE DOW JONES WITH A "10-minutes" TIMEFRAME
//--------------------------------------------------------------------------
DEFPARAM CUMULATEORDERS = false // only one trade in the same time

//--------------------------------------------------------------------------
// Position Size
capital = 10000
numberOfContracts = ROUND(capital/close, 2)

//--------------------------------------------------------------------------
ONCE period = 10
ONCE threshold = 0.8
R = 0

//--------------------------------------------------------------------------
// * Template of a Double Bottom
$x[0] = 10
$x[1] = 9
$x[2] = 8
$x[3] = 9
$x[4] = 10
$x[5] = 10
$x[6] = 9
$x[7] = 8
$x[8] = 9
$x[9] = 10

//--------------------------------------------------------------------------
// * Recognition Algorithm
xBar = 0
FOR i = 0 TO lastset($x) DO
xBar = xBar + $x[i] / period
NEXT

varianceX = 0
FOR i = 0 TO lastset($x) DO
varianceX = varianceX + SQUARE($x[i] - xBar) / period
NEXT

ecarTypeX = SQRT(varianceX)

//--------------------------------------------------------------------------
$y[0] = Close[9]
$y[1] = Close[8]
$y[2] = Close[7]
$y[3] = Close[6]
$y[4] = Close[5]
$y[5] = Close[4]
$y[6] = Close[3]
$y[7] = Close[2]
$y[8] = Close[1]
$y[9] = Close[0]

yBar = Average[period](Close)
ecarTypeY = STD[period](Close)

covarianceXY = 0
FOR i = 0 TO lastset($x) DO
covarianceXY = covarianceXY + (($x[i] - xBar) * ($y[i] - yBar)) / period
NEXT

//--------------------------------------------------------------------------
R = covarianceXY / (ecarTypeX * ecarTypeY)

IF R < threshold OR R > 1 THEN
R = 0
ENDIF

//--------------------------------------------------------------------------
// * Condition Recognized Double Bottom
isDoubleBottom = R

//--------------------------------------------------------------------------
// * Height of Double Bottom
FigureLow = lowest[period]
FigureHigh = highest[period]
FigureHeight = FigureHigh - FigureLow

//--------------------------------------------------------------------------
// OPEN A LONG ENTRY with Stoploss & Target
IF NOT LongOnMarket AND isDoubleBottom THEN

  // * Stop-loss & Target
  mySTOPLOSS = FigureHeight
  myTARGET = FigureHeight * 1.5

  SET STOP pLOSS mySTOPLOSS
  SET TARGET pPROFIT myTARGET

  // * Buy order
  BUY numberOfContracts CONTRACT AT MARKET

ENDIF
The success rate of the double-bottom
You will finally discover the real success rate of the double-bottom trading strategy. To get it, you have to run a backtest of the previous code and check the result:
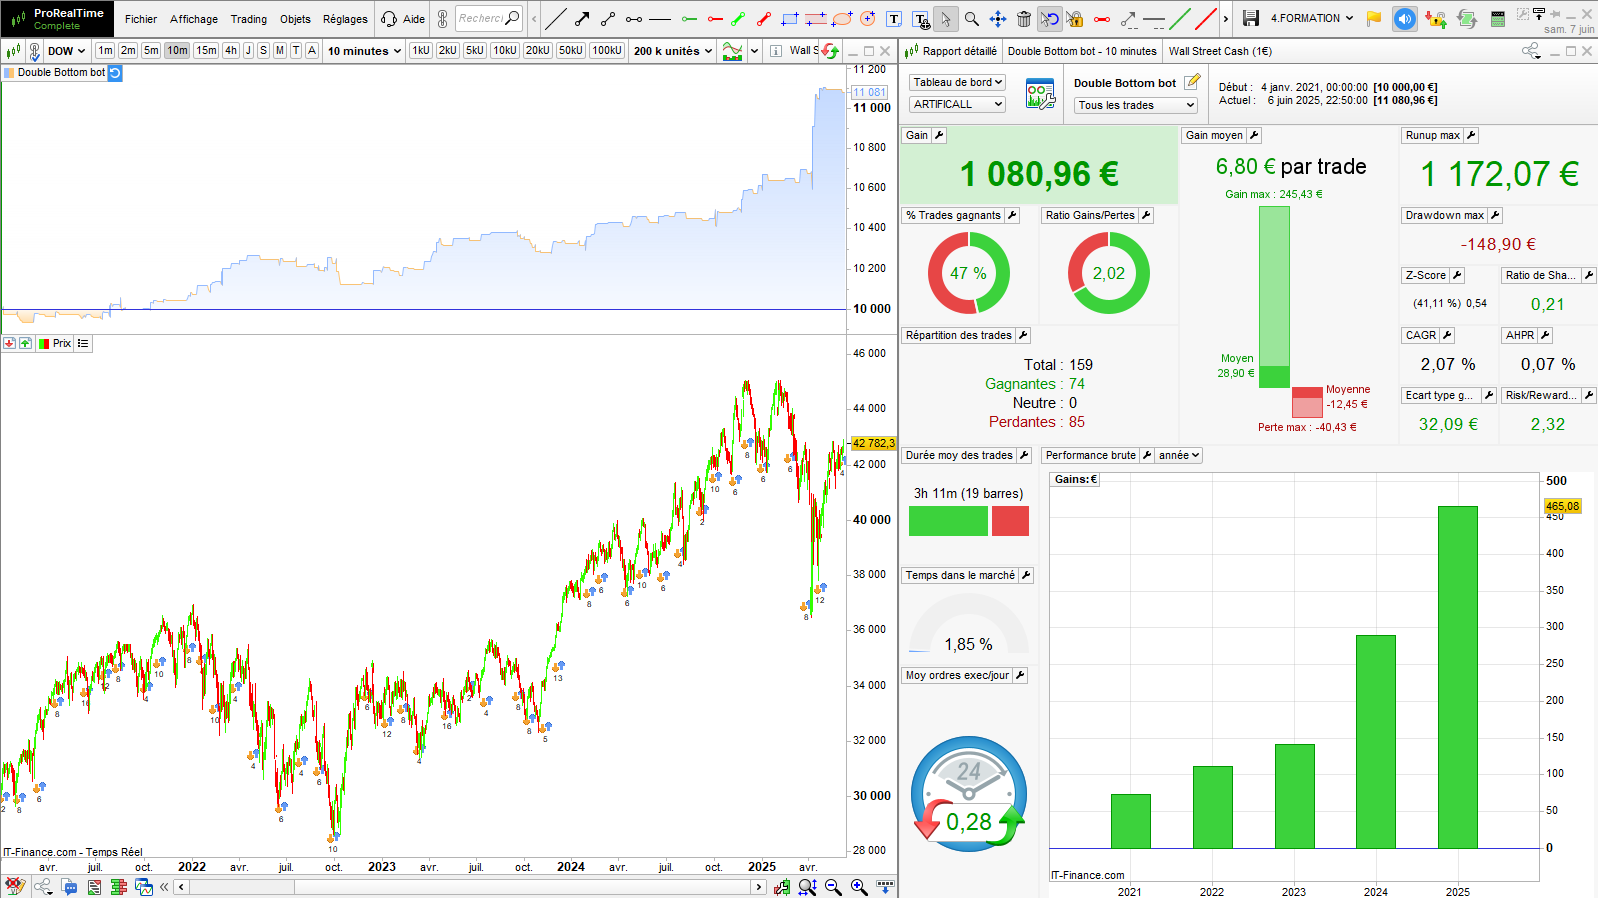
Detailed report
You can download the detailed report to obtain more information about the position price, size, and the transaction date:
This backtest generated a profit of 1080€ with a success rate of 47%. It opened 159 entries.
How to improve the double-bottom algorithm?
If you have already traded double bottoms, you have probably heard about the neckline. I will implement neckline management to improve the performance of this chartist trading system.
What about the double bottom neckline?
The neckline of a double bottom figure is the highest price reached by the double bottom top. It is a kind of short-term resistance.
The equation of the neckline is relatively simple: it corresponds to the highest price reached on the x candles corresponding to the figure width. In this example, the double bottom width is ten candles.
I will add a condition that will become true if the price closes above the double bottom neckline.
isNeckline = close >= FigureHighSource code of the Double Bottom bot with neckline
To implement the neckline in the algorithm, I needed to add a delay of one candle after the double bottom condition was met. This delay would allow the market to close above the neckline just after the double bottom.
The following trading system will open an entry only if a double bottom appears and if the price closes above the neckline:
//--------------------------------------------------------------------------
// Double Bottom with Neckline Backtest
// AUTOR: Vivien Schmitt
// https://artificall.com
// THIS STRATEGY MUST BE RUN ON THE DOW JONES WITH A "10-minutes" TIMEFRAME
//--------------------------------------------------------------------------
DEFPARAM CUMULATEORDERS = false // only one trade in the same time

//--------------------------------------------------------------------------
// Position Size
capital = 10000
numberOfContracts = ROUND(capital/close, 2)

//--------------------------------------------------------------------------
ONCE period = 10
ONCE threshold = 0.8
R = 0

//--------------------------------------------------------------------------
// * Template of a Double Bottom
$x[0] = 10
$x[1] = 9
$x[2] = 8
$x[3] = 9
$x[4] = 10
$x[5] = 10
$x[6] = 9
$x[7] = 8
$x[8] = 9
$x[9] = 10

//--------------------------------------------------------------------------
// * Recognition Algorithm
xBar = 0
FOR i = 0 TO lastset($x) DO
xBar = xBar + $x[i] / period
NEXT

varianceX = 0
FOR i = 0 TO lastset($x) DO
varianceX = varianceX + SQUARE($x[i] - xBar) / period
NEXT

ecarTypeX = SQRT(varianceX)

//--------------------------------------------------------------------------
$y[0] = Close[9]
$y[1] = Close[8]
$y[2] = Close[7]
$y[3] = Close[6]
$y[4] = Close[5]
$y[5] = Close[4]
$y[6] = Close[3]
$y[7] = Close[2]
$y[8] = Close[1]
$y[9] = Close[0]

yBar = Average[period](Close)
ecarTypeY = STD[period](Close)

covarianceXY = 0
FOR i = 0 TO lastset($x) DO
covarianceXY = covarianceXY + (($x[i] - xBar) * ($y[i] - yBar)) / period
NEXT

//--------------------------------------------------------------------------
R = covarianceXY / (ecarTypeX * ecarTypeY)

IF R < threshold OR R > 1 THEN
R = 0
ENDIF

//--------------------------------------------------------------------------
// * Condition Recognized Double Bottom
isDoubleBottom = R

//--------------------------------------------------------------------------
// * Height of Double Bottom
FigureLow = lowest[period]
FigureHigh = highest[period]
FigureHeight = FigureHigh - FigureLow

//--------------------------------------------------------------------------
// * Condition Neckline
isNeckline = close >= FigureHigh

//--------------------------------------------------------------------------
// OPEN A LONG ENTRY with Stoploss & Target
IF NOT LongOnMarket AND isDoubleBottom AND isNeckline THEN

  // * Stop-loss & Target
  mySTOPLOSS = FigureHeight
  myTARGET = FigureHeight * 1.5

  SET STOP pLOSS mySTOPLOSS
  SET TARGET pPROFIT myTARGET

  // * Buy order
  BUY numberOfContracts CONTRACT AT MARKET

ENDIF
Performance of the double bottom bot implementing the neckline
This is the new performance of the double-bottom trading system that opens entries only if the price closes above the neckline:
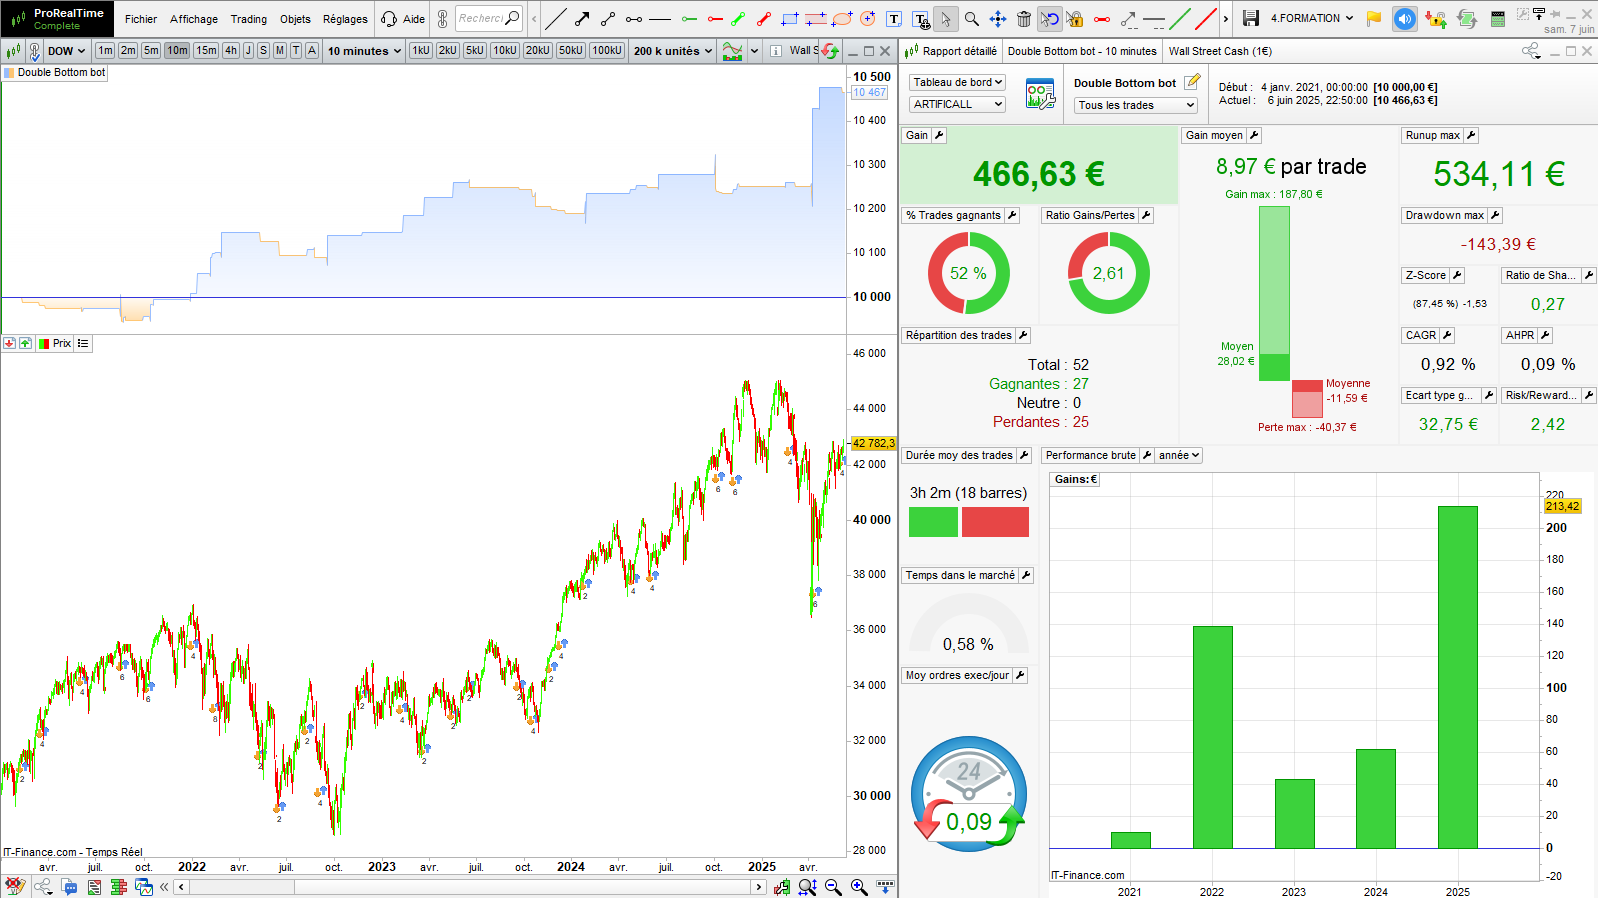
Detailed report
You can download the detailed report to obtain more information about the position price, size, and the transaction date:
The algorithm’s performance strongly decreased. However, three essential properties have evolved: the number of openings is significantly lower, the success rate has risen to 52%, and the profit-loss ratio has improved.
Limitations and biases of this study
As in all market studies, some statistical biases and limitations impact the final result. These are the two main biases of this study:
1. Limitation of the chartist recognition algorithm
The first bias comes from the algorithm I used to recognize the double bottom figure. This correlation algorithm yields interesting results, but it is limited in its constraints. It only allows the recognition of chartist figures having a fixed width. Besides, it tends to generate false positives, which happens when data misses candles on the chart.
2. Stop loss and target positions
In this study, I calculated the target and the stoploss from the double bottom height. I set a target 1.5 times the stoploss. The position of the exit conditions has a significant impact on the performance of the backtest.
Double Bottom Summary
The double bottoms provide exploitable recovery trading signals.
The recognition algorithm will impact the success of the strategy.
You can improve the success rate by waiting for the neckline breakout.
The target and stop-loss levels impact the strategy’s performance.
If you’re interested in double-bottom trading, I’ve created an indicator to help you. It displays the figure, the breakout, the targets, and the stop-losses. It also implements volume, trend, and strength filters.
This indicator is available on the Prorealcode website at this address:
https://market.prorealcode.com/product/chart-breaker
I wish you good trades 😊
Vivien
Range Breakout Indicator for Prorealtime
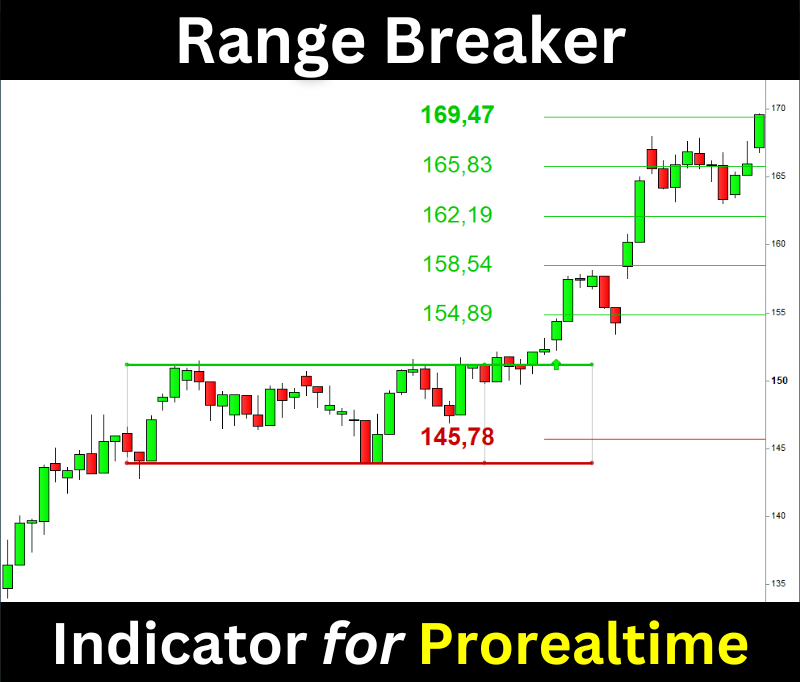
The Range Breaker will help you trade the Range Breakouts on Prorealtime. It displays the ranges, breakout signals, and target prices on your chart.
Sources and credit images
Head image: https://www.maxpixel.net/Alphabet-Gold-W-Gradient-Abc-Letter-Lowercase-146063
Brain image: https://en.wikipedia.org/wiki/Occipital_lobe
Occipital proportion: https://faculty.washington.edu/chudler/facts.html