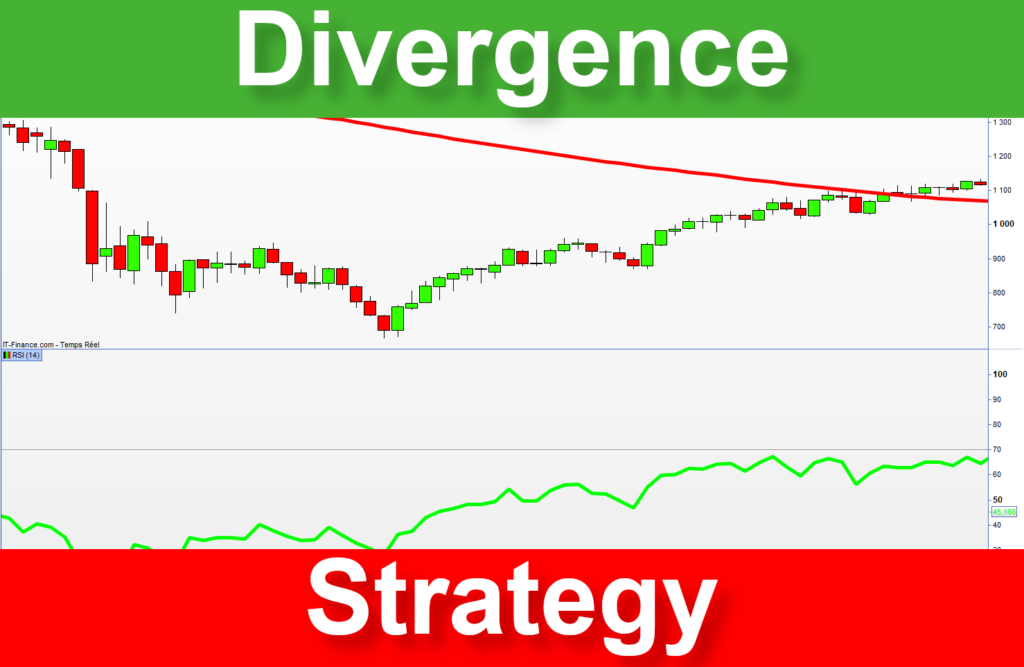
A divergence happens when momentum indicators contradict the trend. That allows for anticipating a trend reversal. This post will show you how to trade bullish and bearish divergences. I will provide the code for an indicator, a trading system, and a screener that work on the Prorealtime platform. You will have all the essential tools to utilize divergences more effectively on the market.
- What is a divergence in the market?
- How to use divergences in trading?
- How to detect a divergence in the market?
- Automated divergence strategy
- Improve your swing trading performance thanks to divergences
- How do we use divergence to invest better?
- Find the best opportunities thanks to a divergence screener
- Risks associated with divergence trading
- Divergence trading summary
What is a divergence in the market?
A divergence is a contradiction between a trend and a strength indicator. For example, this contradiction can appear between the direction of a moving average and a relative strength index. There is a divergence if the 50-period moving average is bullish while the 50-period relative strength index is bearish. The divergence occurring means the current trend is running out, even reversing. A divergence can be bullish or bearish.
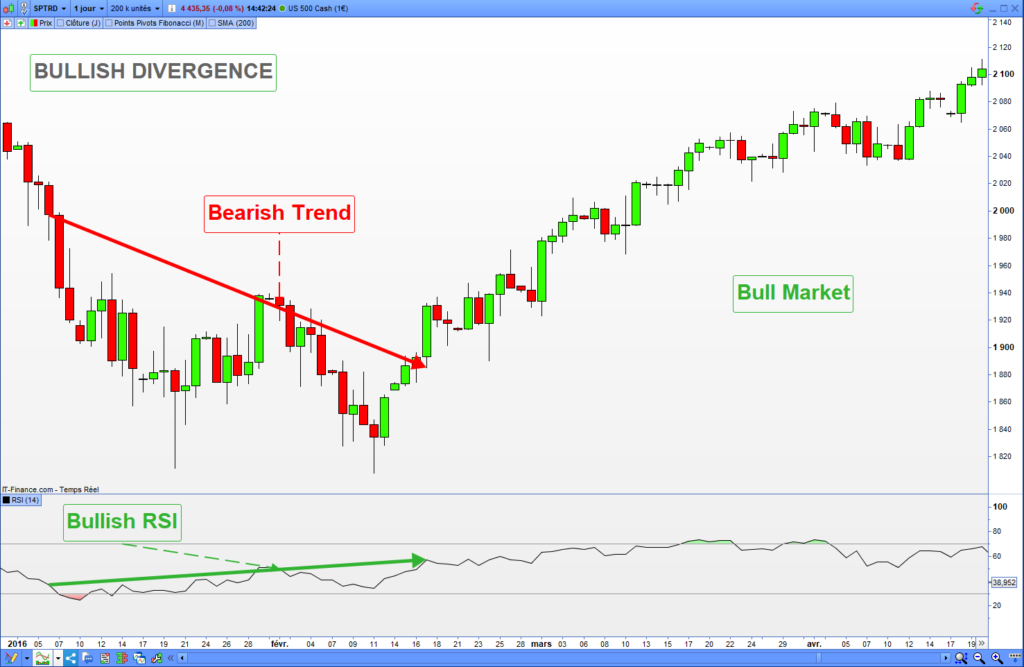
Bullish divergence
A bullish divergence occurs when a strength indicator becomes bullish while the trend is bearish. That presupposes the beginning of a new uptrend. The following chart shows a bullish divergence between the trend and the RSI on the S&P 500:
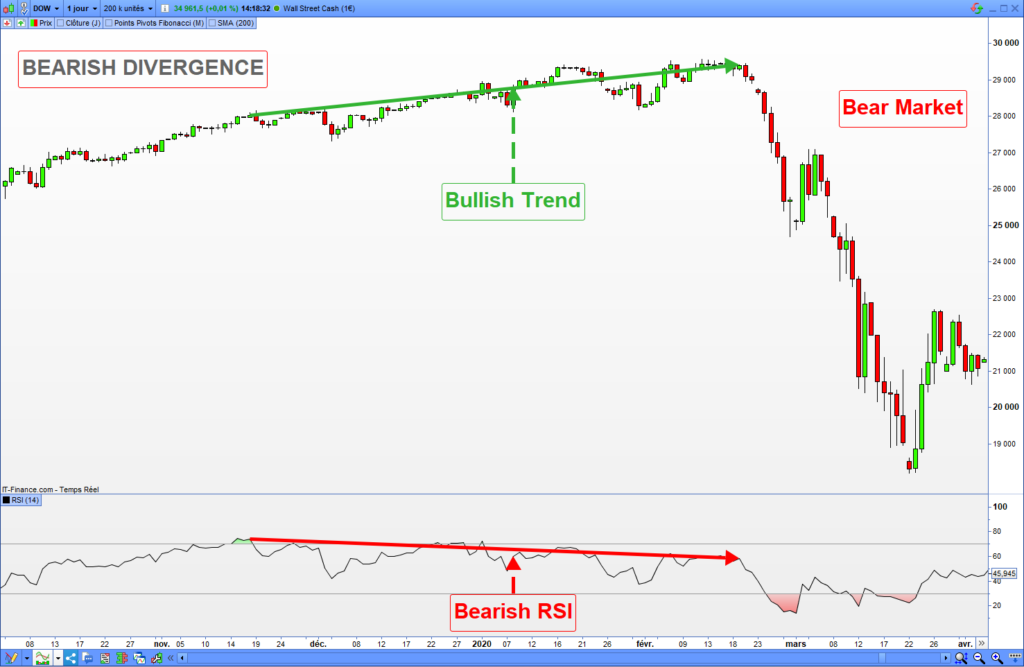
Bearish divergence
A bearish divergence appears when a strength indicator becomes bearish while the trend is still bullish. That presupposes the beginning of a new downtrend. The following chart shows a bearish divergence between the trend and the RSI on the Dow Jones:
How to use divergences in trading?
You can use divergences to open a new long or short entry or to close an opening entry. Here is how to use bullish and bearish divergences:
Bullish divergences
- A bullish divergence indicates that a new uptrend may be about to begin. When it appears, you can begin to search for a buying signal. If you are short, it may be time to close your position or secure the latent gain by lowering your stop loss.
Bearish divergences
- A bearish divergence indicates that a potential downtrend may be underway. When it appears, you can search for a short-selling signal. If you are long, it may be time to close your position or secure the latent gain by pulling up your stop loss.
How to detect a divergence in the market?
Several ways allow measuring divergence with an indicator. You can use any trend indicators with any strength indicators. You can measure the trend using the slope of a moving average or a linear regression, and the strength with an RSI.
What Indicators to use for divergence detection?
Here are the primary trend and strength indicators you can use to detect a divergence:
| Trend Indicators | Strength Indicator |
|---|---|
| Moving averages Exponential moving average Moving average Convergence divergence Parabolic stop and reverse Linear & polynomial regression | Relative strength index Average directional index Stochastic momentum Index True Strength Index Commodity channel index |
Code of the divergence indicator for Prorealtime
To create a divergence indicator, you will need a trend and strength indicator. I decided to measure the trend with linear regression and the strength with a Relative Strength Index.
Here is the source code of the divergence indicator working on the Prorealtime platform. This indicator will return 1 in case of bullish divergence, -1 in case of bearish divergence, and 0 in other cases:
//------------------------------------------//
// * DIVERGENCE INDICATOR FOR PROREALTIME * //
// Author: Vivien SCHMITT
// Website: http://artificall.com
//------------------------------------------//

// INITIALIZATION
divergenceWidth = 50
DIVERGENCE = 0

// INDICATOR CALCULATIONS
trend = linearregressionslope[divergenceWidth](close)
strength = linearregressionslope[divergenceWidth](rsi[14])

// DIVERGENCE DETECTION
IF trend < 0 and strength > 0 THEN
  // BULLISH DIVERGENCE
  DIVERGENCE = 1
ELSIF trend > 0 and strength < 0 THEN
  // BEARISH DIVERGENCE
  DIVERGENCE = -1
ELSE
  // NO DIVERGENCE
  DIVERGENCE = 0
ENDIF

// DIVERGENCE PRINTING
return DIVERGENCE
Example of divergence detections
Here is an example of bullish and bearish recognition on the S&P 500 index in the weekly timeframe:
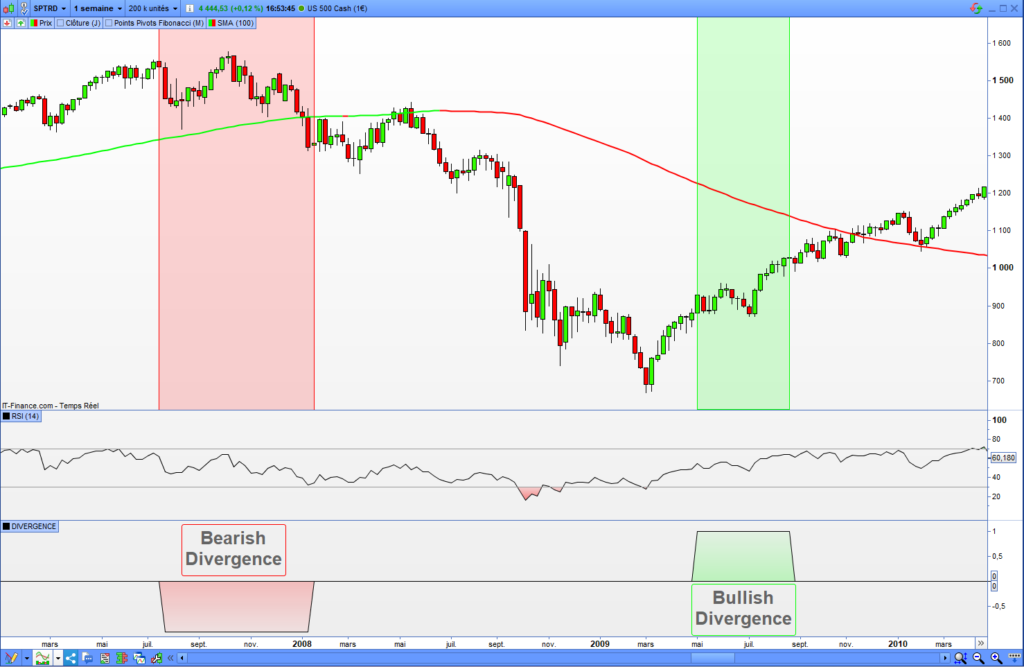
As shown in the previous chart, the shortness of the relative strength index indicates a bearish divergence that preceded the 2008 crash. In May 2009, the RSI became positive again, followed by the beginning of a new uptrend.
Automated divergence strategy
A divergence is a market state that presupposes a change in the market trend. The previous divergence indicator works well, but is insufficient to open an entry. When you detect a divergence, you have to search for a buy or sell-short signal before opening an entry. You can try a simple signal like a moving average crossing or a more complex signal like a range breakout or a pullback.
I will present how to use the divergence indicator in an automated trading strategy. To simplify the example, I will open an entry by using a moving average crossing that I associate with a divergence.
Buying signal in a bullish divergence
I will use the Gold Cross signal to operate the bullish divergences. A gold cross is a bullish crossing of a 50-period moving average with a 200-period moving average. To have more signals, I will also add the 50-period crossing with the 100-period.
MM50 = average[50]
MM100 = average[100]
MM200 = average[200]

GoldCross = MM50 CROSSES OVER MM100 OR MM50 CROSSES OVER MM200
Opening a long entry in a bullish divergence context requires the satisfaction of two conditions: the divergence indicator must return 1, and a gold cross must occur.
Code of a divergence strategy for Prorealtime
Here is the code for the automated strategy that exploits bullish divergences. The following code is runnable on the Prorealtime platform:
DEFPARAM CUMULATEORDERS = true

// * MONEY MANAGEMENT
maxCapital = 20000
entrySize = 1000
numberShare = max(1, floor(entrySize / close))
nextPosition = numberShare * close

condiTionMaxCapital = (investedCapital + nextPosition) < maxCapital

stoplossPercent = 20
targetPercent = stoplossPercent * 3


// * DIVERGENCE CALCULATION * //
// INITIALIZATION
divergenceWidth = 100 //50
DIVERGENCE = 0

// INDICATOR CALCULATIONS
trend = linearregressionslope[divergenceWidth](close)
strength = linearregressionslope[divergenceWidth](rsi[14])

// DIVERGENCE DETECTION
IF trend < 0 and strength > 0 THEN
  // BULLISH DIVERGENCE
  DIVERGENCE = 1
ELSIF trend > 0 and strength < 0 THEN
  // BEARISH DIVERGENCE
  DIVERGENCE = -1
ELSE
  // NO DIVERGENCE
  DIVERGENCE = 0
ENDIF


// * LONG SIGNALS * //
// signal indicators
MM50 = average[50]
MM100 = average[100]
MM200 = average[200]

GoldCross = MM50 CROSSES OVER MM100 OR MM50 CROSSES OVER MM200


// * ENTRY OPENING * //
IF DIVERGENCE = 1 AND GoldCross AND condiTionMaxCapital THEN
  BUY numberShare SHARES AT MARKET
  SET STOP %LOSS stoplossPercent
  SET TARGET %PROFIT targetPercent
ENDIF


// * Invested capital update * //
IF COUNTOFPOSITION[1] <> COUNTOFPOSITION THEN
  IF positionprice <> 0 THEN
    investedCapital = investedCapital + positionprice * numberShare
  ELSE
    investedCapital = 0
  ENDIF
ENDIF
Example of an automated entry opening
Here is an example of a long entry opening on the Dow Jones after the occurrence of a gold cross in a bullish divergence context:
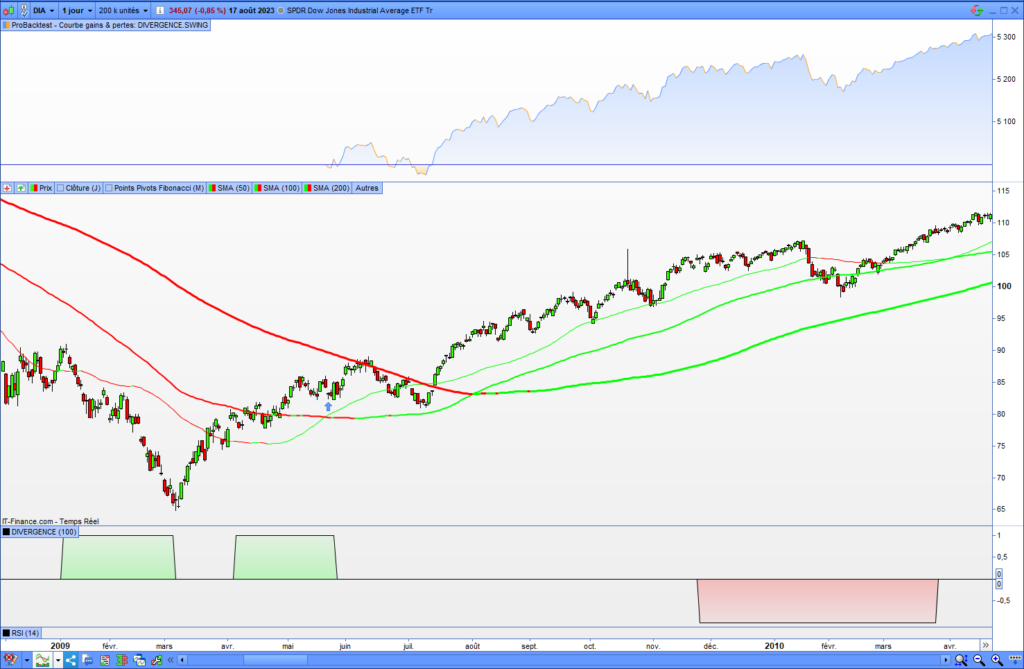
Backtest of the divergence strategy
Here is the result of this strategy on the SPDR Dow Jones Industrial Average ETF in a daily time frame:
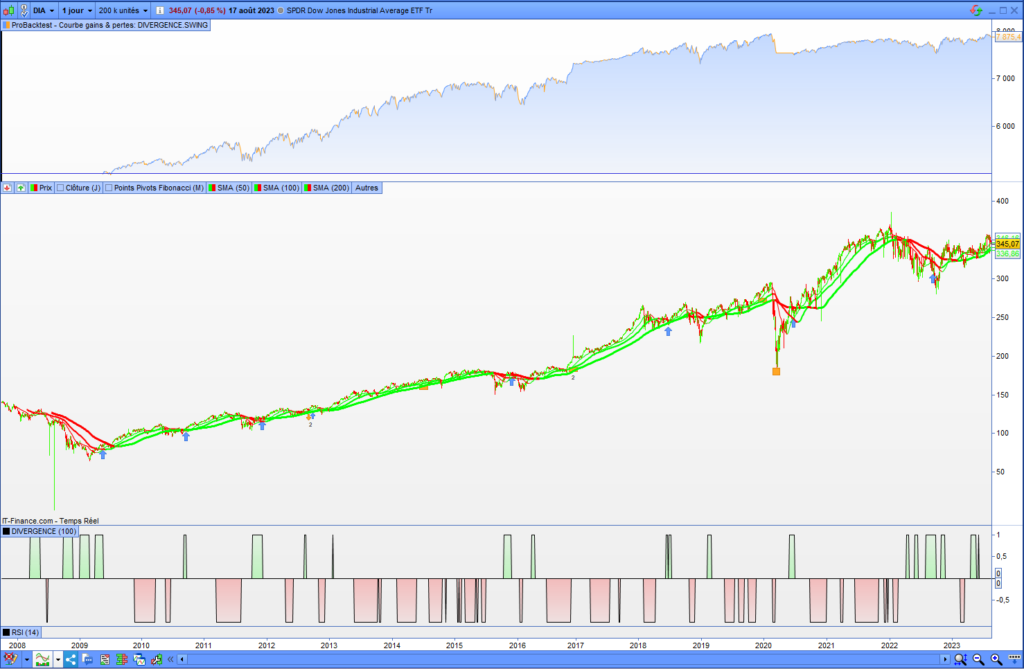
You will note on the previous chart that a bear market has not followed numerous bearish divergences. That comes from a bullish bias on the American indexes. Most of the time, bearish divergences are followed by a period of consolidation. That is why I have not found a robust sell-short strategy using bearish divergences.
Improve your swing trading performance thanks to divergences
Divergences are very useful for detecting a trend reversal on an asset. Nevertheless, the divergence alone is insufficient to open a swing entry. As previously explained, you need to associate the divergence with a signal. I will present two methods to facilitate the better exploitation of divergences for swing trading. The first will help you benefit from the trend continuation, and the second will be from the recovery market.
Breakout and Divergences
The range breakout strategy enables the exploitation of the continuation of the trend after a lateralization phase. This involves opening an entry after the market breaks a key price level. I wrote a complete post on the range breakouts you can reach here: Automatic Opening Range Breakout using Prorealtime
Here is an example of a bullish divergence followed by a bullish range breakout on the S&P 500:
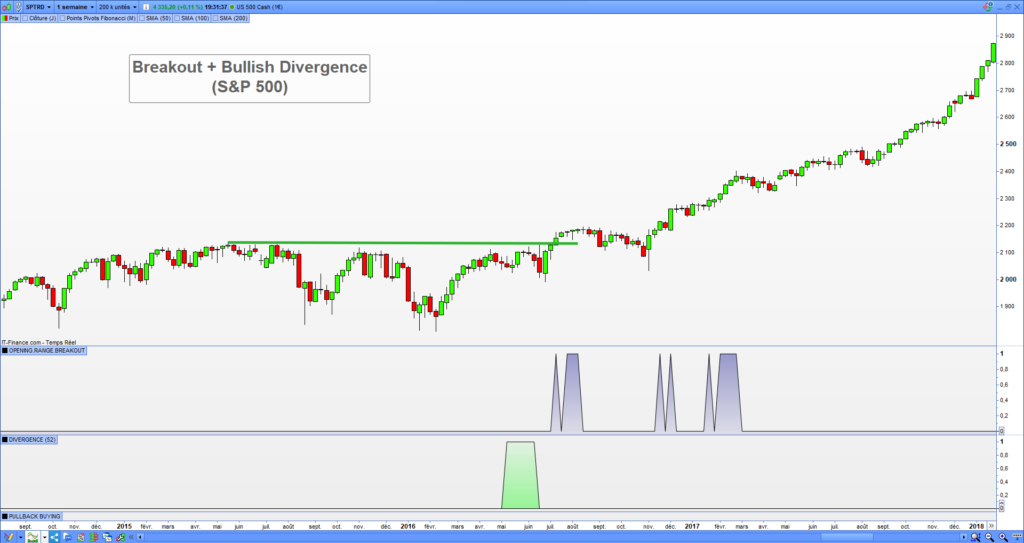
You can see on the above chart that a bullish divergence preceded the bullish range breakout. The breakout confirmed the continuation of the uptrend, with the first signs detected by the divergence indicator.
You will find the Prorealtime code of the range breakout indicator here: https://artificall.com/prorealtime/automated-opening-range-breakout/#15-code-of-the-opening-range-breakout-indicator
You can download the Range Breaker indicator, which detects all the bullish and bearish breakouts: Range Breakout Indicator for Prorealtime
Pullback and Divergences
The pullback buying strategy enables investors to capitalize on a trend recovery following a short-term bear market. I wrote a complete post on the pullback buying strategy, which is available here: How to benefit from Pullbacks on the market?
Here is an example of a pullback signal followed by a bullish divergence occurring on the Apple stock:
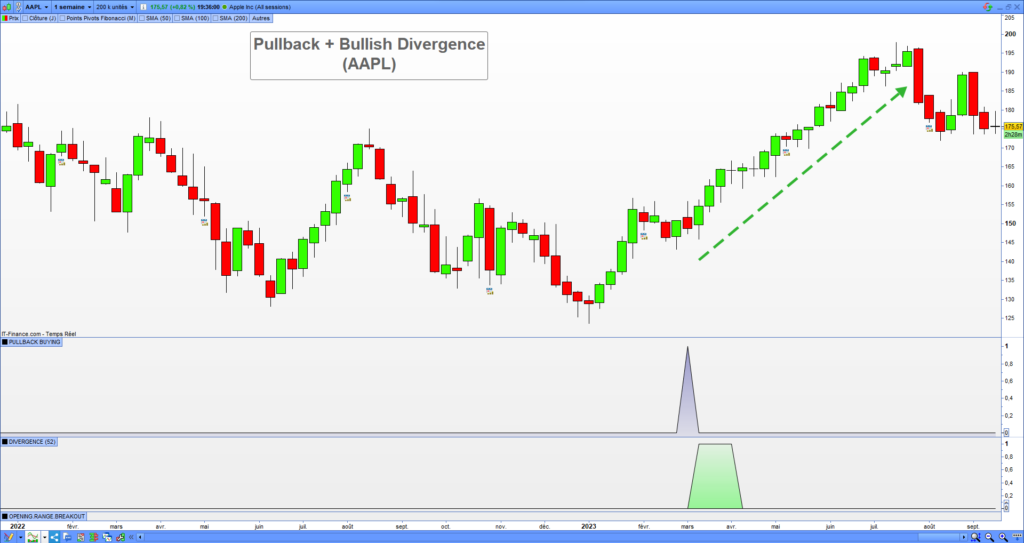
The pullback signal had been confirmed by the bullish divergence occurring. Later, the uptrend recovered.
You will get the Prorealtime code of the pullback buying indicator here: https://artificall.com/prorealtime/how-to-benefit-from-pullbacks-on-the-market/#9-pullback-indicator-for-prorealtime
Swing trading and divergence conclusions
The buying signals and the bullish divergence did not co-occur in the two previous cases. Both succeeded one another. In the first case, the divergence occurred before the buying signal, and in the second, it occurred later. The best approach is to remain flexible when incorporating divergences into your trading strategy. The divergence is additional information you can integrate into your trading setup.
How do we use divergence to invest better?
You can use the divergences to time long-term entry openings. You have to adapt the time unit of the divergence indicator by setting a weekly or monthly timeframe. For example, you could define the length of the divergence calculation as 52 weeks or 12 months.
The following chart shows a 52-week bullish divergence on the S&P 500 after the 2008-2009 crash. This divergence has been followed by the beginning of a durable uptrend:
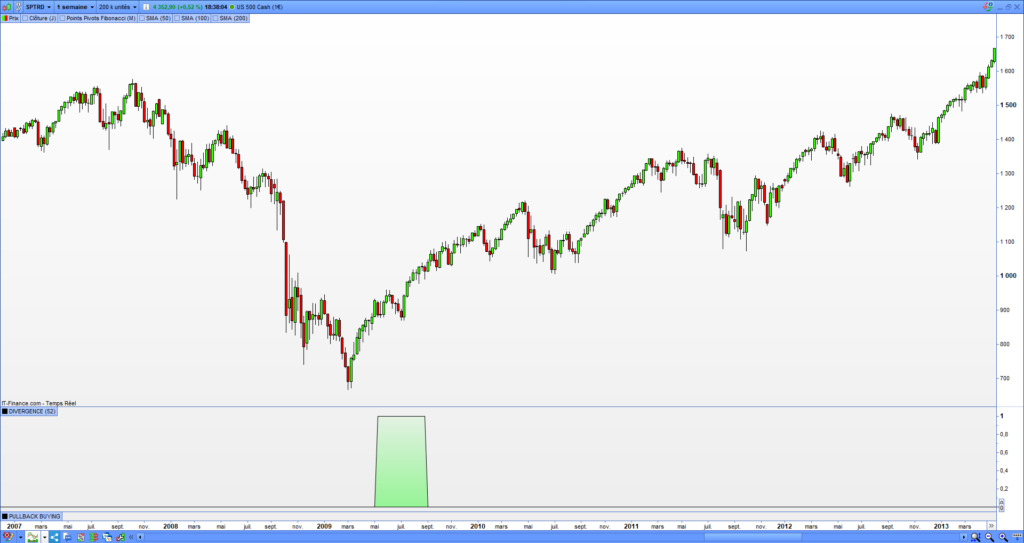
In the case of long-term investment, you don’t necessarily need a buying signal to open a long entry on a stock or an index. The most important is the fundamental and macroeconomic analysis. The occurrence of a monthly divergence on an index like the S&P 500 is often followed by a new bullish cycle. You can use divergences to confirm your macroeconomic analysis and start a position construction.
Find the best opportunities thanks to a divergence screener
I will show you how to create a divergence screener that is runnable on the Prorealtime platform. That will allow you to find the best stock, index, and ETF opportunities. You will use this screener in both day trading and swing trading.
Code of the divergence screener for Prorealtime
The following source code will detect bullish and bearish divergences. To run it, you must open the screener windows on the Prorealtime platform, create a new screener, and copy-paste the code:
//------------------------------------------------------//
// * BULLISH AND BEARISH DIVERGENCE SCREENER *        * //
//------------------------------------------------------//
// Vivien Schmitt
// https://artificall.com
//------------------------------------------------------//

//------------------------------------------------------//
// * PARAMETERS
//------------------------------------------------------//
// length of the divergence calculation period
divergenceWidth = 100 //50
// Type of divergence
// Bullish divergence: 1
// Bearish divergence: -1
typeOfDivergence = 1

//------------------------------------------------------//
// INITIALIZATION
//------------------------------------------------------//
DIVERGENCE = 0
ISDIVERGENCE = 0

//------------------------------------------------------//
// * INDICATOR CALCULATIONS
//------------------------------------------------------//
trend = linearregressionslope[divergenceWidth](close)
strength = linearregressionslope[divergenceWidth](rsi[14])

//------------------------------------------------------//
// * DIVERGENCE DETECTION
//------------------------------------------------------//
IF trend < 0 and strength > 0 THEN
  IF typeOfDivergence = 1 THEN
    // BULLISH DIVERGENCE
    ISDIVERGENCE = 1
    DIVERGENCE = 1
  ENDIF
ELSIF trend > 0 and strength < 0 THEN
  IF typeOfDivergence = -1 THEN
    // BEARISH DIVERGENCE
    ISDIVERGENCE = 1
    DIVERGENCE = -1
  ENDIF
ELSE
  // NO DIVERGENCE
  DIVERGENCE = 0
ENDIF

//------------------------------------------------------//
// * DIVERGENCE SCREENER
//------------------------------------------------------//
SCREENER [ISDIVERGENCE](DIVERGENCE as "DIVERGENCE")
The typeOfDivergence variable allows you to specify the type of divergence you want. You must set 1 for this variable to find bullish divergences and -1 for bearish divergences.
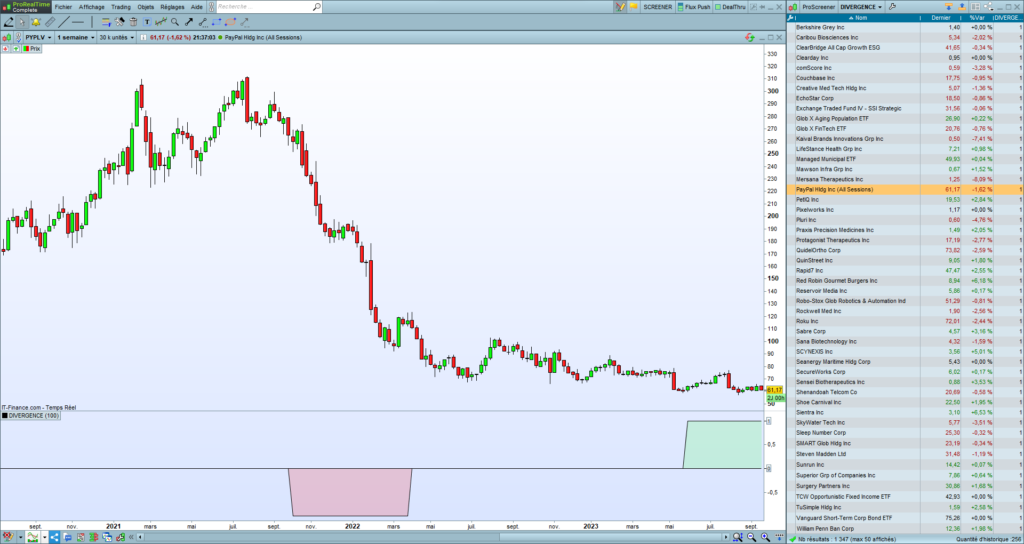
Example of the divergence screener execution
Here is an example of the result returned by the screener on the Nasdaq index. I run the screener in a weekly timeframe, and I set 1 to the “typeOfDivergence” variable to find bullish divergences. The selected stock on the following screenshot is PayPal:
Risks associated with divergence trading
Trading divergences carries risks, as do most trading strategies. Here are the main ones:
- The timing
A divergence can appear too soon before the trend reversal. Sometimes, it takes several days or weeks for the market to take a new direction. Therefore, it is useless to open an entry immediately after the divergence detection.
- The bullish bias
Most of the time, a bearish divergence on a powerful index like the SP500 or the Nasdaq predicts price lateralization more than a bear market. Bull markets are interrupted by pauses that reveal divergences.
- The indicator parameters
The divergence detection depends on the indicator parameters. In the example I provided in this post, I set 50 or 100 periods of divergence length for the trading strategy and 12 months for the investing. An indicator’s parameter values can strongly impact a strategy’s performance.
- The signal
Divergence is not a sufficient signal for buying or selling. It gives information about a context, and the result of a trade will mainly depend on the buying or selling signal. However, I think divergences can help you increase your strategy’s performance.
- The market noise
The divergence could be caused by market noise. A highly volatile market can trigger false bullish or bearish divergences. Many bullish divergences happened during the 2008 bear market. I have never found a technical indicator that works well during a market crash.
Divergence trading summary
1. A divergence is a contradiction between a trend and a strength indicator.
2. The bullish and bearish divergences indicate a bullish and bearish reversal context.
3. The divergences enhance the quality of a buying or selling signal.
4. Bullish divergences can increase the success rate of breakout or pullback signals.
5. The divergences can help to confirm a macroeconomic analysis.
6. The bearish divergences predict a consolidation more than a bear market.
7. The divergence indicator is not efficient during a market crash.
Range Breakout Indicator for Prorealtime
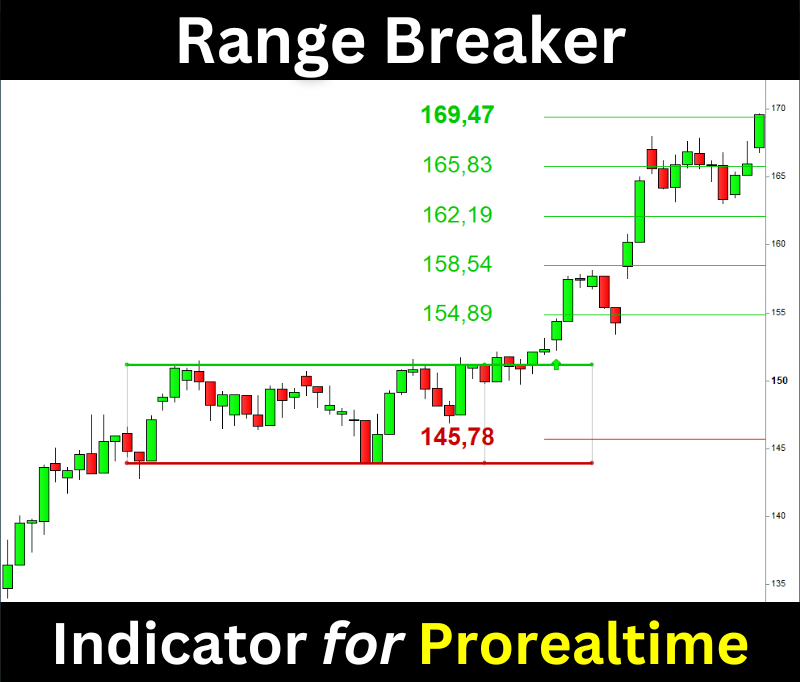
The Range Breaker will help you trade the Range Breakouts on Prorealtime. It displays the ranges, breakout signals, and target prices on your chart.