Pullback buying involves opening a long position after a moderate market decline in a solid long-term uptrend. You can use this strategy in day trading, swing trading, or long-term investment. In this post, I will show you how to benefit from pullbacks to seize trade opportunities. I will present a complete and back-tested pullback trading strategy that you will run on the Prorealtime platform.
Pullback buying: definitions
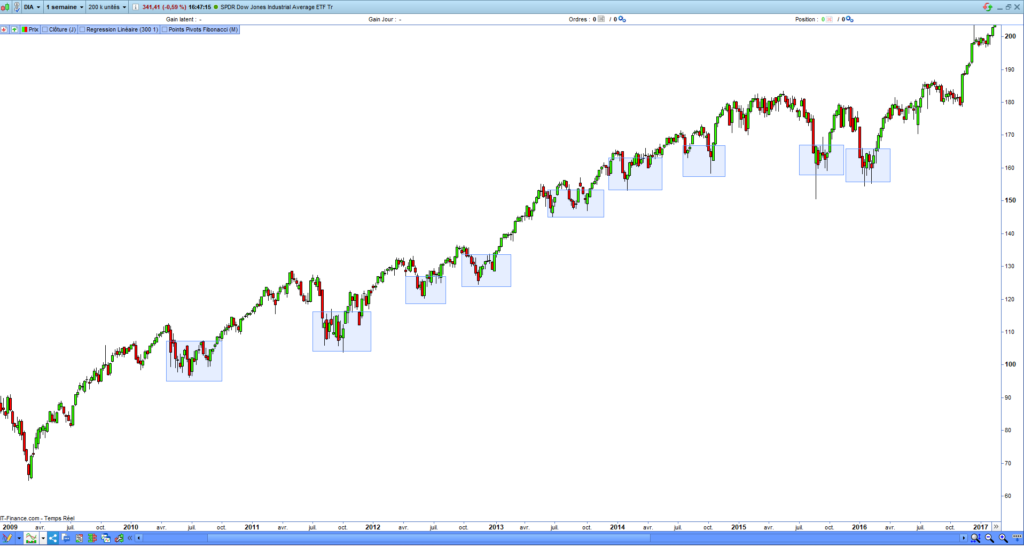
A pullback is a brief decrease in price that occurs within a solid uptrend. Even in a powerful bullish trend, the market never increases in a straight line. There are always consolidation phases that cut into the long-term uptrend. These little bearish periods allow opening a long entry before the resumption.
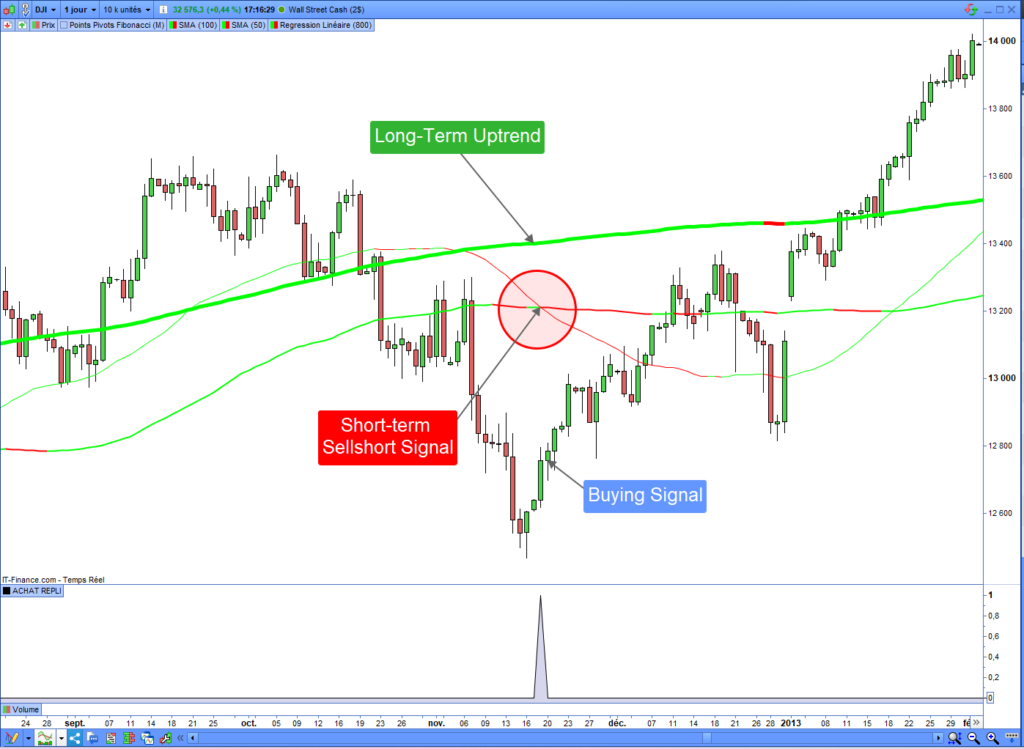
The following graphic shows pullbacks on the Dow Jones from 2009 to 2017. Each of these consolidations allows opening a long entry and benefits from the technical rebounds:
Why does the stock market consolidate?
Consolidation can occur on the market for several reasons. Here are the main of them:
- The investors take their profits to secure a piece of their latent gains.
- The market touched a significant resistance, like a previous high or a Fibonacci pivot point.
- A geopolitical or macroeconomic risk occurs with a temporary effect.
When a consolidation appears, you must determine whether the uptrend is called into question before opening a long entry. If you think the long-term uptrend will continue, you can open a long entry. If not, you would wait and opt for a buy-the-dip strategy.
What is the difference between pullback buying and buy-the-dip strategies?
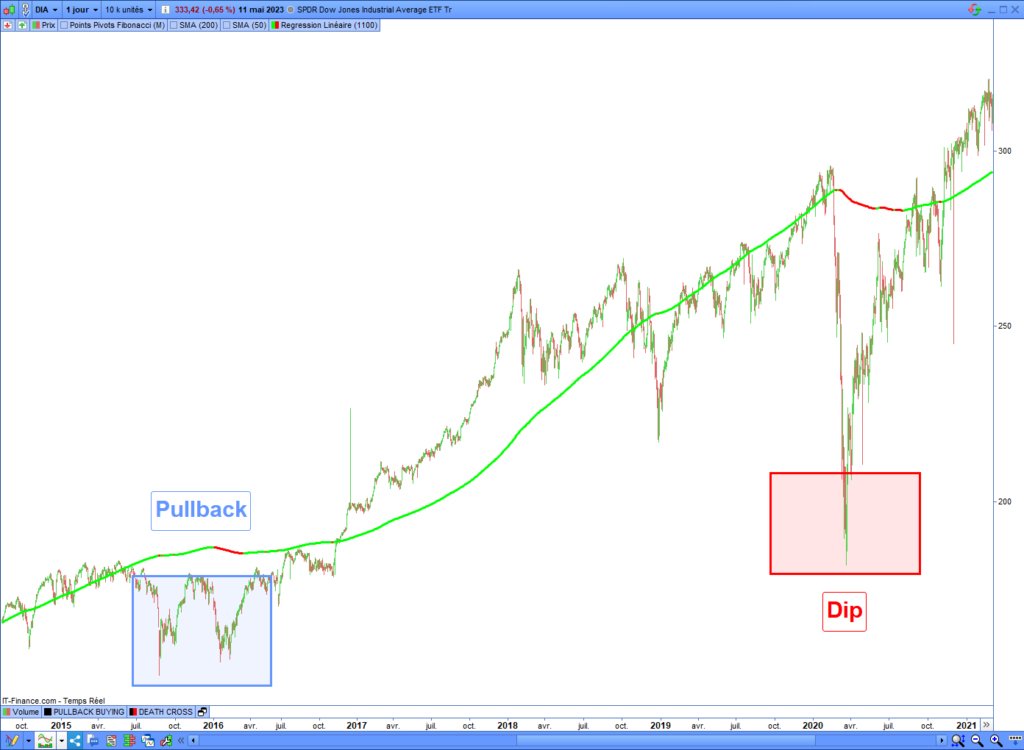
The pullback buying and buy-the-dip strategies are close, but some differences exist. These two strategies will send countertrend buying signals. However, the long-term trend remains bullish, even in the case of pullback buying, and subsequently, buy-the-dip signals emerge in a bearish market.
The following chart shows you the difference between a pullback and a dip in the market:
How to buy a pullback in the market?
There are several ways to buy a pullback in the market. I do not claim to know the best way, but the strategy I will present to you worked well for me. I have used it for several years, and it has given me positive results. First, I will tell you about the assets on which you can run a pullback strategy and how to build a pullback signals system.
What are the most adapted assets to a pullback strategy?
Not all assets are suitable for the pullback buying strategy. The too-volatile or too-cyclical assets are unsuitable for this strategy. That is the case with raw materials like gas or oil, which have a price range that is too high.
The most suitable assets for a pullback buying must have some properties. Here are the main of them:
- The volatility must be reasonable, but also not too low. The beta would be between 0.8 and 1.
- The asset must exhibit a clear bullish bias and should not be cyclical. This is true for most main indexes, such as the Dow Jones, S&P 500, or the Nasdaq.
- The asset must be accumulative or non-distributive. The dividends must be very low or reinvested. Reinvesting the dividends allows the asset to maintain its bullish bias.
Now, I will explain how to build a signal system capable of detecting a pullback on an asset.
Pullback buying signal
The technical equation of a pullback is straightforward: a pullback is a short-term bearish trend occurring in a long-term uptrend. There are many ways to buy a pullback. One of the simplest is buying a short-sell signal in a solid long-term uptrend.
To build a pullback signal system, you will need at least one indicator to measure the long-term trend and another to detect a short-sell signal.
1. Check if the long-term trend is bullish
The simplest way to measure an asset’s trend is to watch the trend indicator’s slope. If the slope is positive, then the trend is bullish. If the slope is negative, then the trend is bearish. The Prorealtime platform provides an indicator that returns the slope of a linear regression line. This indicator is called “LinearRegressionSlope.” It is helpful to measure an asset’s long-term trend.
To verify the long-term uptrend, I will calculate the slope of linear regression lines defined with several lengths. I chose to measure the trend from 1000 to 1500 periods. The following source code will check the long-term uptrend:
// UPTREND VALIDATION
CLNRS1000 = LinearRegressionSlope[1000] > 0
CLNRS1100 = LinearRegressionSlope[1100] > 0
CLNRS1200 = LinearRegressionSlope[1200] > 0
CLNRS1300 = LinearRegressionSlope[1300] > 0
CLNRS1400 = LinearRegressionSlope[1400] > 0
CLNRS1500 = LinearRegressionSlope[1500] > 0

ConditionTREND = CLNRS1000 OR CLNRS1100 OR CLNRS1200 OR CLNRS1300 OR CLNRS1400 OR CLNRS1500
The “ConditionTREND” variable will return 1 if the trend is bullish and 0 if the trend is bearish. If the slope of one of the regression lines is positive, the trend will be considered bullish.
2. Detect a short-term sell signal
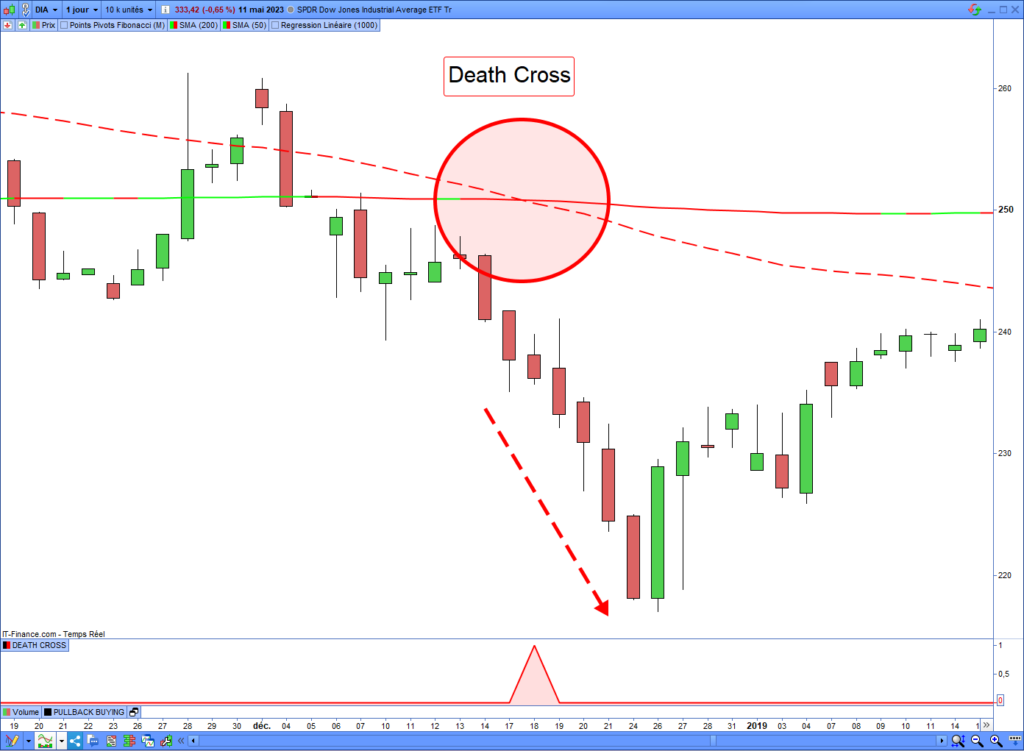
Many sell-short signals exist, like bearish breakouts or trend indicator bearish crossing. Most importantly, the signal must appear in a smaller time unit than the long-term trend. One of the most well-known sell-shorting signals is the “Death Cross”. This signal occurs when the 50-period moving average crosses under the 200-period moving average.
Here is a Death Cross example that occurred on the Dow Jones index on December 18, 2018:
The following source code will detect the Death Crosses on any assets:
// SHORT-TERM SELLSHORT SIGNALS
MM50 = average[50]
MM200 = average[200]

conditionMM = MM50 CROSSES UNDER MM200
The “conditionMM” variable will return 1 if the 50-period moving average crosses under the 200-period moving average and 0 if not.
Pullback indicator for Prorealtime
Let me present you with a complete pullback buying indicator working on the Prorealtime platform. This indicator will return a buying signal when a short sell signal occurs while a solid bullish trend.
Pullback buying indicator
The following source code will give you pullback buying signals. You can use it in different time units on assets such as futures contracts, ETFs, or stocks. I added the bearish crossing of the 50-period moving average by the 100-period moving average to obtain more signals:
// * PULLBACK BUYING PROREALTIME INDICATOR * //

// SHORT-TERM SELLSHORT SIGNALS
MM50 = average[50]
MM100 = average[100]
MM200 = average[200]

MM50C100 = MM50 CROSSES UNDER MM100
MM50C200 = MM50 CROSSES UNDER MM200

conditionMM = MM50C100 OR MM50C200

// UPTREND VALIDATION
CLNRS1000 = LinearRegressionSlope[1000] > 0
CLNRS1100 = LinearRegressionSlope[1100] > 0
CLNRS1200 = LinearRegressionSlope[1200] > 0
CLNRS1300 = LinearRegressionSlope[1300] > 0
CLNRS1400 = LinearRegressionSlope[1400] > 0
CLNRS1500 = LinearRegressionSlope[1500] > 0

ConditionTREND = CLNRS1000 OR CLNRS1100 OR CLNRS1200 OR CLNRS1300 OR CLNRS1400 OR CLNRS1500

// PULLBACK BUYING SIGNALS
IF ConditionTREND AND conditionMM THEN
  ACHATREPLI = 1
ELSE
  ACHATREPLI = 0
ENDIF

RETURN ACHATREPLI AS "PULLBACK BUYING"
Pullback signal example
Here is an example of a pullback buying signal on the Dow Jones in a daily time unit. As shown on the chart, a sell-short signal occurred, and the uptrend remained strong thereafter. Opening a long entry after this signal would have been profitable:
Pullback buying automated strategy
I will develop a pullback buying automated strategy utilizing the indicator I demonstrated to you. I decided to create a swing trading strategy. That means the trading system will continue to open entries until the price target or the stop loss is reached. The position duration could be from a few days to a few weeks.
Code of the pullback trading strategy
Here is the source code of the pullback trading strategy, which is runnable on the Prorealtime platform. This strategy will open long entries after a short-term sell short signal in a bullish long-term trend. All the entries will have a target and a stop loss:
// * PULLBACK BUYING PROREALTIME STRATEGY

DEFPARAM CUMULATEORDERS = true

maxCapital = 5000
capitalByEntry = 1000
numberShare = max(1, floor(capitalByEntry / close))
nextPosition = numberShare * close

condiTionMaxCapital = (investedCapital + nextPosition) < maxCapital

stoplossPercent = 20
targetPercent = stoplossPercent * 3

// Pullback buying signal
MM50 = average[50]
MM100 = average[100]
MM200 = average[200]
MM50C100 = MM50 CROSSES UNDER MM100
MM50C200 = MM50 CROSSES UNDER MM200
conditionMM = MM50C100 OR MM50C200

// Uptrend validation
CLNRS1000 = LinearRegressionSlope[1000] > 0
CLNRS1100 = LinearRegressionSlope[1100] > 0
CLNRS1200 = LinearRegressionSlope[1200] > 0
CLNRS1300 = LinearRegressionSlope[1300] > 0
CLNRS1400 = LinearRegressionSlope[1400] > 0
CLNRS1500 = LinearRegressionSlope[1500] > 0

ConditionTREND = CLNRS1000 OR CLNRS1100 OR CLNRS1200 OR CLNRS1300 OR CLNRS1400 OR CLNRS1500

// PULLBACK SIGNAL
ACHATREPLI = 0
ACHATREPLI = ConditionTREND AND conditionMM

IF ACHATREPLI AND condiTionMaxCapital THEN
  BUY numberShare SHARES AT MARKET
  SET STOP %LOSS stoplossPercent
  SET TARGET %PROFIT targetPercent
ENDIF

// Invested capital update
IF COUNTOFPOSITION[1] <> COUNTOFPOSITION THEN
  IF positionprice <> 0 THEN
    investedCapital = investedCapital + positionprice * numberShare
  ELSE
    investedCapital = 0
  ENDIF
ENDIF
Pullback buying code explanation
In the previous code, I turned the pullback indicator into a signal system. However, I implemented some additional specific conditions for swing trading.
Pullback buying signal
The buying signal is triggered when a short-term sell signal occurs in a long-term uptrend. In this case, the variable “ACHATREPLI” will return 1:
// PULLBACK SIGNAL
ACHATREPLI = 0
ACHATREPLI = ConditionTREND AND conditionMM
Position size calculation
The system will open positions by a stack of 1000$. The maximum engaged capital will be 5000$. If the maximum engaged capital is reached, then the system will not open other entries:
maxCapital = 5000
capitalByEntry = 1000
numberShare = max(1, floor(capitalByEntry / close))
nextPosition = numberShare * close

condiTionMaxCapital = (investedCapital + nextPosition) < maxCapital
Entry opening
The system will check two conditions before opening an entry: the buying signal and the available capital. If both conditions are satisfied, the system will buy several contracts corresponding to the value of the “numberShare” variable. Later, it will place a stop loss and a target:
IF ACHATREPLI AND condiTionMaxCapital THEN
  BUY numberShare SHARES AT MARKET
  SET STOP %LOSS stoplossPercent
  SET TARGET %PROFIT targetPercent
ENDIF
Invested capital updating
This strategy accumulates open entries. After each entry opening, the system calculates the invested capital to update the “investedCapital” variable. This variable will indicate whether the maximum capital has been reached. In this case, the system will stop entry openings.
The Prorealtime “COUNTOFPOSITION” instruction returns the number of opened entries. The “positionprice” instruction gives the average price of the total position opened by the system. If the number of opened entries is modified and the average price is not equal to zero, the system has opened a new entry. If not, that means the system had closed the position, then it is necessary to set 0 to the “investedCapital” variable:
// Invested capital update
IF COUNTOFPOSITION[1] <> COUNTOFPOSITION THEN
  IF positionprice <> 0 THEN
    investedCapital = investedCapital + positionprice * numberShare
  ELSE
    investedCapital = 0
  ENDIF
ENDIF
Backtest of the pullback buying strategy
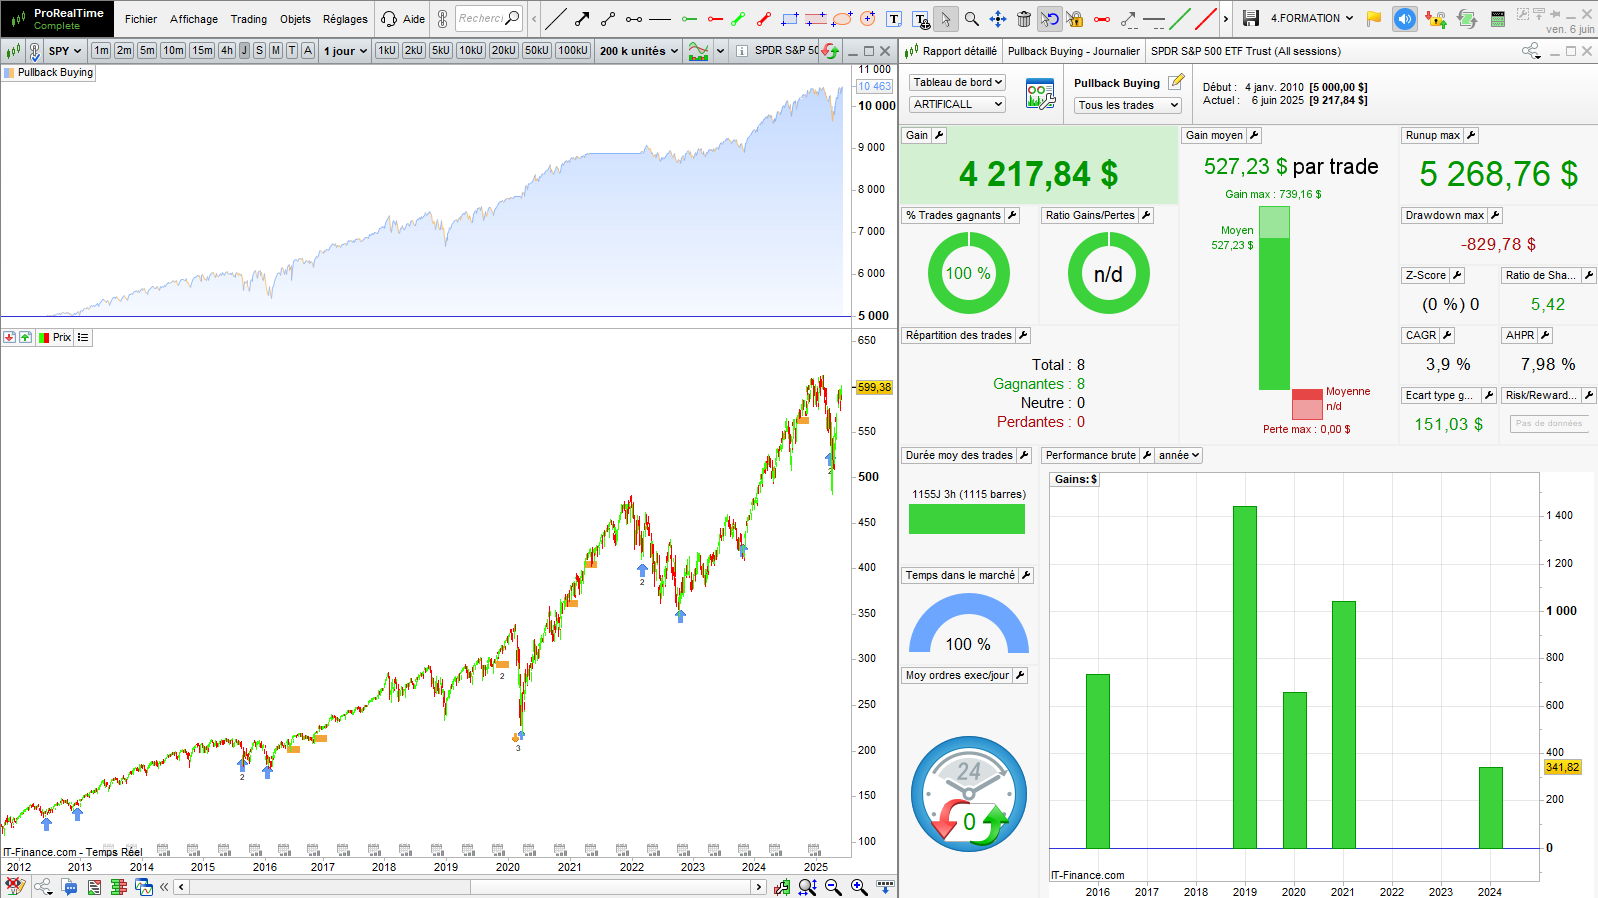
I will run this automated strategy on the SPDR S&P 500 ETF Trust on a daily basis. I defined a capital of $5,000, a position size of $1,000, and a 0.5% transaction fee.
Detailed report
Here is the obtained result of the pullback buying strategy:
Detailed report
You can download the detailed report to obtain more information about the position price, size, and the transaction date:
Interpretation of the result
This strategy would have been profitable during the backtest period, achieving a performance of 84%. The $829 drawdown is low compared to the $5,268 runup. The compound annual growth rate (CAGR) of the strategy is 3.9% %. The CAGR gives the annualized return of the strategy. This performance may seem poor, but you will note that this strategy correctly exploited the pullbacks six times out of seven.
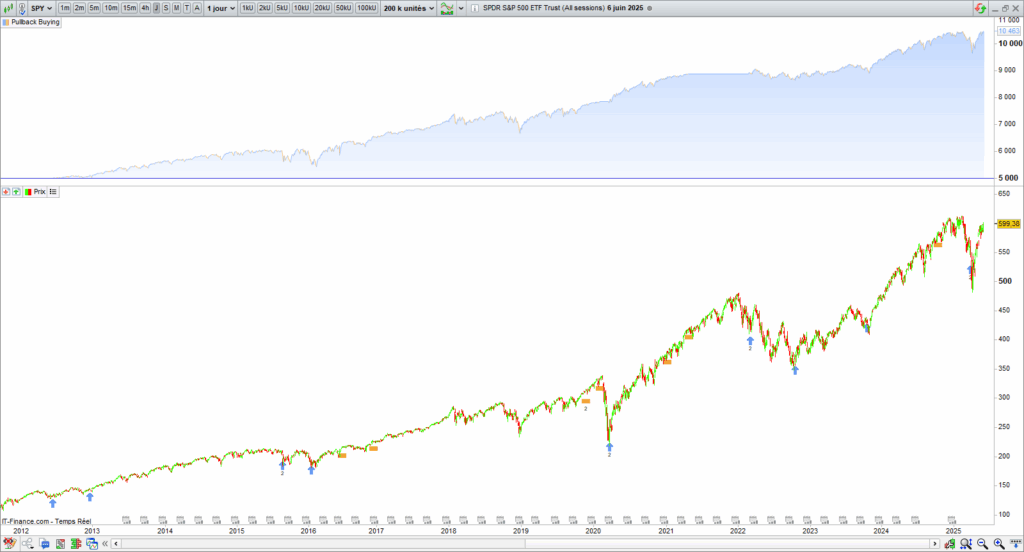
Equity curve
The equity curve of this strategy is very regular and has a low drawdown. It reproduces the underlying variation price with less volatility:
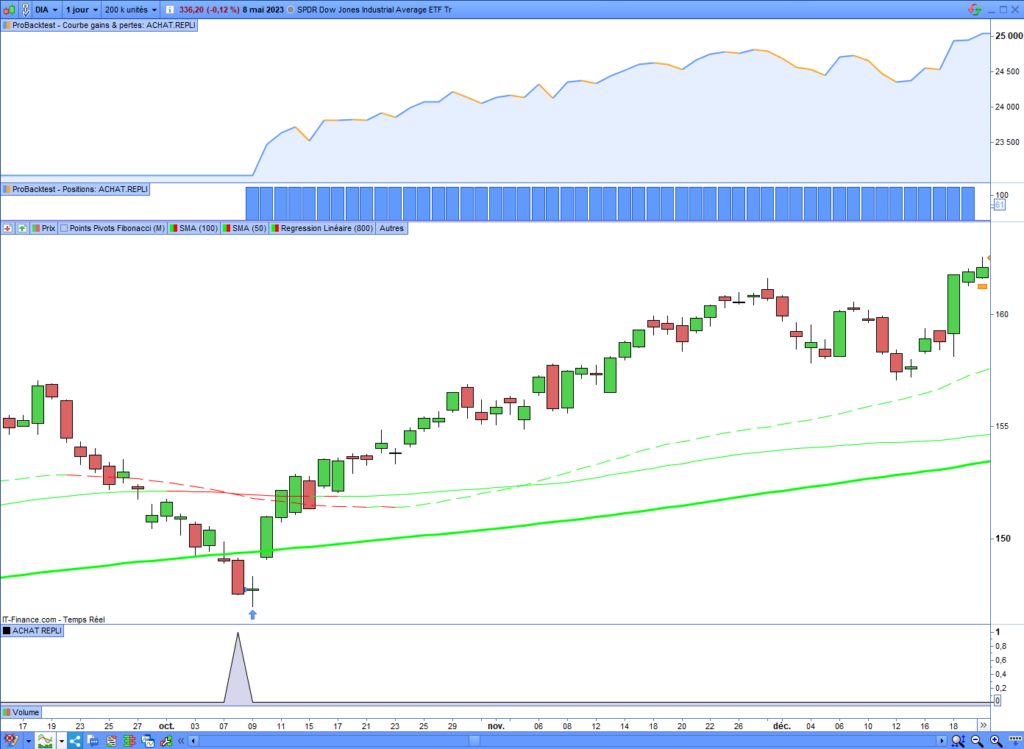
Entry opening example
Here is an example of a pullback entry opening executed by this automated strategy within a daily time frame. This entry opened after a Death Cross occurred in a long-term uptrend. The short-term configuration seemed bearish, but the long-term uptrend was not invalidated:
The risks of the Pullback strategy
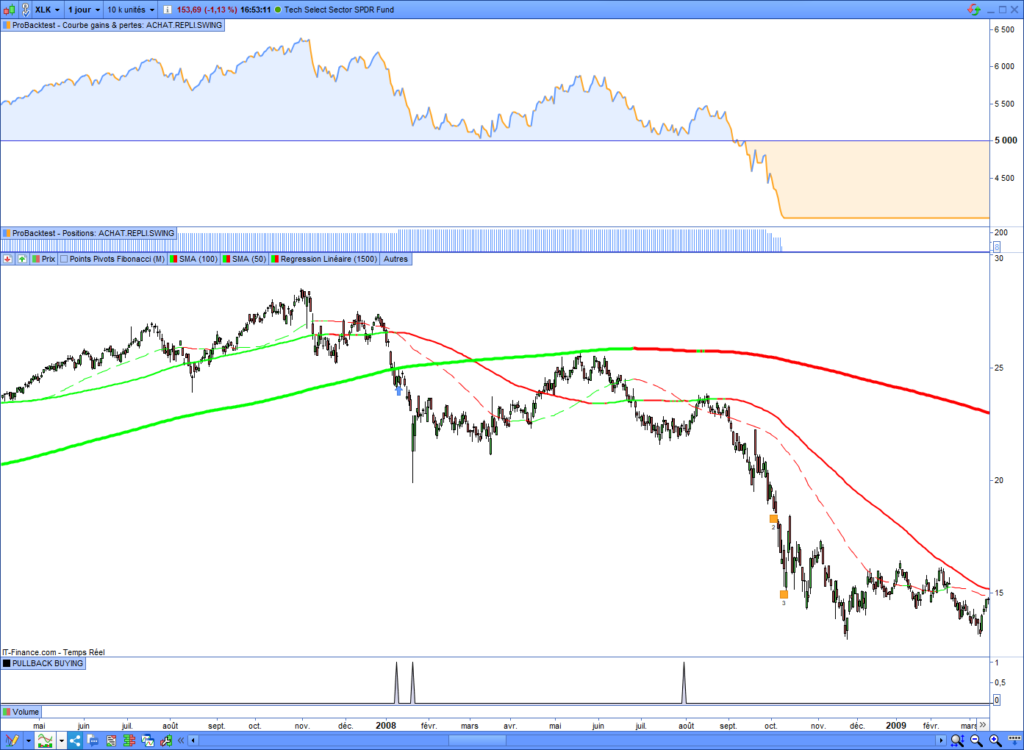
Like all trading strategies, pullback buying contains risks. This strategy’s most significant risk is opening a long entry at the beginning of a bear market. That is why you imperatively must place a stop loss on your position. When an economic crisis happens, like in 2008, it would be better to cut all your open long entries before their stop loss is touched. In addition, you should inactivate the trading systems and stop buying the market until the end of the storm.
In the following chart, you can see the behavior of this strategy on the Technology Select Sector SPDR® ETF during the 2008 crash. The pullback buying system confused a pullback with the beginning of a big bear market:
How to use the pullbacks to invest?
Using the pullback to invest from a long-term perspective is perfectly possible. The advantage is that a technical rebound often follows a pullback. That allows you to obtain a bit of latent gain quickly. You can also use the pullback to reinforce your portfolio. You can use the pullback signal system I presented in this post to invest in the Dow Jones, the S&P 500, and the Nasdaq ETFs.
Code of the Pullback Investment System
The following source code will allow you to backtest the pullback investment strategy with a “buy and hold” approach. The code is more straightforward than the swing trading system. The strategy remains the same, regardless of whether a target or stop-loss is specified. After each pullback signal, the following investment system will open and keep a long entry. I set 100000$ as the maximal capital and 2500$ as the position size:
// * PULLBACK INVESTMENT STRATEGY PROREALTIME* //
maxCapital = 100000
capitalByEntry = 2500
numberShare = max(1, floor(capitalByEntry / close))
nextPosition = numberShare * close
condiTionMaxCapital = (investedCapital + nextPosition) < maxCapital
// Pullback buying signal
MM50 = average[50]
MM100 = average[100]
MM200 = average[200]
MM50C100 = MM50 CROSSES UNDER MM100
MM50C200 = MM50 CROSSES UNDER MM200
conditionMM = MM50C100 OR MM50C200
// Uptrend validation
CLNRS1000 = LinearRegressionSlope[1000] > 0
CLNRS1100 = LinearRegressionSlope[1100] > 0
CLNRS1200 = LinearRegressionSlope[1200] > 0
CLNRS1300 = LinearRegressionSlope[1300] > 0
CLNRS1400 = LinearRegressionSlope[1400] > 0
CLNRS1500 = LinearRegressionSlope[1500] > 0
ConditionTREND = CLNRS1000 OR CLNRS1100 OR CLNRS1200 OR CLNRS1300 OR CLNRS1400 OR CLNRS1500
// PULLBACK SIGNAL
ACHATREPLI = 0
ACHATREPLI = ConditionTREND AND conditionMM
IF ACHATREPLI AND condiTionMaxCapital THEN
BUY numberShare SHARES AT MARKET
ENDIF
// Invested capital update
IF COUNTOFPOSITION[1] <> COUNTOFPOSITION THEN
IF positionprice <> 0 THEN
investedCapital = investedCapital + positionprice * numberShare
ELSE
investedCapital = 0
ENDIF
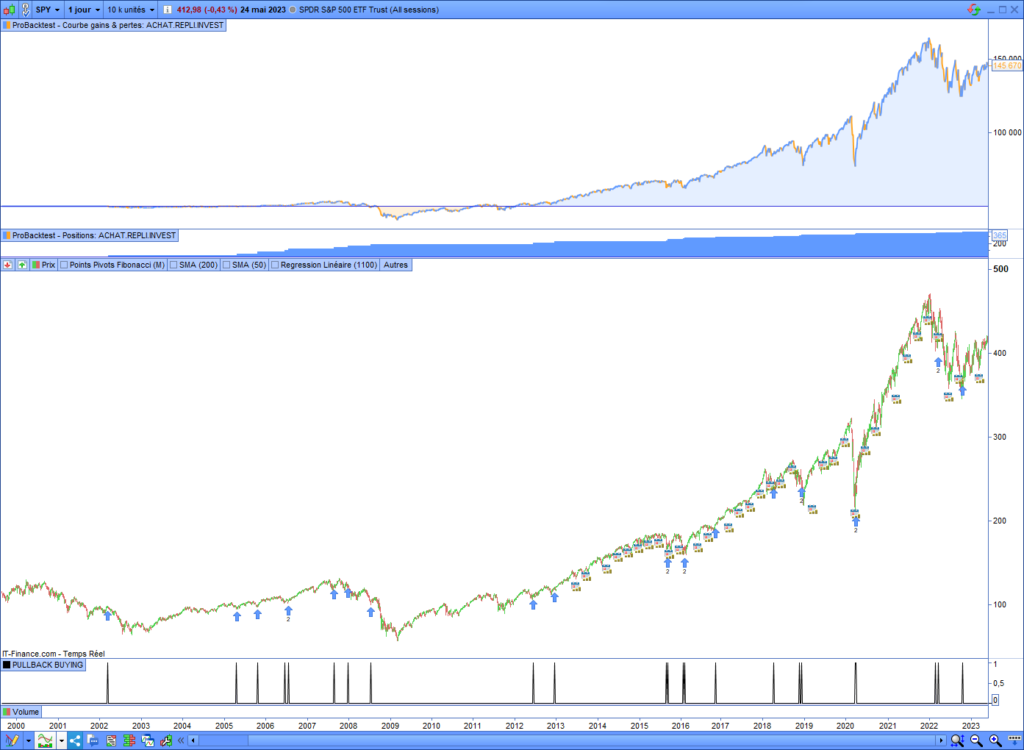
ENDIFBacktest of the pullback investment strategy
Here is the equity curve of the pullback investment strategy on the SPDR S&P 500 ETF Trust. This strategy has opened and kept entries after each pullback signal since 2000. The equity curve reproduces the underlying without overperforming. You can ask yourself about the pertinence of this strategy from a long-term perspective. However, the pullback indicator has identified the pullbacks well, which can be useful for strengthening a position in your portfolio.
Pullback buying summary
1. This pullback strategy provides excellent buying signals.
2. It offers trade opportunities during consolidation phases.
3. The pullback strategy can be used for trading or strengthening a long-term portfolio.
4. The main risk is opening a long entry at the beginning of a bear market
Range Breakout Indicator for Prorealtime
The Range Breaker will help you trade the Range Breakouts on Prorealtime. It displays the ranges, breakout signals, and target prices on your chart.