You can find many automated trading systems on the internet that show superhuman performance on paper. But, when you launch it on your real account, you immediately lose your money.

A series of questions is being raised to which I shall refer in this post:
- How do we know if a strategy is robust or over-fitted?
- How do I ensure my strategy doesn’t lose money immediately after production launches?
- Is there any way to evaluate the robustness of a strategy?
I will explain what you should verify to be sure your automated trading system is over-fitted. I created a battery of tests to validate the robustness of a strategy before launching it on a real account. In this post, I will show you some tests you can make at a glance.
The global standard deviation of your strategy
The first thing you should watch is the standard deviation over the duration of the strategy. The standard deviation should not be too high and should be regular over the duration of the strategy. This regularity must be independent of market fluctuations.
Too large standard deviation
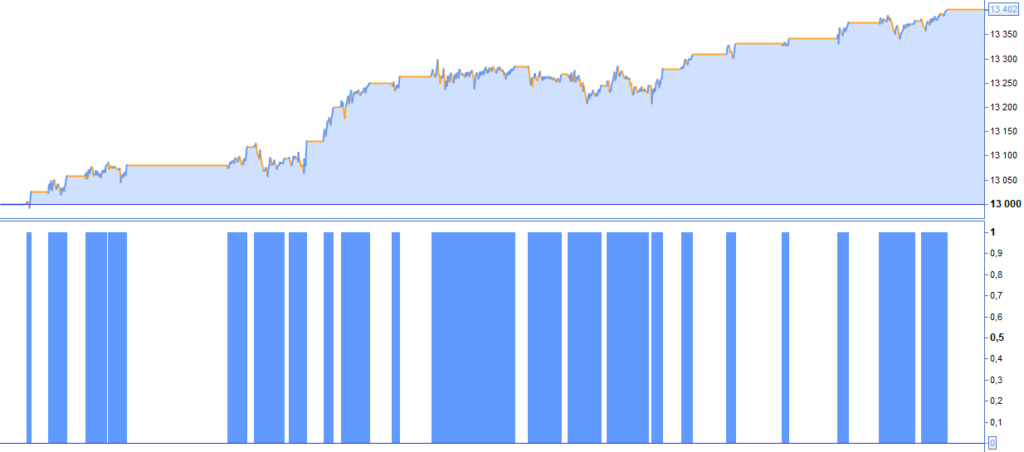
Here is the result of a strategy reflecting too large a standard deviation:
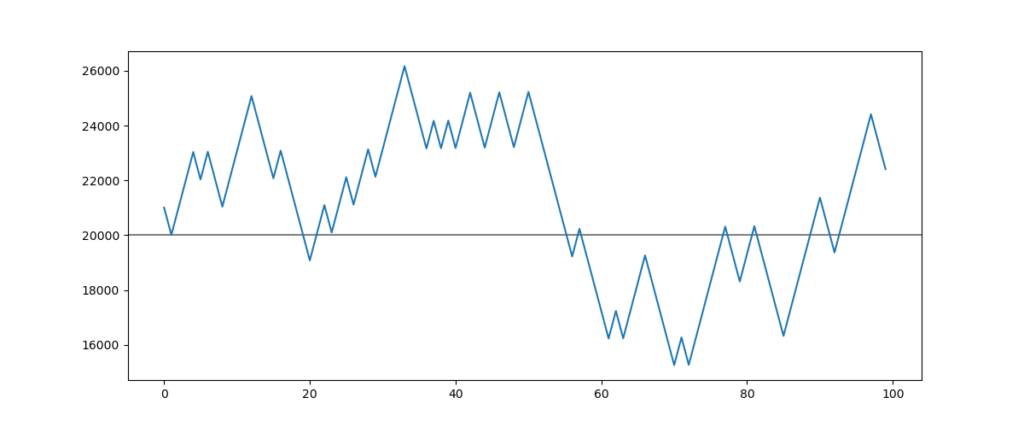
This strategy performs greater than 10%, but the standard deviation exceeds 30%.
Acceptable standard deviation
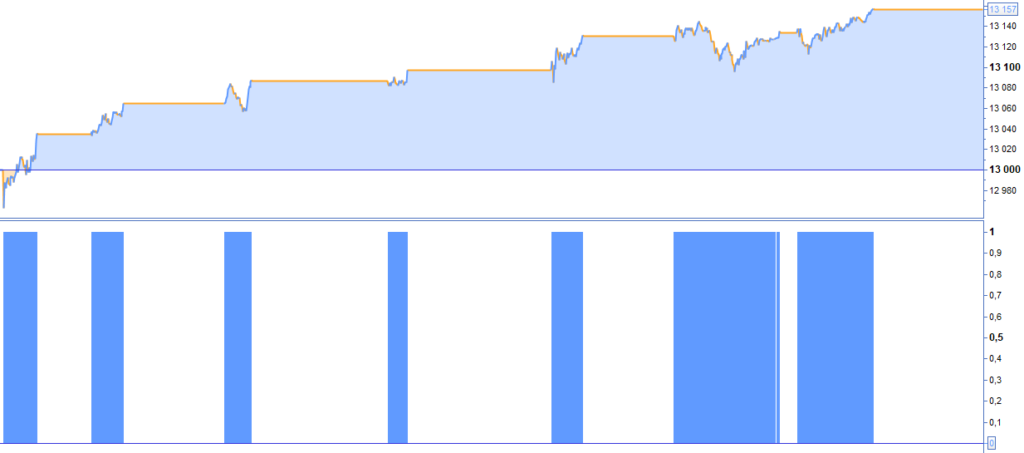
Here is the result of a strategy reflecting a reasonable standard deviation:
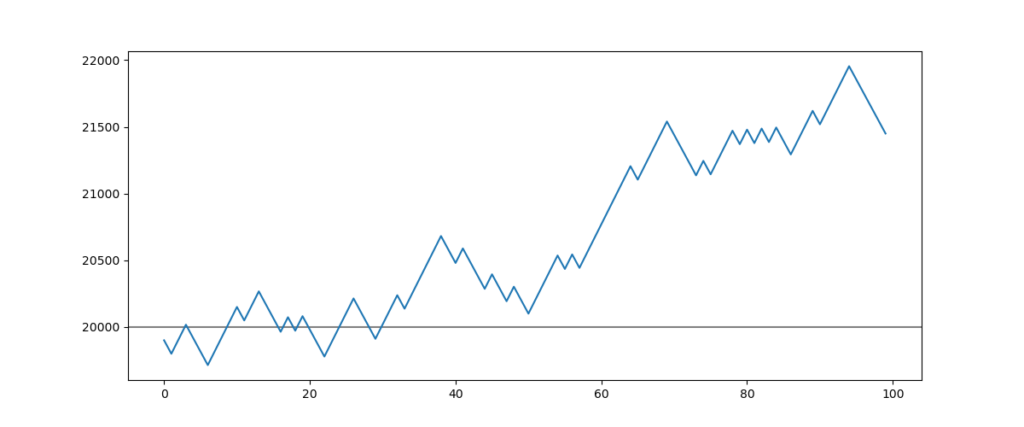
This strategy performs lower than 10%, but the standard deviation is lower than 2.5%.
The performance of the first strategy is more than double that of the second, but its standard deviation is very high. That reflects more uncertainty and, thus, more risks.
The performance of the second strategy is lower than the previous one, but its standard deviation is much smaller. That means the risk of the second strategy is lower than the first; thus, it will be more profitable in the long term.
Earnings distribution
The earnings should not be concentrated on a short period of your test. If earnings are concentrated on a little part of the test period, that is evident proof of over-fitting. That means your strategy is over-fitted on a small part of the market, which is unlikely to happen again.
Too concentrated earnings distribution
Here is the result of a too-concentrated earnings distribution on a period of the market:
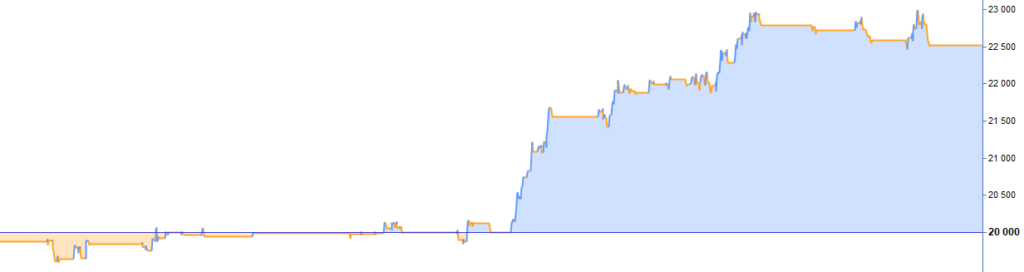
This strategy produces a performance greater than 10%, but earnings are concentrated on a small part of the test.
Dispersed earnings distribution
The following backtest shows the strategy generates steady gains throughout the test period:
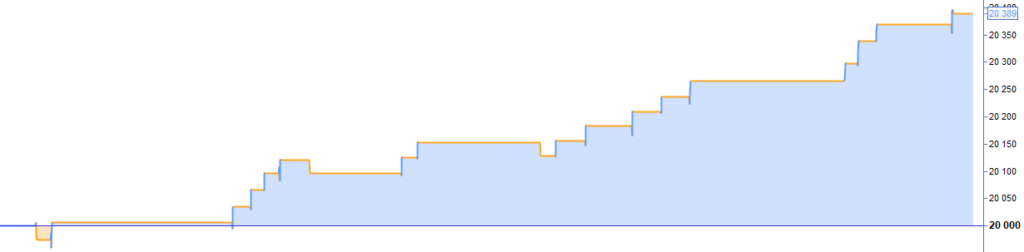
This strategy produces a performance lower than 2%, but earnings are dispersed on all test periods.
The earning distribution can be used to distinguish two strategies. It would be better to choose a less profitable strategy but with more regular profits.
The measure of Tracking Error
The tracking error allows you to measure whether a strategy follows the traded asset. It is the standard deviation of the difference between strategy performance and asset performance.
Tracking Error = σ(Strategy return – Asset return)
A tracking error of a robust strategy would be as small as possible.
Tracking error of a strategy
The graph below shows an example of a strategy performance with its asset performance. We can see the gains curve follows the asset curve. The difference between strategy performance and asset performance is rather stable. We can say the tracking error is acceptable. Thus, the strategy is also acceptable.
Some strategies, such as “scalping” can be uncorrelated with their asset cause they execute themselves in a very short-term time frame. In this case, it could be correct that this kind of strategy is more impacted by volatility than the global trend.
Personally, I prefer to avoid markets that are too volatile, even if there is a bull trend. Thus, it is normal to observe a slightly higher tracking error in this case.
If the tracking error is nearly zero, it might be less risky to buy and hold a tracker of this asset.
However, if the tracking error of your strategy is near zero with leverage lower or equal to 1 but capable of closing its position each day at market closing, it could be exciting. Cause, in this case, your strategy reaches to replicate the performance of traded assets but keep safe your cash each evening. That allows you to increase your capacities of capital allocation management and decrease your exposition to financial risks.
The profit/loss ratio
The average profit would be greater than the average loss. On the other hand, these are expected for the highest profit, which would also be greater than the lowest loss.
In practice, your backtest’s profit/loss ratio is not always relevant. Why? Cause it’s too easy to cheat yourself. I will explain to you why. If you launch a backtest whose number of losing entries is too important for you, you may be tempted to move away and stop loss. In this way, you were artificially inflating the success rate of your strategy. Because if a stop loss is placed lower, the likelihood that it touched is lower. In return, risks will increase cause when a stop loss is touched. There will be a bigger loss.
We could push it to its paroxysm, removing stop loss. Obviously, if the market is extremely bullish, this way will be very profitable until the market backfires on you.
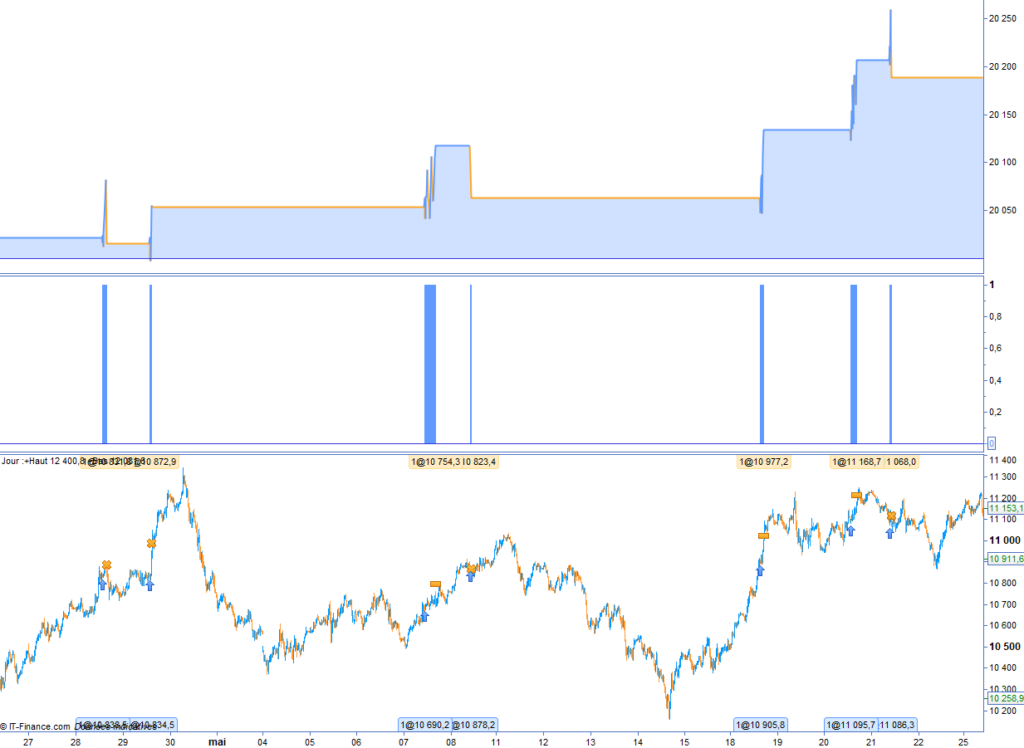
In the following example, I voluntarily over-fitted the profit rate of a strategy by increasing stop loss at 1000 points on the DAX Index:
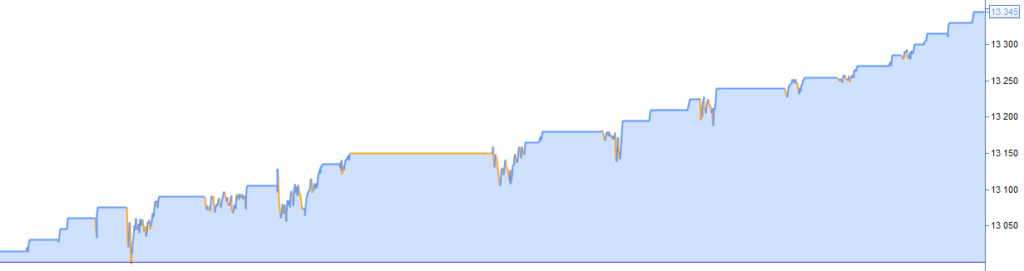
This strategy shows a profit rate of 100% on 23 entries. This result appears exceptional, but if you look at the profit curve, something should jump out at you: we can see that an entry creates an enormous latent loss sometime before the win.
Now, look at what would have happened if I had started this strategy on my real account for some weeks:
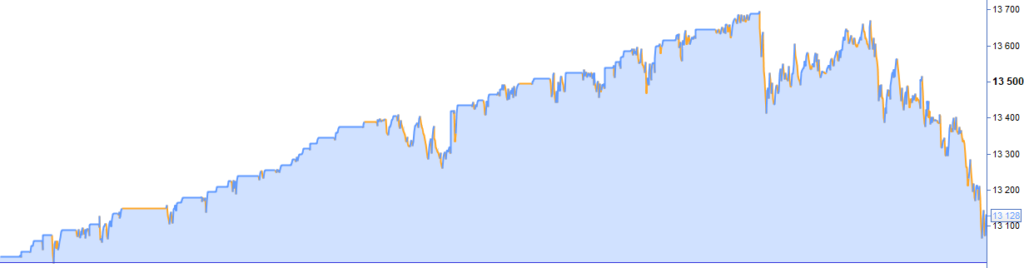
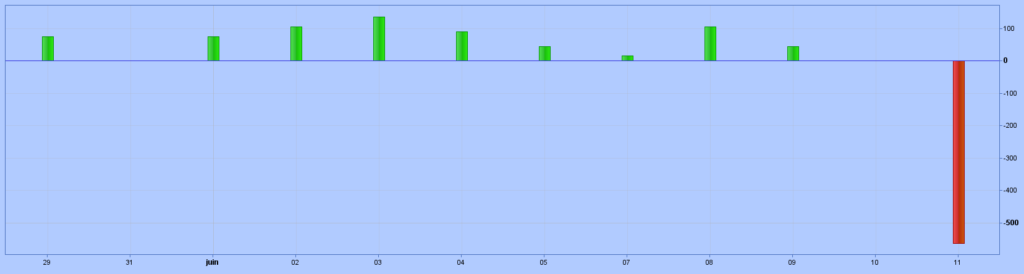
The strategy takes only one loss, but it is a loss of 562 points. And just one loss of 562 points against an average profit of 15 points can devastate all strategy performance.
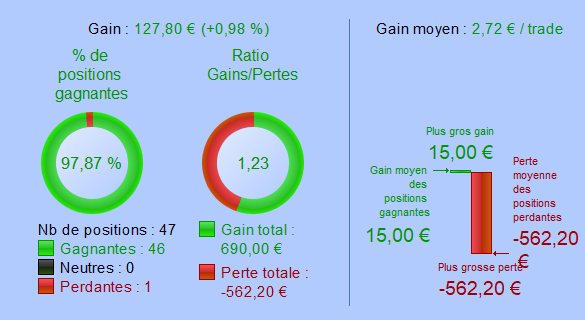
Here, we can see the consequences of only one big loss on all strategy profit:
You should be attentive to your backtest’s profit/loss ratio. Cause that does not reflect the reality every time. To compute the true profit/loss ratio, you need to use stop loss instead of average loss.
If you want to learn more about the profit/loss ratio, I invite you to read this post: Simulate the back to heads or tails
Profit securing
For robustness, a strategy must be equipped with a profit-securing mechanism. This mechanism aims to automatically place a sell-stop order when the latent profits are greater than a certain level.
In this way, if the price falls before reaching the initial target, the opened position will stay a winner. (except if there is a gap or a flash crash)
Therefore, it is indispensable that you verify if your strategy secures profits, looking at the latent profits that do not turn themselves into losses or ridiculous gains. You can easily control that at a glance because if profits are not secured, some pikes will appear on the gains curve. In addition, these pikes become losses. The bellow graph shows you two pikes on the gain curve:
Basically, in the case of the trend continuation strategy, the level of profit securing should be greater than or equal to the stop loss level in terms of points. For example, if you placed a stop loss at 50 points, you should begin profit, securing at least 50 points of latent profits.
Personally, I prefer to add some points in addition to my stop loss level. Thus if I place a stop loss at 50 points, I will set the beginning of profit securing at 55 points of latent profits.
Time in the market
The time in the market is the duration of an open trade. And it should be reasonable. If the market duration exceeds a day, you must sub the overnight fees to your backtest performance.
It is imperative to follow the evolution of your strategy market duration. If the time in the market becomes increasingly longer, maybe it reveals your strategy is over-fitted. You should also carefully monitor time in the market while your strategy runs on your real account.
Standard deviation of time in the market
At the beginning of this post, I showed you how to measure the risks of a strategy, thanks to standard deviation. We can do the same with time in the market.
The standard deviation of the time in the market should not be too high and should also be regular over the duration of the strategy. Otherwise, that means some trades have a short time in the market and others a very long time. This could be indicative of the under-fitted problem of your strategy.
Here is an example of a strategy with too much standard deviation of its time in the market:
The time in the market shown by this bar graph is too irregular. We can assume that our strategy is certainly under-fitted. The performance of this strategy can be explained more by the market trend than by itself. Thus, this strategy will become a loser when the market trend reverses.
Time in the market increasing
The time variation in the market could reveal that a strategy is over-fitted or under-fitted. The trade duration should be stable from the beginning to the end of a backtest.
Here is an example of a time in the market increasing:
We can see that the time in the market increases at the end of the backtest. This strategy is increasing difficulties in reaching its target price. In this case, the strategy is either under-fitted or becoming obsolete.
If the trade duration increases during a trading range or a weakening trend, we can conclude that the strategy is under-fitted.
Otherwise, it may well be that the strategy is becoming obsolete; thus, market operators ignore the buy signal that gives.
Duration of latent loss
The duration of latent loss is when an opening position gives an unrealized loss. We frequently observe episodes of reflux after an entry into the market. In particular, with a swing trading or intra-day strategy, it is normal. However, one must be observant about the evolution of losses and profits.
The most important point is the variation of latent loss duration printed by your backtest. If the duration of latent loss increases, that would mean an over-fitted risk, or that may reveal your strategy becoming obsolete. You should also monitor and compare the evolution of latent loss duration between backtesting and real trading.
If you observe that your entry becomes systematically a latent loss immediately after their opening, then maybe other traders think it is a better idea to go in a reversal direction.
Here is an example of a winning entry but with latent loss duration overly important:
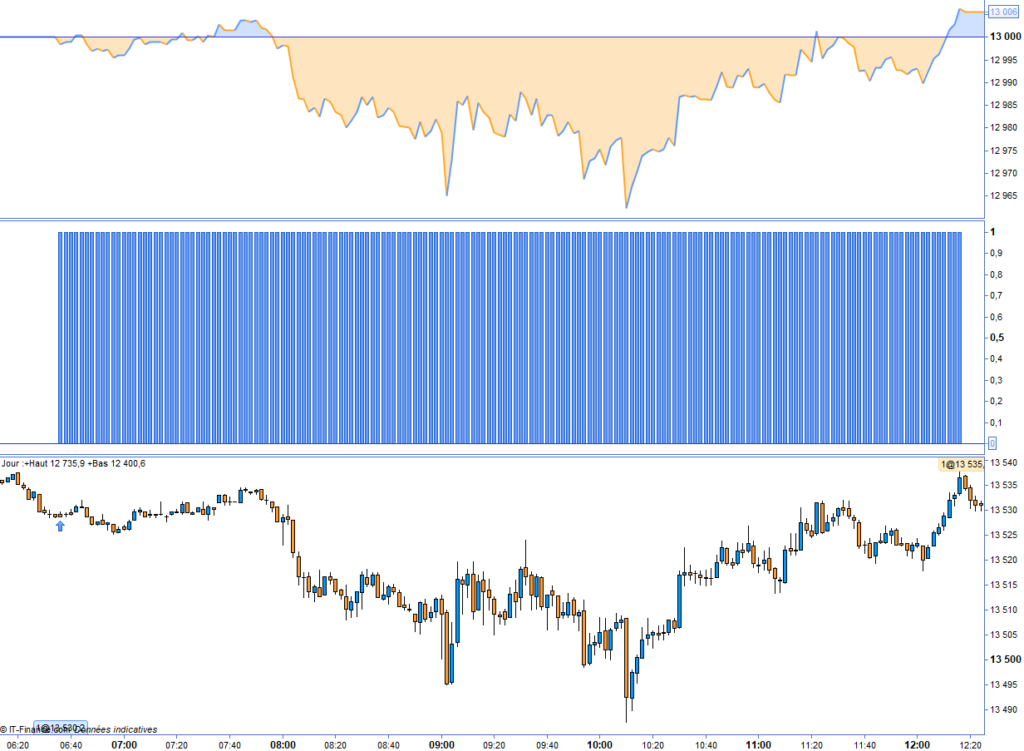
This position gave latent loss nearly over the duration of the trading session. It would have been impossible to cut this position without losses. This entry was finally winning but it was a bad trade.
Summary of robustness
- Your strategy should generate gains with few standard deviations. Your profits should be regular and correlated with the variation of the traded asset.
- The most important is not necessary for the performance of your strategy but rather the regularity of results. If your profits evolution is too erratic, there may be a risk of over-fitting or under-fitting.
Learning of each concept that I described in this post cost me something. Please be careful before launching an automated trading system on your real account. Take the time that you need to obtain sufficient robustness.
I hope you learn something from me and my experiences. If you have any questions, please ask me in a comment, and if this article pleased you, I would be grateful to see you share it.
Range Breakout Indicator for Prorealtime
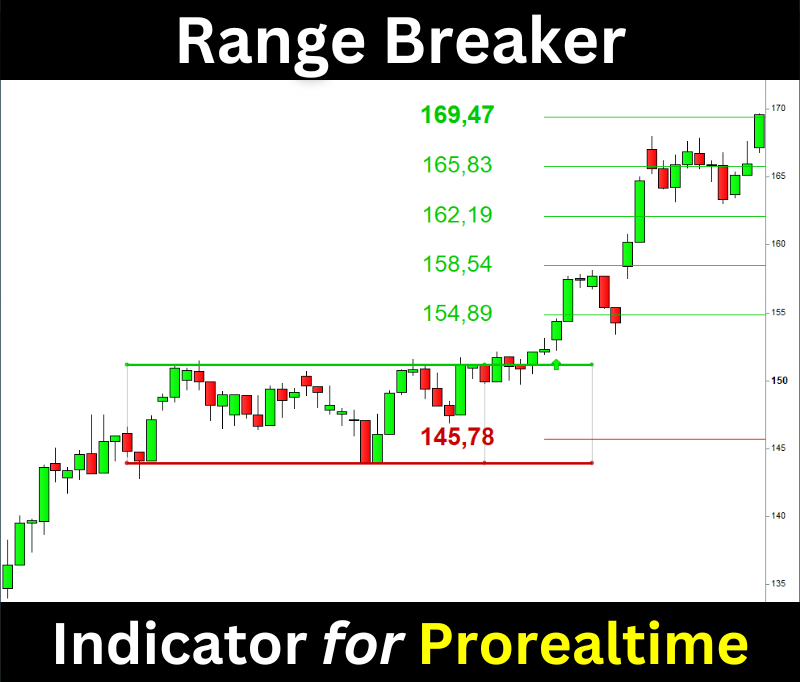
The Range Breaker will help you trade the Range Breakouts on Prorealtime. It displays the ranges, breakout signals, and target prices on your chart.