A complete guide to trading the range breakout
The opening range breakout is one of the most well-known trading strategies. This involves opening an entry after the price of an asset crosses a key level. A breakout is often followed by a significant price movement, giving considerable profit potential. In this post, I will show you how to exploit range breakouts to win on the market. I will provide you with an indicator, a trading system, and a screener working on the Prorealtime platform.
- What is a breakout?
- What are the best assets to trade range breakings?
- How to recognize a range using an indicator?
- Opening range breakout indicator
- Opening range breakout trading system
- Backtest of the opening range breakout strategy
- Risks of the opening range breakout strategy
- Opening range breakout screener
- Opening Range Breakout Summary
What is a breakout?
A breakout occurs when the price of an asset, such as a stock or an index, breaks a critical level. These key levels can be support or resistance. An increase in transaction volume often follows a breakout, which can indicate the beginning of a long-term trend or price acceleration.
Several factors, like economic news, a company publication, a political event, or a change in market sentiment, can trigger a breakout.
A breakout can be bullish or bearish. It is bullish when the price breaches the resistance, giving a long opportunity. It can be bearish when the price breaks the support, providing a short-sell signal opportunity.
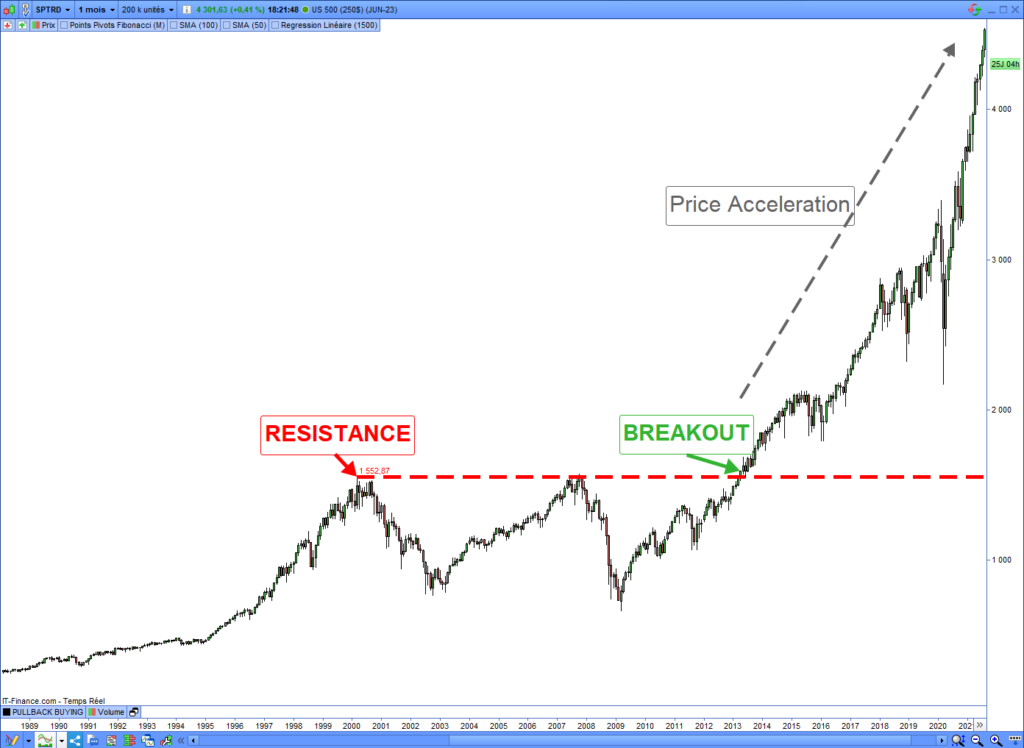
Bullish breakout example
Here is an example of a bullish breakout on the S&P 500. The uptrend accelerated after the resistance had been broken:
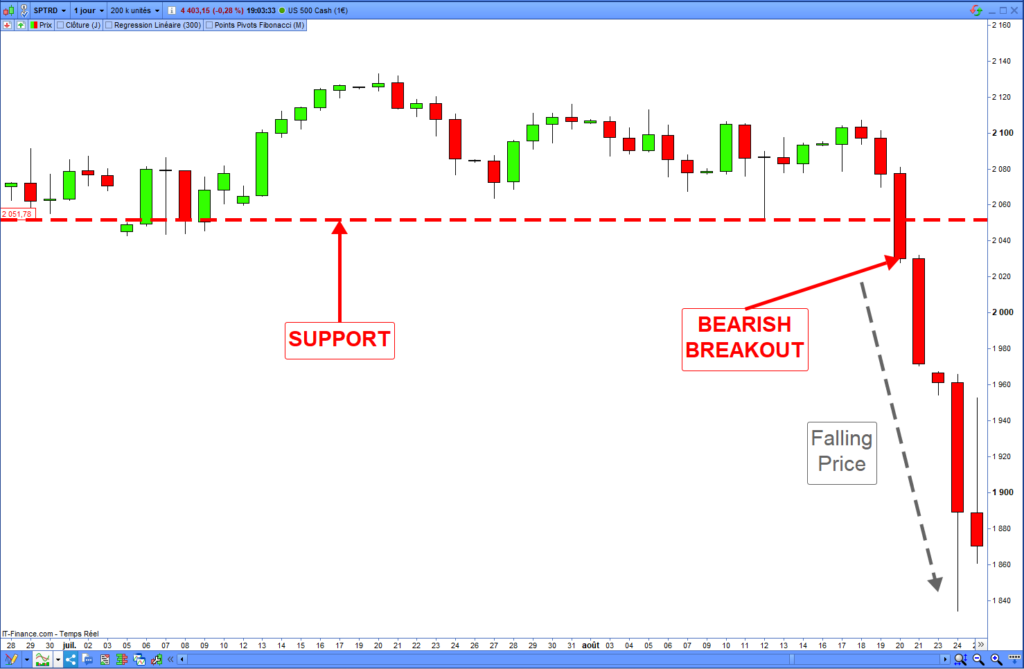
Bearish breakout example
Here is an example of a bearish breakout on the S&P 500. The downtrend accelerated after the price had broken down the support:
The different types of price levels
The breaking of numerous price levels can trigger a significant market movement. Here is the list of the main price level types that you can exploit in a breakout strategy:
- Supports and Resistances
- Uptrend and Downtrend lines
- Range supports and resistances
- Highest and lowest prices
- Pattern trend lines
- Chartist figure neckline
- Bollinger bands
- Volume profile point of control
Other key prices allow breakout trading. Globally, each price level, such as support or resistance, can be used in a breakout strategy. In this post, I will focus on range breakout. I will show you how to trade the range support or resistance breakouts. I may address trading of other key prices later.
What are the best assets to trade range breakings?
You can trade the breakouts on indexes, stocks, or any forex pair. However, trade breakouts on assets with some properties will be more profitable. Here are the two most important:
- The long-term trend must be evident. The long-term uptrend is necessary to buy the bullish breakouts, and the long-term downtrend is necessary to sell the bearish breakouts short.
- The breakout trading strategy is more profitable on volatile assets. The expected profits are higher, but the risk of losses is also higher.
How to recognize a range using an indicator?
It is easy to identify a range with the naked eye, but complex with an indicator. There is no perfect indicator that can detect a range. I will present you with an algorithm capable of recognizing most of the market’s ranges. The idea involves calculating the distance between the median price and the closing price of each candle within the range length. The distance will be low if the candles are regrouped around the median, which would indicate a range in this period.
We can consider three steps to solve this range recognition algorithm:
This range indicator will have two parameters: the length of the range and the distance from the median.
Range recognition algorithm
Here are the three range recognition steps. All source code I provide will work on the Prorealtime platform.
1. Median price calculation
The first step consists of calculating the median price over the period corresponding to the length of the range we want to recognize. You will begin by putting the closing prices in an Array. Then, you will have to sort the prices in ascending order. The value in the middle of the table will correspond to the median price.
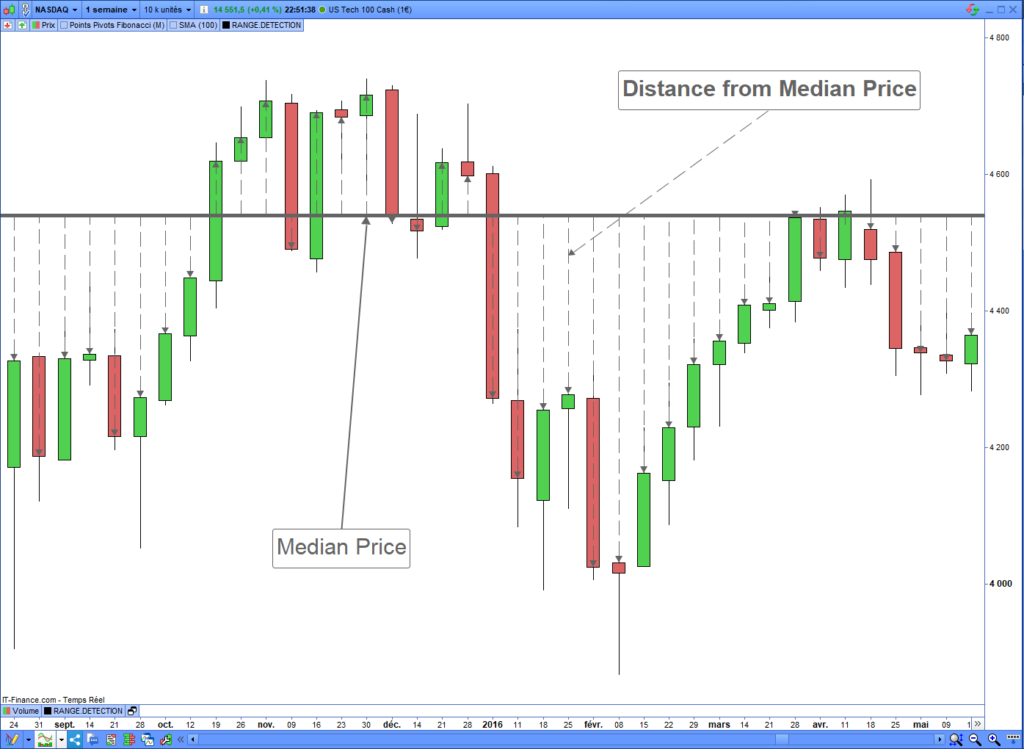
The following chart shows the candle dispersion around the median price along the range length:
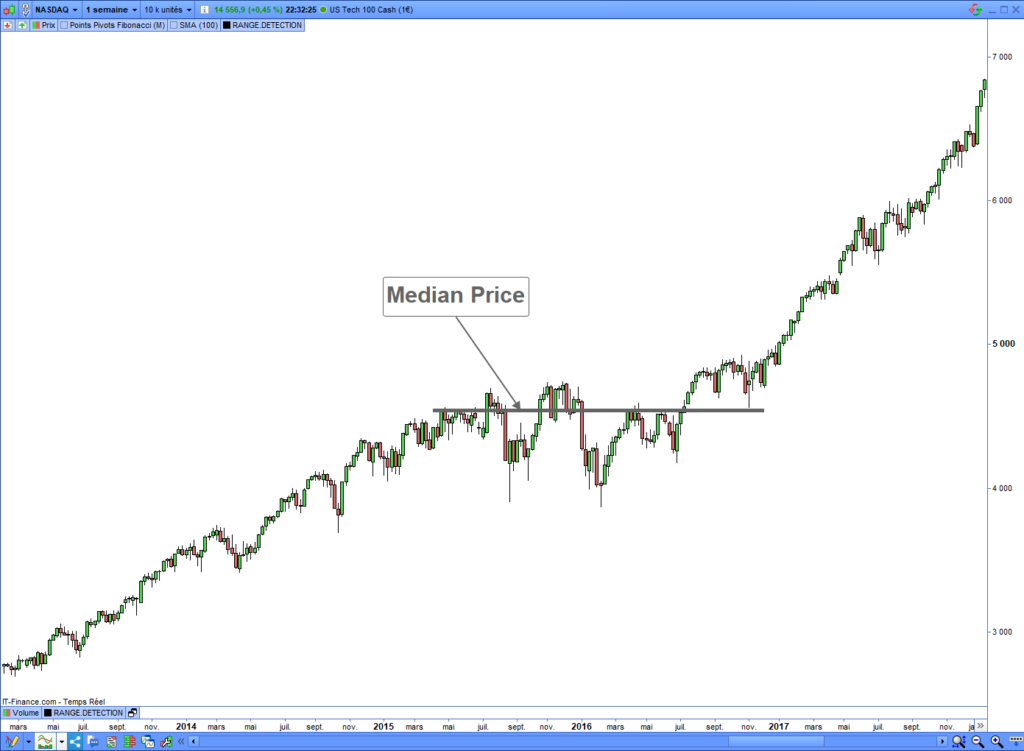
Median price indicator
The following code computes and prints the median price on the last 100 candles. You must create an indicator on the Prorealtime platform and copy/paste the code to run it:
defparam drawonlastbaronly=true
//------------------------------------------------------//
// * MEDIAN PRICE INDICATOR *                         * //
//------------------------------------------------------//

// Range length
rangeLength = 100

// MEDIANE CALCULATION
// 1.1 Put prices in the table
FOR i = 0 TO rangeLength - 1 DO
  $closeTab[i] = close[i]
NEXT

// 1.2 Ascending sort
Arraysort($closeTab, ascend)

// 1.3 Median price extraction
midValue = rangeLength / 2
roundedMidValue = FLOOR(rangeLength / 2)

IF midValue = roundedMidValue THEN
  // even number
  Mediane = ($closeTab[roundedMidValue] + $closeTab[roundedMidValue + 1]) / 2
ELSE
  // odd number
  Mediane = $closeTab[midValue]
ENDIF

// Median price printing
DRAWSEGMENT(barindex-rangeLength, Mediane, barindex, Mediane) coloured(0,0,0)

RETURN
2. Distance calculation
The second step is calculating the average distance between the median price and the closing price of each candle. When the market ranges, the candles are regrouped in a lateral channel. The more the candles are regrouped around the median, the lower the average distance. A low distance will indicate a range occurring.
The following chart shows the distances between the median price and the closing prices of each candle:
Distance from median indicator
The following code will calculate the average distance between the closing prices and the median price along the length of the range we want to recognize:
defparam drawonlastbaronly=true
//------------------------------------------------------//
// * DISTANCE FROM MEDIAN PRICE INDICATOR *           * //
//------------------------------------------------------//

// Range length
rangeLength = 100

// MEDIANE CALCULATION
// 1.1 Put prices in the table
FOR i = 0 TO rangeLength - 1 DO
  $closeTab[i] = close[i]
NEXT

// 1.2 Ascending sort
Arraysort($closeTab, ascend)

// 1.3 Median price extraction
midValue = rangeLength / 2
roundedMidValue = FLOOR(rangeLength / 2)

IF midValue = roundedMidValue THEN
  // even number
  Mediane = ($closeTab[roundedMidValue] + $closeTab[roundedMidValue + 1]) / 2
ELSE
  // odd number
  Mediane = $closeTab[midValue]
ENDIF


// * DISTANCE CALCULATION * //
distanceSquare = 0
FOR i = 0 to rangeLength - 1 DO
  distanceSquare = distanceSquare + SQUARE(close[i] - Mediane)
  i=i+1
NEXT

distance = SQRT(distanceSquare / rangeLength) / close

RETURN distance
Distance from the median example
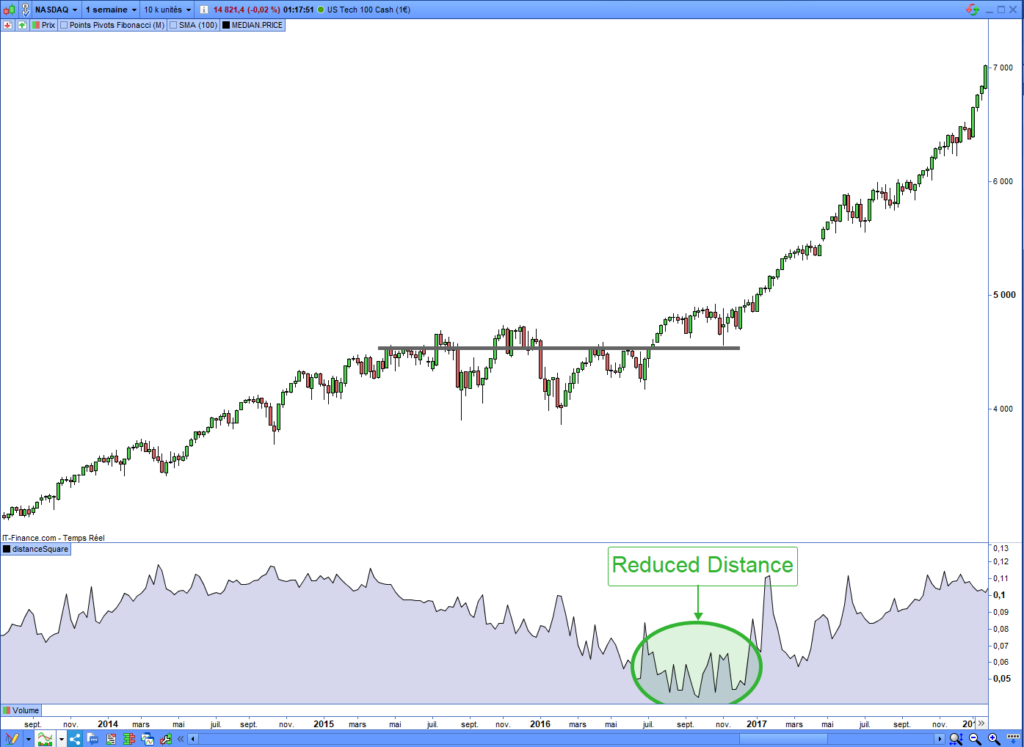
Here is an example of the distance calculation between the median and the closing price on the Nasdaq in the weekly timeframe. You can see the distance reducing when the last 100 candles have shaped a range:
3. The distance filter
The last step involves filtering the market part with a low distance from the median price. A low distance will indicate a range occurring. You need to define a threshold below which you consider the candles to be shaped as a range. I defined a threshold of 0.05 in the following code:
ONCE threshold = 0.05

RANGEDETECTED = 0
IF distance <= threshold THEN
  RANGEDETECTED = 1
ELSE
  RANGEDETECTED = 0
ENDIF

// Signal smoothing
SMOOTHEDRANGE = average[5](RANGEDETECTED)

SMOOTHEDRANGEDETECTED = 0
IF SMOOTHEDRANGE > 0 THEN
  SMOOTHEDRANGEDETECTED = 1
ELSE
  SMOOTHEDRANGEDETECTED = 0
ENDIF
In the previous code, I smoothed the range detection signal by averaging over five periods. That enhanced the quality of the signal, reducing false signals.
Code of the range indicator
The following source code identifies market ranges. You can run it on the Prorealtime platform. I set 100 as the range length and 0.05 as the detection threshold. You will adjust the length and threshold according to your needs. This configuration works well on indexes and ETFs in daily and weekly timeframes:
//------------------------------------------------------//
// * RANGE DETECTION PROREALTIME INDICATOR *          * //
//------------------------------------------------------//
// Vivien Schmitt
// https://artificall.com
//------------------------------------------------------//

//------------------------------------------------------//
// * PARAMETERS
//------------------------------------------------------//
ONCE rangeLength = 100
ONCE threshold = 0.05 //0.02


//------------------------------------------------------//
// * MEDIANE CALCULATION
//------------------------------------------------------//
// 1.1 Put prices in the table
FOR i = 0 TO rangeLength - 1 DO
  $closeTab[i] = close[i]
NEXT

// 1.2 Ascending sort
Arraysort($closeTab, ascend)

// 1.3 Median price extraction
midValue = rangeLength / 2
roundedMidValue = FLOOR(rangeLength / 2)

IF midValue = roundedMidValue THEN
  // even number
  Mediane = ($closeTab[roundedMidValue] + $closeTab[roundedMidValue + 1]) / 2
ELSE
  // odd number
  Mediane = $closeTab[midValue]
ENDIF

//------------------------------------------------------//
// * DISTANCE CALCULATION
//------------------------------------------------------//
distanceSquare = 0
FOR i = 0 to rangeLength - 1 DO
  distanceSquare = distanceSquare + SQUARE(close[i] - Mediane)
  i=i+1
NEXT

standardDeviation = STD[rangeLength]
distance = SQRT(distanceSquare / rangeLength) / close

//------------------------------------------------------//
// * RANGE DETECTION
//------------------------------------------------------//
RANGEDETECTED = 0
IF distance <= threshold THEN
  RANGEDETECTED = 1
ELSE
  RANGEDETECTED = 0
ENDIF

// Signal smoothing
SMOOTHEDRANGE = average[5](RANGEDETECTED)

SMOOTHEDRANGEDETECTED = 0
IF SMOOTHEDRANGE > 0 THEN
  SMOOTHEDRANGEDETECTED = 1
ELSE
  SMOOTHEDRANGEDETECTED = 0
ENDIF


RETURN SMOOTHEDRANGEDETECTED
Range detection example
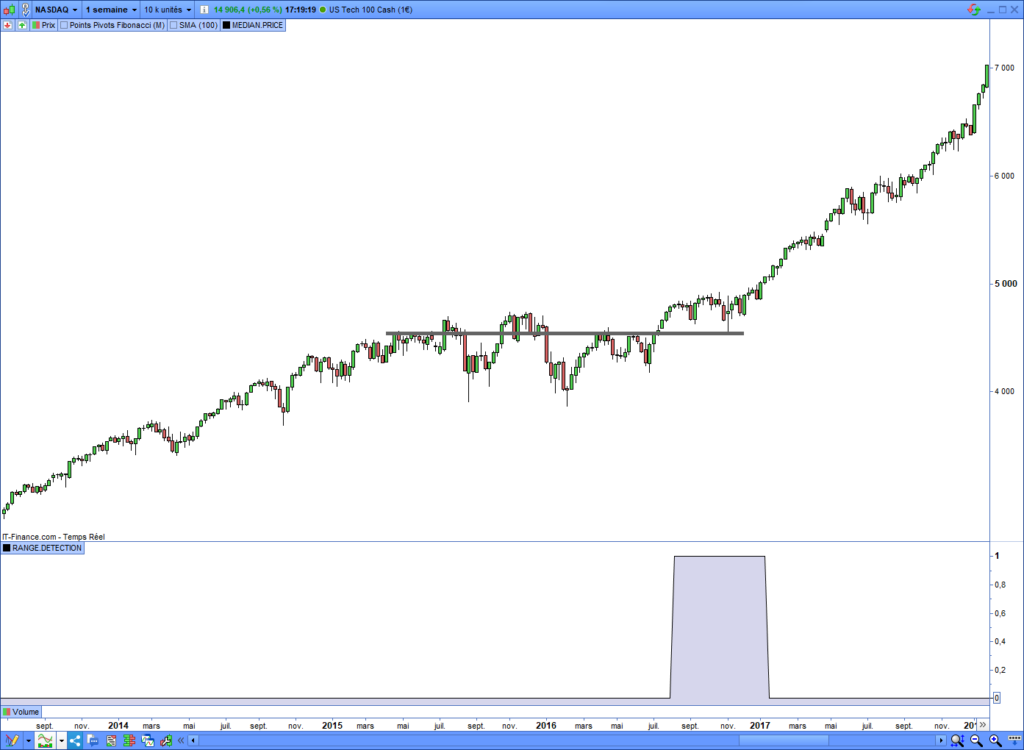
The following chart shows an example of range detection in the Nasdaq in weekly time units. The range indicator returns 1 when the algorithm detects a range on the last 100 candles:
Opening range breakout indicator
The breakout occurs when the price overhead closes above the highest point or below the lowest point of the range. The market may initiate a sustained price movement following this event. The breakouts provide a buy or sell short signal.
The following chart shows the highest and the lowest of the range:
Highest and lowest breakouts
Detecting a breakout requires knowing the range’s highest and lowest. Then, you will identify the signal after the price overhead closes at its highest or closes below its lowest. The following source code will send 1 in case of a bullish breakout and -1 in case of a bearish breakout:
//------------------------------------------------------//
// * BREAKOUT SIGNAL
//------------------------------------------------------//

// Highest and lowest price
highestPrice = highest[rangeLength](high)
lowestPrice = lowest[rangeLength](low)

BREAKOUT = 0
IF close > highestPrice[1] THEN
  BREAKOUT = 1
ELSIF close < lowestPrice[1] THEN
  BREAKOUT = -1
ENDIF

RETURN BREAKOUT
Now, you must join the breakout with the range detection signal.
Code of the opening range breakout indicator
Here is the indicator’s source code, allowing the detection of bullish and bearish range breakouts. This indicator works on the Prorealtime platform:
//------------------------------------------------------//
// * OPENING RANGE BREAKOUT SIGNAL *                  * //
//------------------------------------------------------//
// Vivien Schmitt
// https://artificall.com
//------------------------------------------------------//

//------------------------------------------------------//
// * PARAMETERS
//------------------------------------------------------//
ONCE rangeLength = 100
ONCE threshold = 0.05 //0.02

//------------------------------------------------------//
// * MEDIANE CALCULATION
//------------------------------------------------------//
// 1.1 Put prices in the table
FOR i = 0 TO rangeLength - 1 DO
  $closeTab[i] = close[i]
NEXT

// 1.2 Ascending sort
Arraysort($closeTab, ascend)

// 1.3 Median price extraction
midValue = rangeLength / 2
roundedMidValue = FLOOR(rangeLength / 2)

IF midValue = roundedMidValue THEN
  // even number
  Mediane = ($closeTab[roundedMidValue] + $closeTab[roundedMidValue + 1]) / 2
ELSE
  // odd number
  Mediane = $closeTab[midValue]
ENDIF

//------------------------------------------------------//
// * DISTANCE CALCULATION
//------------------------------------------------------//
// 2 Calculate distance from the median
distanceSquare = 0
FOR i = 0 to rangeLength - 1 DO
  distanceSquare = distanceSquare + SQUARE(close[i] - Mediane)
  i=i+1
NEXT

distance = SQRT(distanceSquare / rangeLength) / close

//------------------------------------------------------//
// * RANGE DETECTION
//------------------------------------------------------//
// 3.1 Detecting of the low distance
RANGEDETECTED = 0
IF distance <= threshold THEN
  RANGEDETECTED = 1
ELSE
  RANGEDETECTED = 0
ENDIF

// 3.2 Signal smoothing
SMOOTHEDRANGE = average[5](RANGEDETECTED)

SMOOTHEDRANGEDETECTED = 0
IF SMOOTHEDRANGE > 0 THEN
  SMOOTHEDRANGEDETECTED = 1
ELSE
  SMOOTHEDRANGEDETECTED = 0
ENDIF

//------------------------------------------------------//
// * RANGE BREAKOUT
//------------------------------------------------------//
// 4.1 Highest and lowest price
highestPrice = highest[rangeLength](high)
lowestPrice = lowest[rangeLength](low)

// 4.2 Detect if the price breaks support or resistance
BREAKOUT = 0
IF close > highestPrice[1] THEN
  BREAKOUT = 1
ELSIF close < lowestPrice[1] THEN
  BREAKOUT = -1
ENDIF

//------------------------------------------------------//
// * OPENING RANGE BREAKOUT SIGNAL
//------------------------------------------------------//
// 5 Range detection and breakout signal merging
RANGEBREAKOUT = 0
IF SMOOTHEDRANGEDETECTED = 1 AND BREAKOUT = 1 THEN
  RANGEBREAKOUT = 1
ELSIF SMOOTHEDRANGEDETECTED = 1 AND BREAKOUT = -1 THEN
  RANGEBREAKOUT = -1
ENDIF


RETURN RANGEBREAKOUT
Example of a range breakout detection
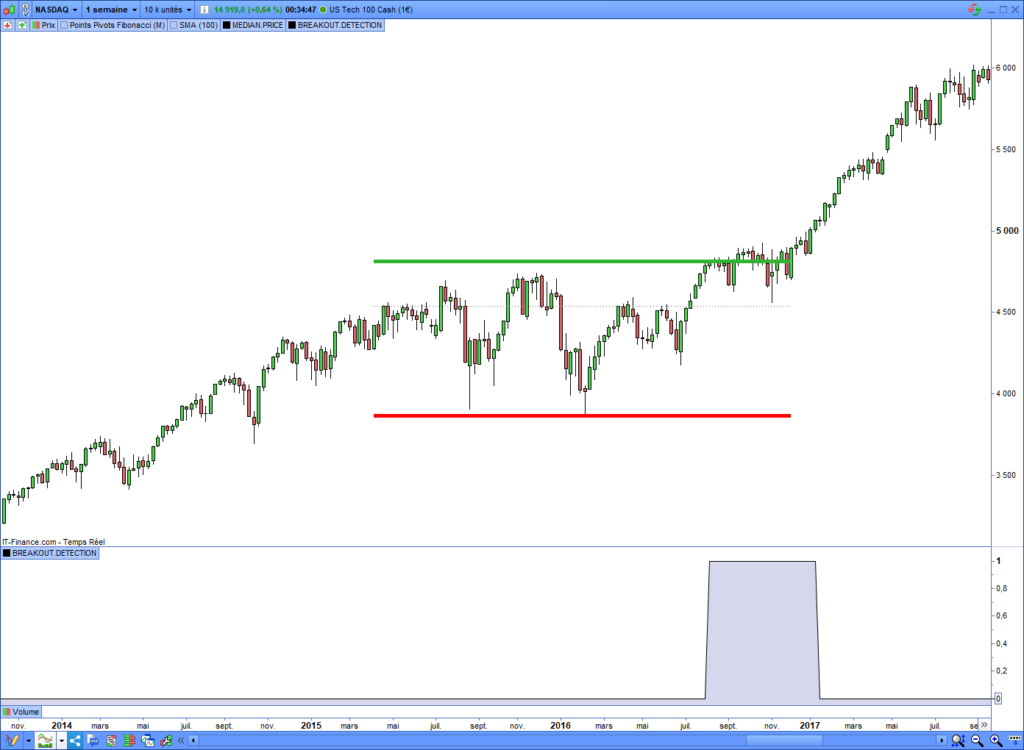
Here is an example of a bullish range breakout signal that occurred on the Nasdaq in a weekly timeframe:
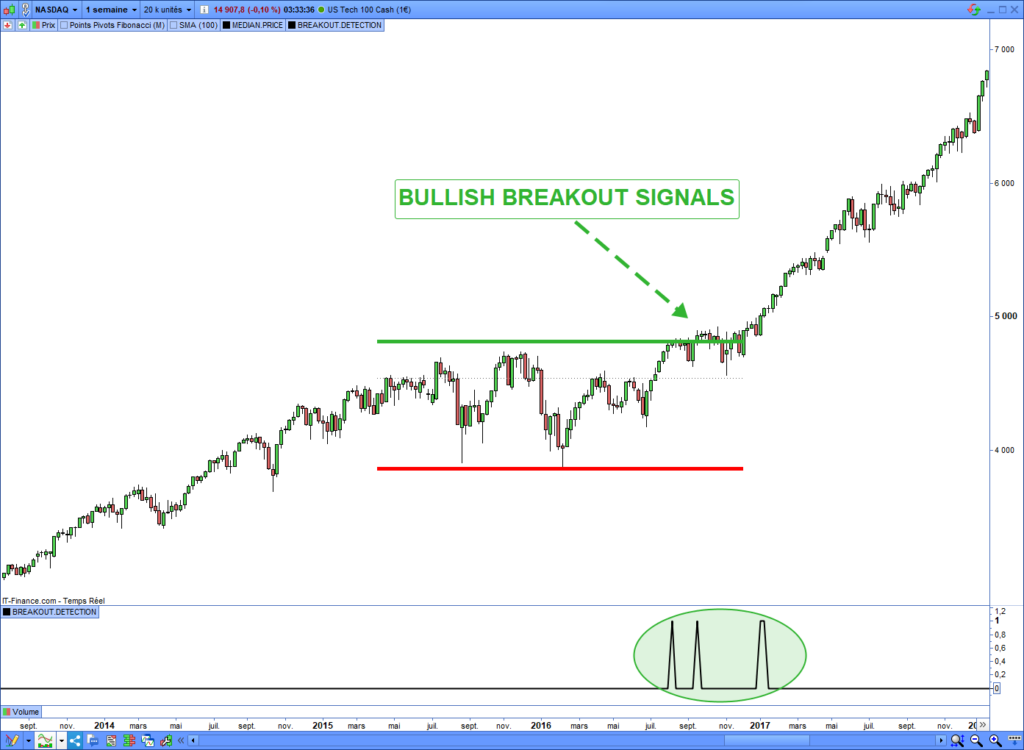
Opening range breakout trading system
You can use the indicator code I presented to trade the range breakouts automatically on the Prorealtime platform. You only have to open a long entry after a bullish breakout and a short entry after a bearish breakout.
Code of the opening range breakout trading system
Here is the source code of the range breakout automated strategy. This trading system will open long entries after bullish breakouts and short entries after bearish breakouts:
//------------------------------------------------------//
// * OPENING RANGE BREAKOUT TRADING SYSTEM *          * //
//------------------------------------------------------//
// Vivien Schmitt
// https://artificall.com
//------------------------------------------------------//

//------------------------------------------------------//
// * PARAMETERS
//------------------------------------------------------//
ONCE rangeLength = 100
ONCE threshold = 0.05 //0.02

//------------------------------------------------------//
// * MEDIANE CALCULATION
//------------------------------------------------------//
// 1.1 Put prices in the table
FOR i = 0 TO rangeLength - 1 DO
  $closeTab[i] = close[i]
NEXT

// 1.2 Ascending sort
Arraysort($closeTab, ascend)

// 1.3 Median price extraction
midValue = rangeLength / 2
roundedMidValue = FLOOR(rangeLength / 2)

IF midValue = roundedMidValue THEN
  // even number
  Mediane = ($closeTab[roundedMidValue] + $closeTab[roundedMidValue + 1]) / 2
ELSE
  // odd number
  Mediane = $closeTab[midValue]
ENDIF

//------------------------------------------------------//
// * DISTANCE CALCULATION
//------------------------------------------------------//
// 2 Calculate distance from the median
distanceSquare = 0
FOR i = 0 to rangeLength - 1 DO
  distanceSquare = distanceSquare + SQUARE(close[i] - Mediane)
  i=i+1
NEXT

distance = SQRT(distanceSquare / rangeLength) / close

//------------------------------------------------------//
// * RANGE DETECTION
//------------------------------------------------------//
// 3.1 Detecting of the low distance
RANGEDETECTED = 0
IF distance <= threshold THEN
  RANGEDETECTED = 1
ELSE
  RANGEDETECTED = 0
ENDIF

// 3.2 Signal smoothing
SMOOTHEDRANGE = average[5](RANGEDETECTED)

SMOOTHEDRANGEDETECTED = 0
IF SMOOTHEDRANGE > 0 THEN
  SMOOTHEDRANGEDETECTED = 1
ELSE
  SMOOTHEDRANGEDETECTED = 0
ENDIF

//------------------------------------------------------//
// * RANGE BREAKOUT
//------------------------------------------------------//
// 4.1 Highest and lowest price
highestPrice = highest[rangeLength](high)
lowestPrice = lowest[rangeLength](low)

// 4.2 Detect if the price breaks support or resistance
BREAKOUT = 0
IF close > highestPrice[1] THEN
  BREAKOUT = 1
ELSIF close < lowestPrice[1] THEN
  BREAKOUT = -1
ENDIF

//------------------------------------------------------//
// * OPENING RANGE BREAKOUT SIGNAL
//------------------------------------------------------//
// 5 Range detection and breakout signal merging
RANGEBREAKOUT = 0
IF SMOOTHEDRANGEDETECTED = 1 AND BREAKOUT = 1 THEN
  RANGEBREAKOUT = 1
ELSIF SMOOTHEDRANGEDETECTED = 1 AND BREAKOUT = -1 THEN
  RANGEBREAKOUT = -1
ENDIF


//------------------------------------------------------//
// * ENTRY OPENNING & CLOSING *                       * //
//------------------------------------------------------//

// Strategy
LongBreakout = 1
ShortBreakout = 1

// Position size
capitalByEntry = 10000
numberOfContracts = max(1, floor(capitalByEntry / close))

// Stoploss & Targer
longStopLoss = 10
longTarget = longStopLoss * 3

shortStopLoss = 5
shortTarget = shortStopLoss * 3

// Conditions pour ouvrir une position acheteuse
IF NOT LongOnMarket AND LongBreakout AND RANGEBREAKOUT = 1 THEN
  BUY numberOfContracts CONTRACTS AT MARKET
  SET STOP %LOSS longStopLoss
  SET TARGET %PROFIT longTarget
ENDIF


// Conditions pour ouvrir une position en vente à découvert
IF NOT ShortOnMarket AND ShortBreakout AND RANGEBREAKOUT = -1 THEN
  SELLSHORT numberOfContracts CONTRACTS AT MARKET
  SET STOP %LOSS shortStopLoss
  SET TARGET %PROFIT shortTarget
ENDIF
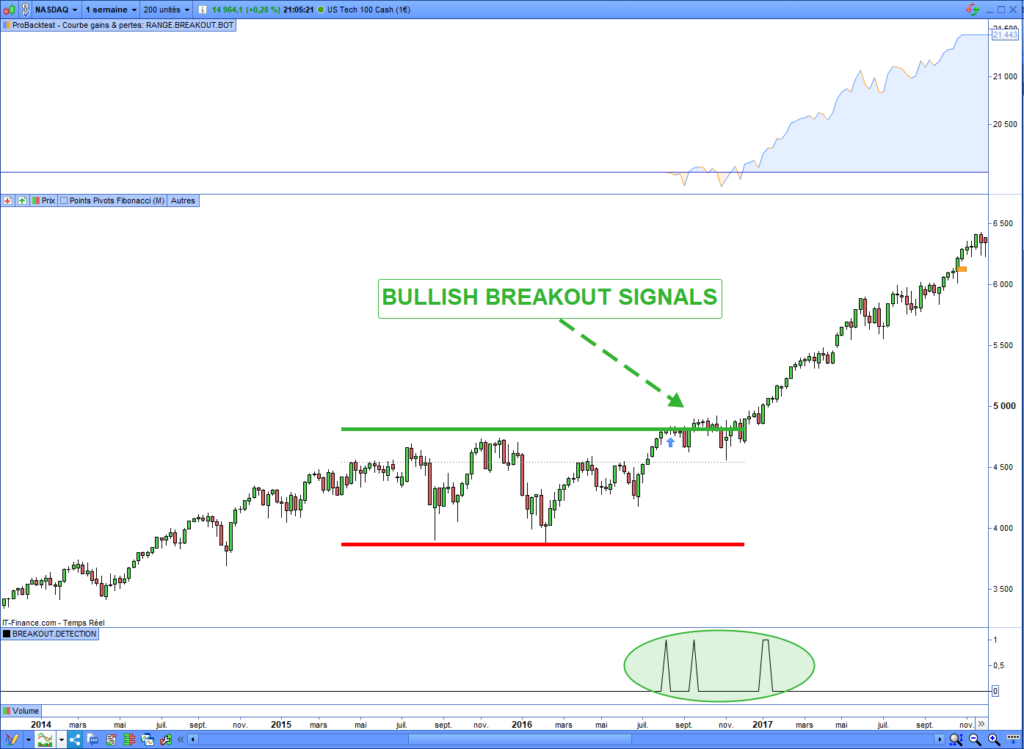
Example of an opening range breakout entry
The following chart shows the automated entry opening after the bullish breakout of the highest range resistance:
Backtest of the opening range breakout strategy
I will backtest the range breakout automated strategy with several assets on the Prorealtime platform. I will run the trading system on the Nasdaq, DAX 40, and EUR/USD forex pair.
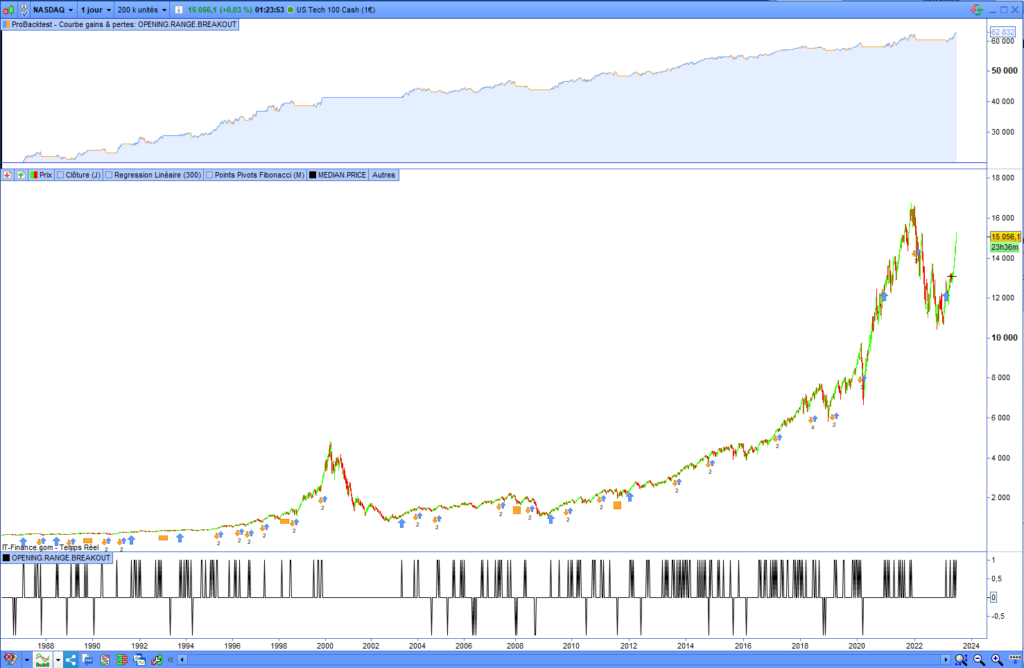
Backtest of the range breakout bot on the Nasdaq
Here is the backtest of the range breakout strategy on the Nasdaq in the daily timeframe. Regarding the bullish bias of the Nasdaq, I activated only the bullish breakout signals. The trading system will only open long entries:
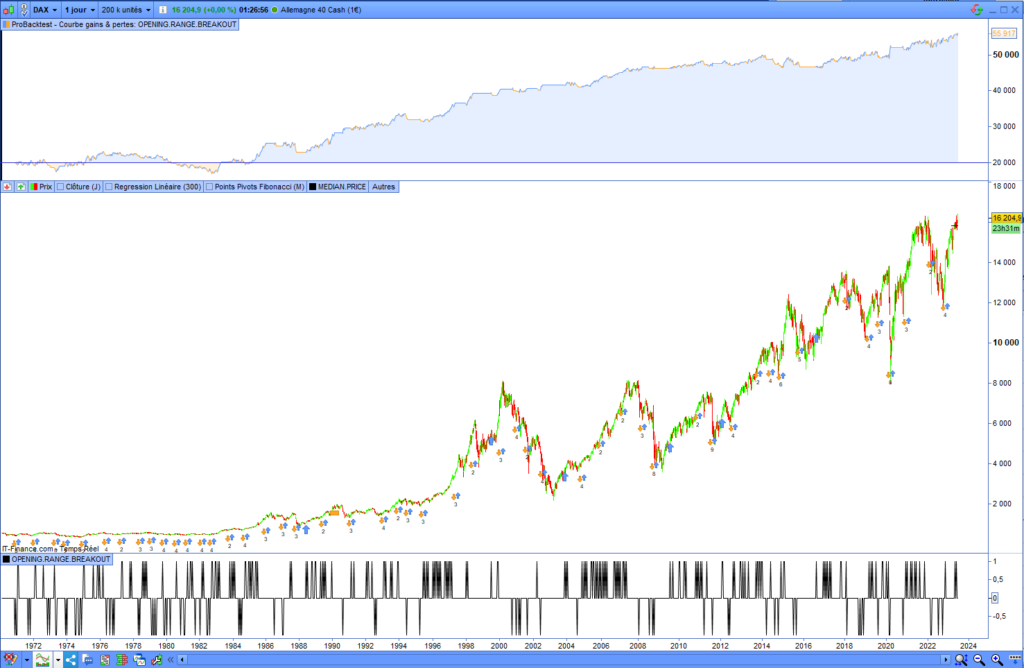
Backtest of the range breakout bot on the DAX 40
Here is the backtest of the range breakout strategy on the DAX40 in the daily timeframe. This time, I activated both bullish and bearish breakout signals. The trading system will open long and short entries:
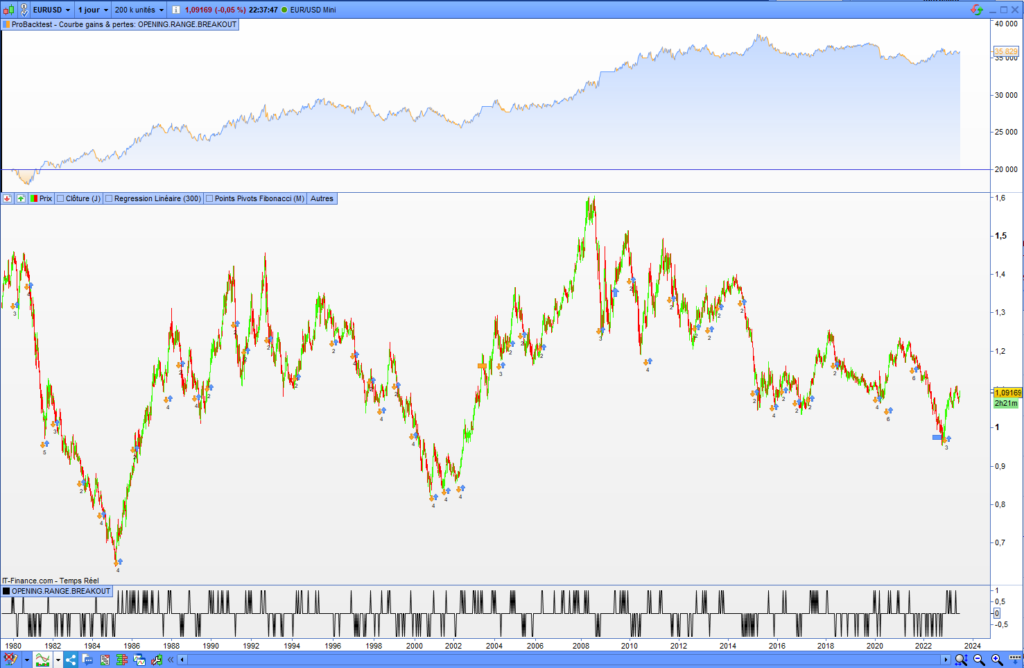
Backtest of the range breakout bot on the EUR/USD
Here is the backtest of the range breakout strategy on the USD/EUR forex pair in the daily timeframe. The trading system will open long and short entries. I defined only one contract by entry opening:
Risks of the opening range breakout strategy
Like most trading strategies, range breakout trading contains risks. The particularity of this strategy is that you will open entries in a highly volatile market. This increases the number of false signals that occur and prevents loss executions.
In a volatile market, it is crucial to manage your risk exposure effectively. To reduce potential losses, you should not open leveraged entries. Additionally, avoid placing the stop loss too close to the entry price. This will reduce the risk of the stop-loss execution.
Opening range breakout screener
The Prorealtime platform gives the possibility to program screeners. You can use the source code of the range breakout indicator to build a screener and find opening range breakout opportunities on stocks and ETFs.
Code of the opening range breakout screener
Here is the source code of the range breakout screener runnable on the Prorealtime platform:
//------------------------------------------------------//
// * OPENING RANGE BREAKOUT SCREENER * * //
//------------------------------------------------------//
// Vivien Schmitt
// https://artificall.com
//------------------------------------------------------//
//------------------------------------------------------//
// * PARAMETERS
//------------------------------------------------------//
ONCE rangeLength = 100
ONCE threshold = 0.05 //0.02
//------------------------------------------------------//
// * MEDIANE CALCULATION
//------------------------------------------------------//
// 1.1 Put prices in the table
FOR i = 0 TO rangeLength - 1 DO
$closeTab[i] = close[i]
NEXT
// 1.2 Ascending sort
Arraysort($closeTab, ascend)
// 1.3 Median price extraction
midValue = rangeLength / 2
roundedMidValue = FLOOR(rangeLength / 2)
IF midValue = roundedMidValue THEN
// even number
Mediane = ($closeTab[roundedMidValue] + $closeTab[roundedMidValue + 1]) / 2
ELSE
// odd number
Mediane = $closeTab[midValue]
ENDIF
//------------------------------------------------------//
// * DISTANCE CALCULATION
//------------------------------------------------------//
// 2 Calculate distance from the median
distanceSquare = 0
FOR i = 0 to rangeLength - 1 DO
distanceSquare = distanceSquare + SQUARE(close[i] - Mediane)
i=i+1
NEXT
distance = SQRT(distanceSquare / rangeLength) / close
//------------------------------------------------------//
// * RANGE DETECTION
//------------------------------------------------------//
// 3.1 Detecting of the low distance
RANGEDETECTED = 0
IF distance <= threshold THEN
RANGEDETECTED = 1
ELSE
RANGEDETECTED = 0
ENDIF
// 3.2 Signal smoothing
SMOOTHEDRANGE = average[5](RANGEDETECTED)
SMOOTHEDRANGEDETECTED = 0
IF SMOOTHEDRANGE > 0 THEN
SMOOTHEDRANGEDETECTED = 1
ELSE
SMOOTHEDRANGEDETECTED = 0
ENDIF
//------------------------------------------------------//
// * RANGE BREAKOUT
//------------------------------------------------------//
// 4.1 Highest and lowest price
highestPrice = highest[rangeLength](high)
lowestPrice = lowest[rangeLength](low)
// 4.2 Detect if the price breaks support or resistance
BREAKOUT = 0
IF close > highestPrice[1] THEN
BREAKOUT = 1
ELSIF close < lowestPrice[1] THEN
BREAKOUT = -1
ENDIF
//------------------------------------------------------//
// * OPENING RANGE BREAKOUT SIGNAL
//------------------------------------------------------//
// 5 Range detection and breakout signal merging
RANGEBREAKOUT = 0
IF SMOOTHEDRANGEDETECTED = 1 AND BREAKOUT = 1 THEN
RANGEBREAKOUT = 1
ELSIF SMOOTHEDRANGEDETECTED = 1 AND BREAKOUT = -1 THEN
RANGEBREAKOUT = 1
ENDIF
//------------------------------------------------------//
// *** SCREENER ***//
//------------------------------------------------------//
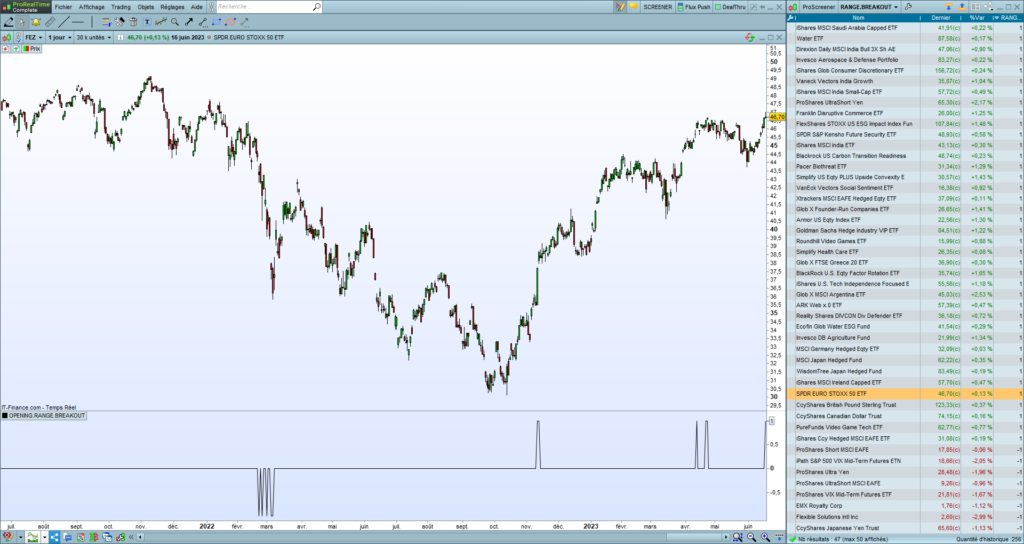
SCREENER [RANGEBREAKOUT](BREAKOUT as "RANGE BREAKOUT")Range breakout screener example
Here is the result of the opening range breakout screener run on the Prorealtime platform. The screener will return 1 for the bullish breakouts and -1 for the bearish breakouts:
Opening Range Breakout Summary
A breakout occurs when the market breaks a key price level.
A significant price movement often follows it in the breaking direction.
You can trade the breakout on any asset, such as stocks, ETFs, Futures, or CFD contracts.
The opening range breakout strategy is effective in all timeframes.
It is more profitable to take swing trading signals and hold the position for several days or weeks.
Breakout trading is a risky strategy due to the high volatility that occurs after the signal is triggered.
Range Breakout Indicator for Prorealtime
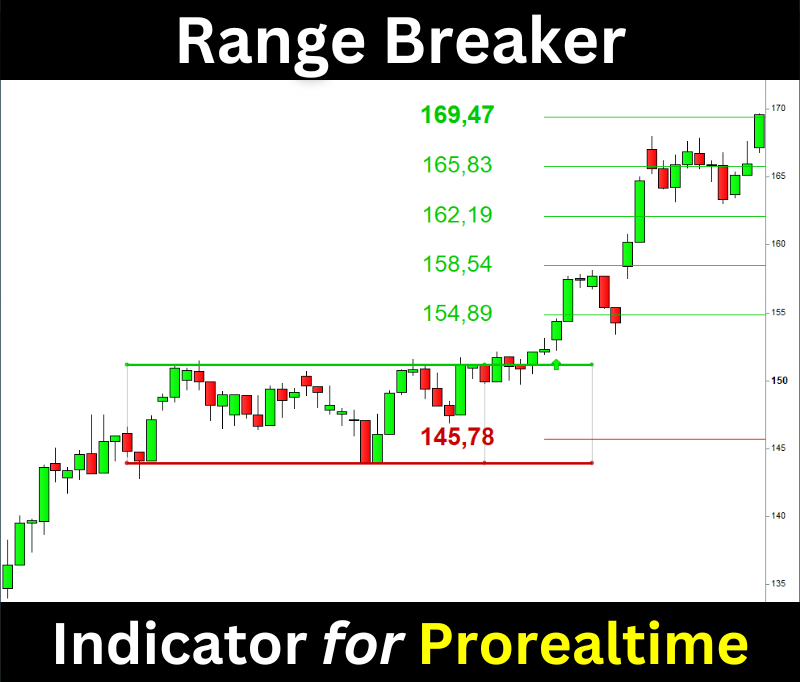
The Range Breaker will help you trade the Range Breakouts on Prorealtime. It displays the ranges, breakout signals, and target prices on your chart.