Measuring price acceleration can help you detect the beginning of a large price movement. You could open an entry at the best time and take a substantial gain. In this post, I will show you how to evaluate the market’s acceleration and give you the source code of an acceleration indicator for the Prorealtime platform.
How to measure the acceleration?
Measuring market acceleration takes two steps. First, you evaluate the market direction, and second, you see if this direction is growing. Several ways allow for price acceleration evaluation. I will present some of them to you.
Linear regression slopes
The simplest way to evaluate the price acceleration is to compare the linear regression slope at a time with the linear regression slope at N-1 time. The interpretation of the result is very simple:
- If both slopes are positive and the subtraction is positive, then there is a positive acceleration.
- If both slopes are negative and the subtraction is negative, then there is a negative acceleration.
Price direction measuring
It’s very easy to measure price direction thanks to the linear regression slope on a period. The “LinearRegressionSlope” instruction on Prorealtime allows you to obtain this slope:
regSlop = LinearRegressionSlope[20](close)
The previous example’s linear regression slope is computed on price for 20 periods.
Price acceleration measuring
You can now easily measure price acceleration thanks to the difference between the slope variable’s actual value and her previous value. The result of this calculation is a kind of the second derivative. You can consider that as a “variation of variation” of price.
acceleration = regSlop[0] - regSlop[1]
If the acceleration variable is greater than zero, that would mean two things :
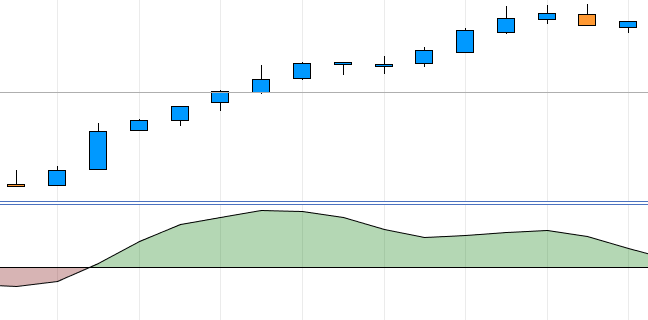
- Price increases more and more strongly. There is a bullish acceleration
- Price decreases less and less strongly. It is the end of the bearish trend
If the acceleration variable is less than zero, that would mean two things :
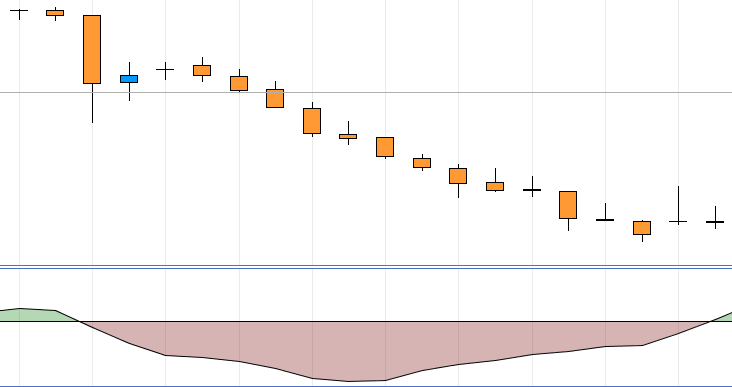
- Price decreases more and more strongly. There is a bearish acceleration
- Price increases less and less strongly. It is the end of the bullish trend
Price acceleration indicator
Here is the acceleration measuring indicator that I use :
regSlop = LinearRegressionSlope[20](close)
acceleration = (regSlop[0] - regSlop[1]) * 1000000
averageAcceleration = Average[3](acceleration)
ZERO = 0
RETURN averageAcceleration AS "Acceleration", ZERO AS "0"
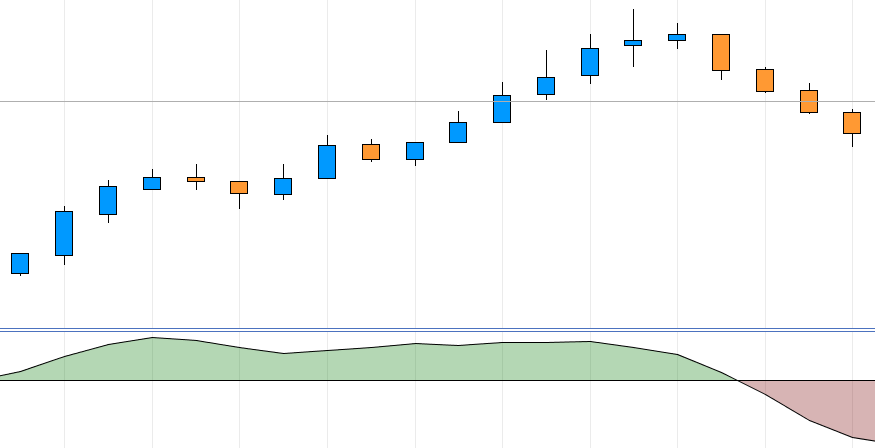
Bullish acceleration example
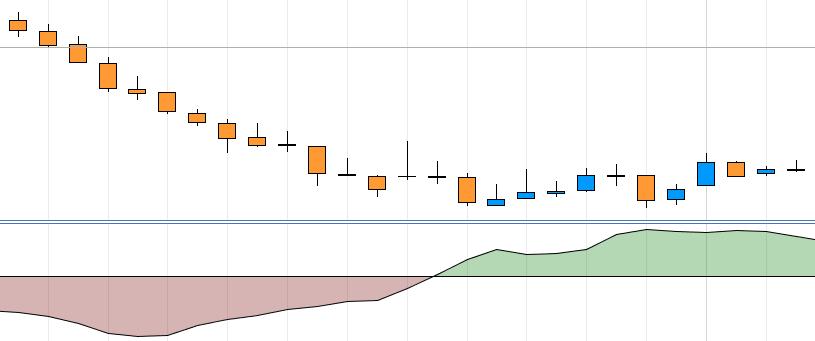
Bearish acceleration example
End of the trend detection
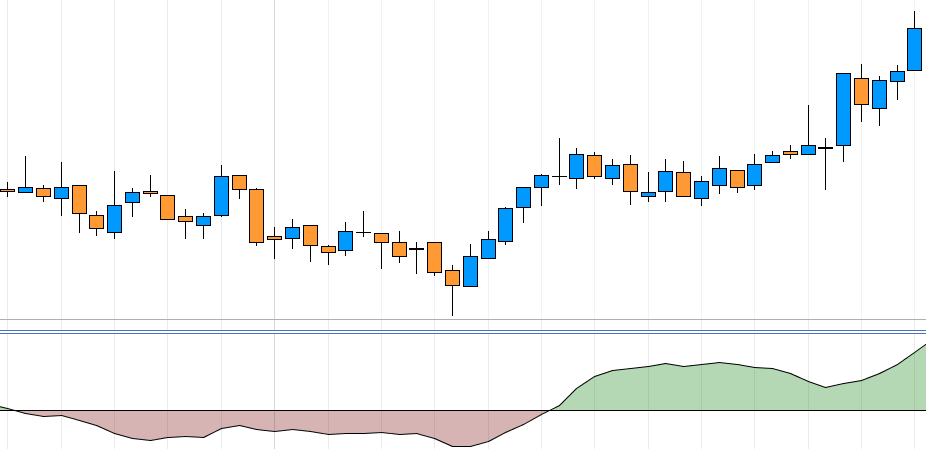
You can detect the end of the trend using the previous indicator. When the acceleration indicator crosses zero, there are two possible interpretations:
- If the acceleration indicator crosses over zero, the bearish trend ends.
- If the acceleration indicator crosses under zero, the bullish trend ends.
End of bullish trend example
End of bearish trend example
Acceleration oscillator
You can measure the price acceleration with the Awesome Oscillator (AO) and a Simple Moving Average (SMA). You can calculate the acceleration oscillator by subtracting a 5-period SMA of the AO from the AO.
Accelerator Oscillator Formula
AO - SMA5(AO)Accelerator Oscillator source code
AwesomeOscillator = average[5](medianprice)-average[34](medianprice)
Acceleration = AwesomeOscillator - Average[5](AwesomeOscillator)
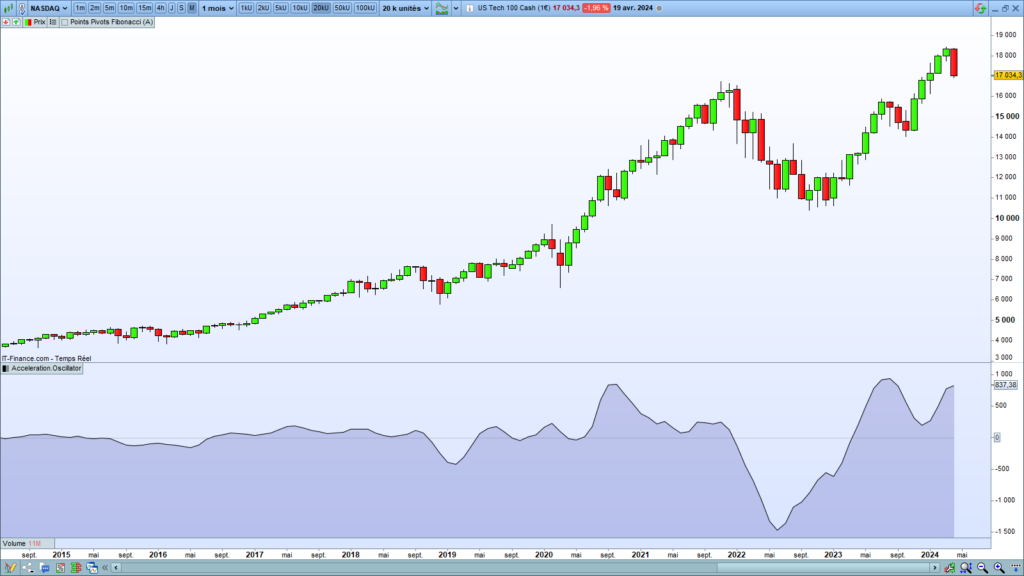
RETURN Acceleration AS "ACCELERATION", 0 COLOURED(50,50,50,50) Accelerator Oscillator example
Here is the Accelerator Oscillator run on the Nasdaq in the 1-month timeframe on the Prorealtime platform:
Measure the acceleration on other indicators
This method of acceleration measurement, which we calculated based on price, can be transposed to any technical indicators. You need to replace “close” with your preferred indicator in the « LinearRegressionSlope[period](close) » instruction.
Range Breakout Indicator for Prorealtime
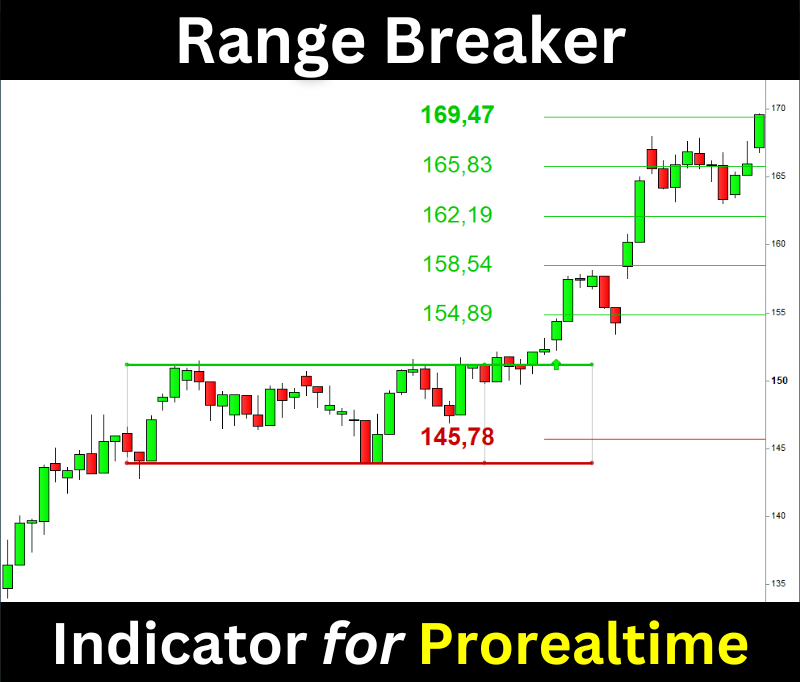
The Range Breaker will help you trade the Range Breakouts on Prorealtime. It displays the ranges, breakout signals, and target prices on your chart.
If you want to learn more about automated trading, please see our automated trading learning section. If you have any questions, please ask me in a comment. If this article pleased you, I would appreciate it if you shared it.