I think buying the dip is one of the most challenging strategies. It requires considerable caution. When I buy the dip in the stock market, sometimes I am right, and sometimes I am wrong. I made costly mistakes, but I had taken excellent deals. I will show you how to buy the dip from a long-term investment and provide you with the source code of my signal system, which is working on the Prorealtime platform.

Description of the buy-the-dip strategy
The strategy I will present is one that I personally follow with my own money. I developed this strategy after conducting numerous tests and observations over many years. I am not saying that my approach is the best, but it gave me profitable returns.
My buy-the-dip strategy consists of four stages:
- Choosing adapted assets
- Macroeconomic analysis
- Technical analysis
- Building a position
These steps enable me to determine when to initiate a buy-and-hold strategy and whether to continue with it. They help me shape my entry openings and stay rational. I leave no room for emotions during a bear market.
I. Choosing adapted assets to buy the dip
As I previously explained in the “What ETFs to buy during a bear market?” post, certain assets are more adapted to buy a bear market.
It would be best if you gave preference to these three categories of assets for buying the dip:
- The leading Industrial Average indices include the S&P 500, the Dow Jones, and the Euro Stoxx 50.
- The defensive ETFs with low beta, such as “Personal & Household Goods” or “Consumer Staples”.
- The stocks have excellent fundamentals, similar to those of Procter & Gamble or Colgate-Palmolive.
In this post, I chose to operate the Dow Jones to build a position in a dip. I would warn against buying the dip on highly volatile assets or assets with poor fundamentals. I experienced this acutely in the oil companies I described here: “How did I lose 10 000$ in five minutes?“.
II. Macroeconomic analysis
Before buying the dip, I try to understand why the market is falling and what macroeconomic data I need to watch to make an investment decision.
Identify the bear market root cause
Buying the dip means buying a bear market. A bear market has two dimensions: its duration and its depth. The first thing I do is to identify why the market falls. I try to know if the reason will persist in the long term or be episodic. Then, I evaluate the severity of this event. This stage is crucial because it will help me decide whether to start a position construction.
If the cause of the bear market is transient, I will rapidly begin to build a position. If it is persistent, I prefer to wait several quarters. If the severity of the situation is low, I will start buying the market after it reaches the first main support level. I prefer to wait until the market bounces on lower support if the severity is high.
Summary table depending on the type of events:
| Short duration | Long duration | |
|---|---|---|
| LOW SEVERITY | Buying the third/fourth supports | Wait one quarter |
| HIGH SEVERITY | Buying the third/four supports | Wait several quarters |
What are the key macroeconomic indicators to watch?
There are numerous macroeconomic data points. You will be flooded with information if you try to analyze all indicators. You need to focus on the indicators that have the most significant impact on the market. These key indicators change over time, depending on the economic paradigm. In the past, investors have closely monitored the Michigan Consumer Sentiment Index and the employment rate. The most critical macroeconomic indicators today are inflation and the Federal Reserve benchmark interest rates.
What is inflation?
As mentioned by Jean-Claude Trichet, former president of the European Central Bank, we can synthesize inflation by the variation of the unit cost of production. The unit cost of production is the total expenses incurred by a company to produce a certain quantity of goods or services, and then divide the total amount by the quantity produced. This unit cost encompasses all the expenses a company incurs to produce a good or deliver a service, including wages, raw materials, and energy.
Monitoring the sensitive assets for inflation
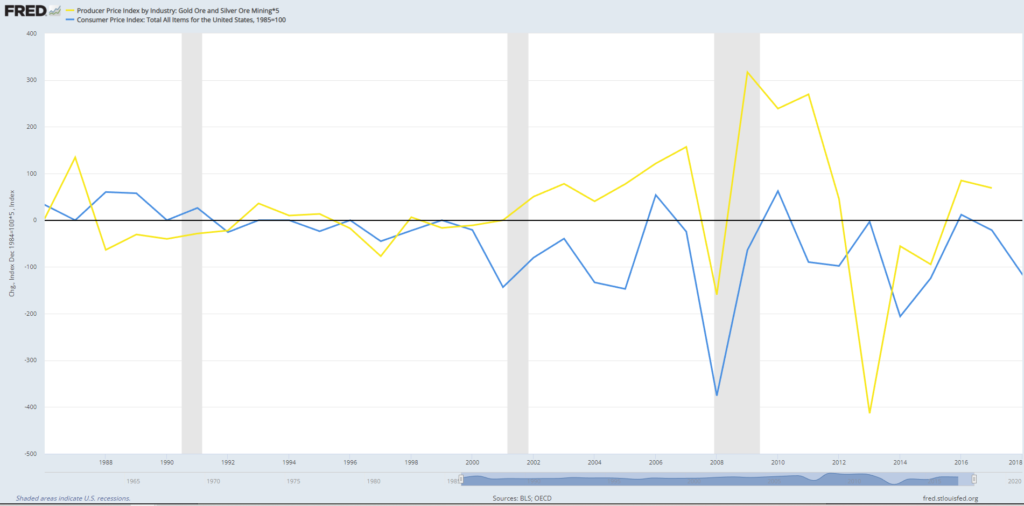
Certain assets are sensitive to inflation. That is the case with agricultural raw materials, precious and semi-precious metals like gold and silver, and energy like oil. The price of these assets tends to increase during inflationary periods and decrease during deflationary periods.
The following chart shows the gold & silver industry prices and the consumer price index. The macroeconomic data are updated on a monthly or quarterly basis. But the gold and silver prices are available in real-time. You can watch the gold price to monitor inflation:
Example of a macroeconomic analysis
Here is the last macroeconomic analysis I made for the second 2022 quarter.
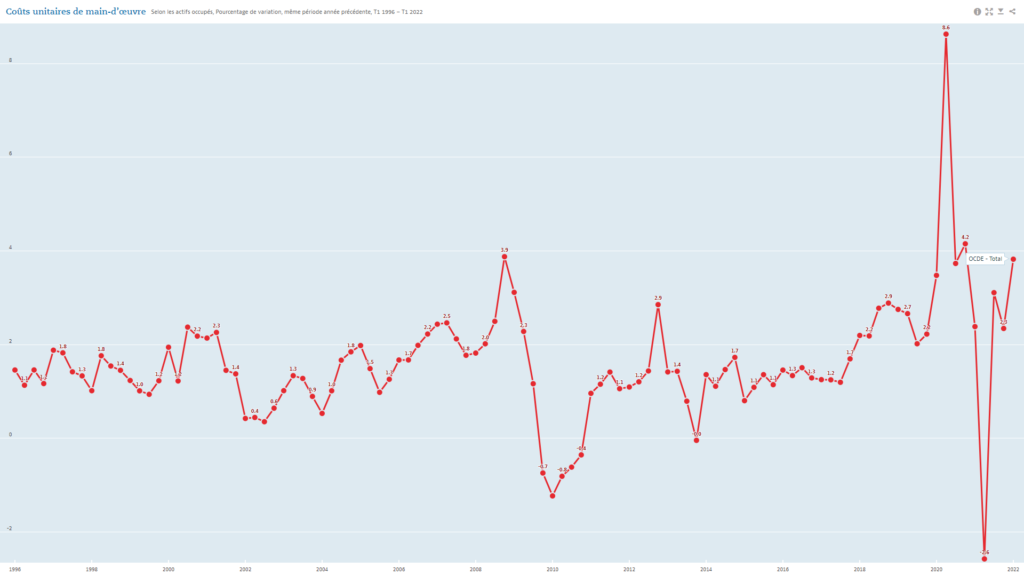
Unit labor cost
You can monitor the unit labor cost on the OECD website: https://data.oecd.org/fr/lprdty/couts-unitaires-de-main-d-uvre.htm
The following graphic shows the unit labor cost from 1996 to 2022. The pandemic crisis caused unprecedented instability in labor costs. The current level (2022-Q2) is slightly higher than the pre-crisis level:
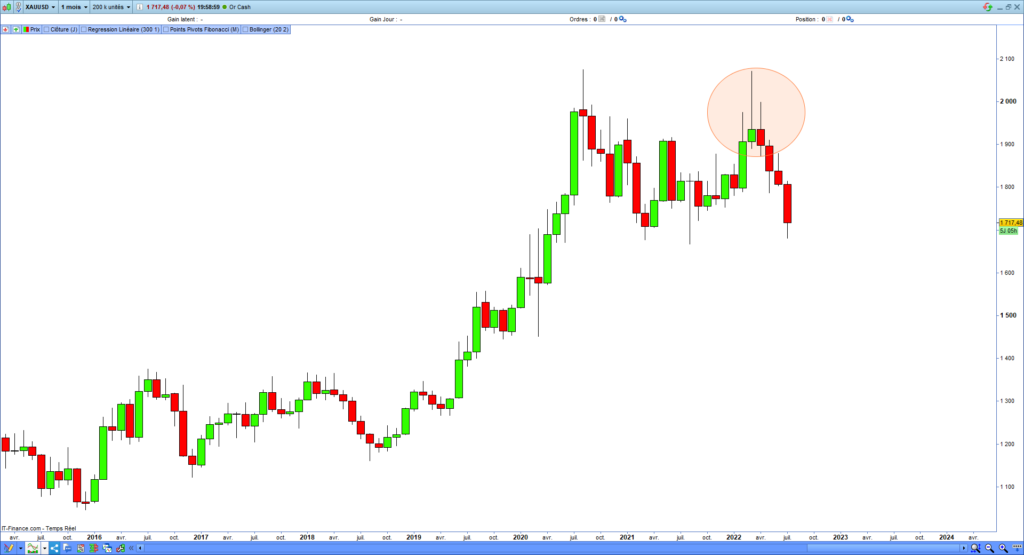
Gold price
The gold price appears to have started a bearish trend since April 2022, which is deflationary:
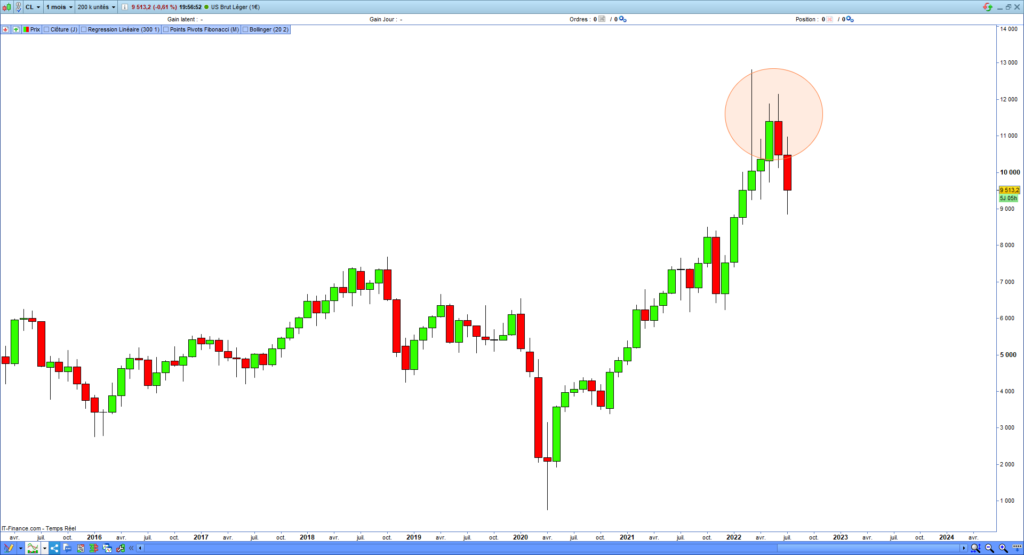
Oil price
Each economic situation is particular. In the current period, oil price fluctuations have had a significant impact on inflation. Monitoring this asset is essential to determine if the inflation peak has been reached.
The peak in the oil price appears to be over, and the price has decreased since June 2022:
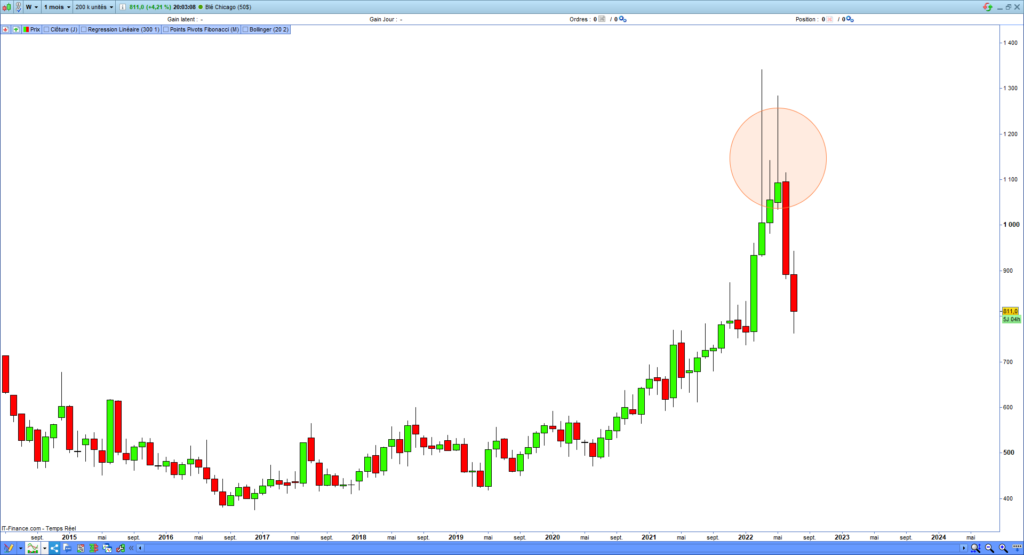
Wheat price
The wheat price has strongly decreased since its May 2022 peak:
Macroeconomic summary for the 2022-Q2
- The price increase, exacerbated by the Ukraine war, triggered the stock market collapse at the beginning of 2022. Inflation is the root cause of the market decline.
- Since the second quarter of 2022, gold, silver, oil, and wheat prices have significantly declined. It appears that some American companies plan to lay off employees in the next quarter.
Regarding these observations, I consider that the inflation peak has passed. Then I activated my buy-the-dip strategy I will present to you in the technical analysis paragraph. However, I stay prudent because the war in Ukraine is not finished.
III. Technical analysis
It is unnecessary to process a deeply technical investment analysis from a long-term perspective. However, ignoring what the market was doing in a buy-the-dip case would be dangerous. It is essential to monitor the global market and identify the most significant supports.
Defining the best time unit
As I mentioned in the “10 golden rules for buying the dip” post, the most reliable time units for buying the dip are weekly and monthly. They enable a better identification of the global trend and its main supports. These time units are insensitive to the market noise, which helps avoid false buying and selling signals.
Identifying the main supports
I primarily use the Fibonacci monthly pivots and the historically highest and lowest to localize the main supports. The pivot points are price levels corresponding to critical support and resistance levels. The market is often reactive to these price levels. They can be calculated in all-time units, but the monthly time unit is perfectly adapted to the buy-the-dip strategy.
Pivot points calculation
Pivot = ( H + B + C ) / 3

R3 = Pivot + 1.000 x ( H – L )
R2 = Pivot + 0.618 x ( H – L )
R1 = Pivot + 0.382 x ( H – L )

S1 = Pivot - 0.382 x ( H – L )
S2 = Pivot - 0.618 x ( H – L )
S3 = Pivot - 1.000 x ( H – L )
In the previous formula, H corresponds to the highest, B to the lowest, and C to the close price.
Source code for the pivot points calculation
The following source code is executable on the Prorealtime platform :
//------------------------------------------------------//
// * FIBONACCI PIVOT POINTS * //
Once lastMonthBarIndex = 0
Once monthlyHigh = undefined
Once monthlyLow = undefined
Once monthlyPivot = undefined
Once monthlyR1 = undefined
Once monthlyS1 = undefined
Once monthlyR2 = undefined
Once monthlyS2 = undefined
Once monthlyR3 = undefined
Once monthlyS3 = undefined

If Month<>Month[1] then

  duration = BarIndex - lastMonthBarIndex

  IF duration <= 0 THEN
    duration = 1
  ENDIF

  monthlyHigh = Highest[duration](High)[1]
  monthlyLow = Lowest[duration](Low)[1]
  lastMonthBarIndex = BarIndex

  monthlyPivot = (monthlyHigh + monthlyLow + Close[1]) / 3

  // FIBONACCI SUPPORTS
  monthlyS1 = monthlyPivot - .382 * (monthlyHigh - monthlyLow)
  monthlyS2 = monthlyPivot - .618 * (monthlyHigh - monthlyLow)
  monthlyS3 = monthlyPivot -  1 * (monthlyHigh - monthlyLow)

Endif
Monthly pivot on the Dow Jones
The following chart shows the area where the price closes under the thirty-month support:
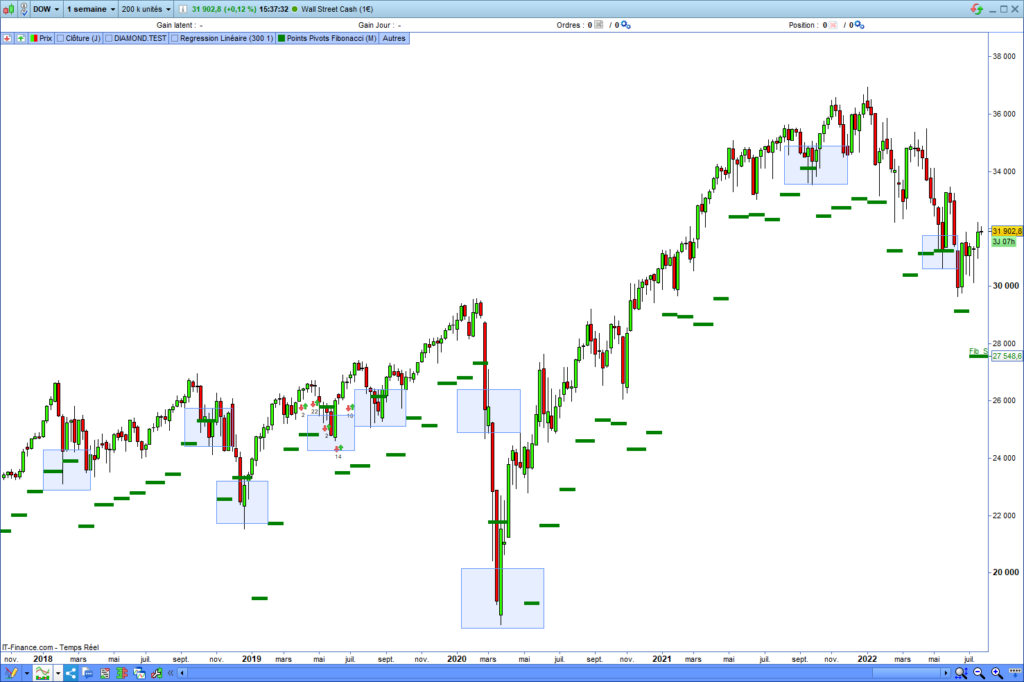
Buying conditions under the support
Now I will create the condition to open an entry under the monthly pivots. The following source code checks the price closes under the third monthly pivot :
conditionPivotFibo = close =< monthlyS3Evaluating the falling force
I never open an entry if the market crosses support too brutally. When the market is strongly bearish, it breaks most of the supports. Although this is self-evident, predicting where the market will rebound is a challenging task. Implementing a volatility indicator into your strategy is an excellent way to avoid opening a position during a significant drop. It is sufficient to wait until the market calms before opening an entry.
Volatility checking source code
You must ensure the market has not broken the support too abruptly. Numerous technical indicators can measure volatility. One of the most straightforward is the Bollinger bands. It draws inferior and superior bands around the price. These bands are standard deviations. The crossing of these bands expresses an increase in abnormal volatility.
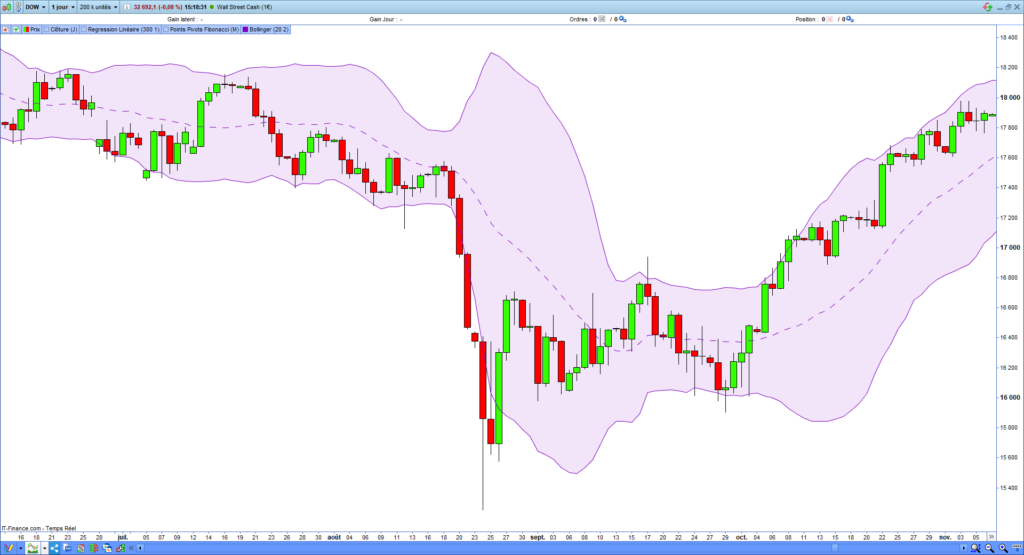
The following source code checks that the price does not cross these bands before opening an entry:
// * BOLLINGER BANDS * //
dev = 2 //quantity of deviation
avg = average[20](close) //mean
BollingUp = avg + std[20](close)*dev //Bollinger Up value
BollingDown = avg - std[20](close)*dev //Bollinger Up value

conditionVolatility = close < BollingUp AND close > BollingDown
IV. Buy the dip signal system
I am going to present to you a backtest of a buy-the-dip strategy. This strategy is purely technical. It will provide you with buying signals during dips, regardless of macroeconomic conditions. You will have to process this verification before opening a position. The source code of this signal system is runnable on the Prorealtime platform. It works like an indicator.
Source code of my buy-the-dip strategy
The technical conditions I use to buy the dip are simple: I open an entry only if the price closes under monthly support and the volatility is not excessive. The following source code sends a buying signal if the price closes under the third monthly pivot and if the price has not broken the Bollinger bands:
//------------------------------------------------------//
// *** BUY TH DIP STRATEGY ***
//------------------------------------------------------//
// Signal initialization
SIGNAL = 0
//------------------------------------------------------//
// * BOLLINGER BANDS * //
dev = 2 //quantity of deviation
avg = average[20](close) //mean
BollingUp = avg + std[20](close)*dev //Bollinger Up value
BollingDown = avg - std[20](close)*dev //Bollinger Up value

conditionVolatility = close < BollingUp AND close > BollingDown

//------------------------------------------------------//
// * FIBONACCI PIVOT POINTS * //
Once lastMonthBarIndex = 0
Once monthlyHigh = undefined
Once monthlyLow = undefined
Once monthlyPivot = undefined
Once monthlyR1 = undefined
Once monthlyS1 = undefined
Once monthlyR2 = undefined
Once monthlyS2 = undefined
Once monthlyR3 = undefined
Once monthlyS3 = undefined

If Month<>Month[1] then

  duration = BarIndex - lastMonthBarIndex

  IF duration <= 0 THEN
    duration = 1
  ENDIF

  monthlyHigh = Highest[duration](High)[1]
  monthlyLow = Lowest[duration](Low)[1]
  lastMonthBarIndex = BarIndex

  monthlyPivot = (monthlyHigh + monthlyLow + Close[1]) / 3

  // FIBONACCI SUPPORTS
  monthlyS1 = monthlyPivot - .382 * (monthlyHigh - monthlyLow)
  monthlyS2 = monthlyPivot - .618 * (monthlyHigh - monthlyLow)
  monthlyS3 = monthlyPivot -  1 * (monthlyHigh - monthlyLow)

Endif

//conditionPivotFibo = close =< monthlyS2
conditionPivotFibo = close =< monthlyS3

//------------------------------------------------------//
// *** ENTRY OPENING **//
IF conditionVolatility AND conditionPivotFibo THEN
  SIGNAL = 1
ENDIF

RETURN SIGNAL AS "BUYTHEDIP"
Buy the dip strategy backtesting
The following chart shows the dip openings on the Dow Jones index:
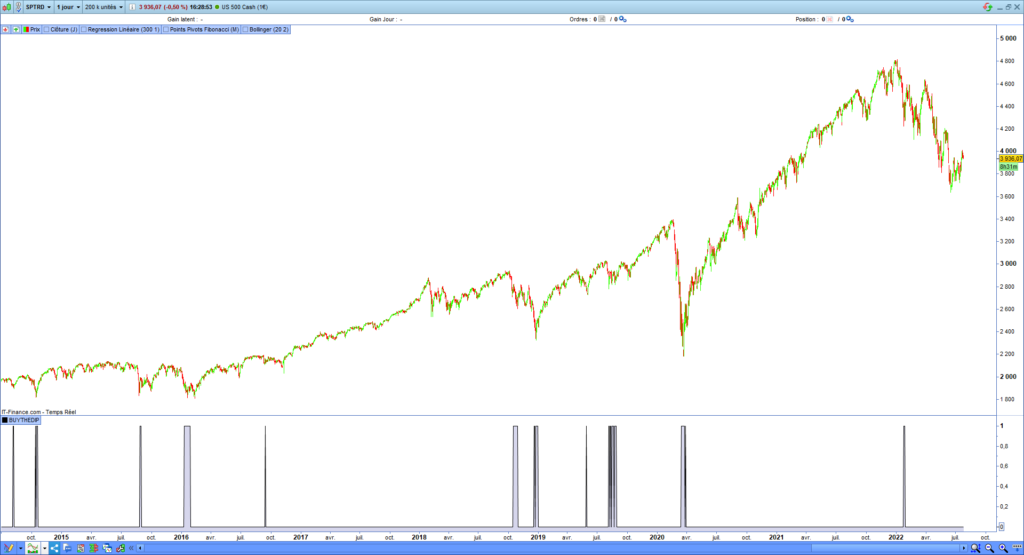
Buy the dip strategy analysis
This purely technical buy-the-dip strategy works as expected. It provides buying signals when the market breaks a monthly pivot, provided the volatility is not excessive.
If you run the previous source code for an extended period, you will see that the strategy opened up too soon during the 2008 crash. I thoroughly studied this problem using various trading strategies. I never find a technical indicator capable of predicting a market crash. Outside the Corona crash, which was particularly violent, it is impossible to differentiate a dip from the start of a market crash. That is why I integrated the macroeconomic analysis into my strategy.
V. Building a position during a dip
I use this buy-the-dip strategy like a signal system. I start to build a position in a dip only if the macroeconomic and technical conditions are met. I can decide whether to take the buying signal or not. Sometimes I leave a bit of time before opening an entry. I will buy the dip if the market and macroeconomic conditions remain valid. If the conditions deteriorate, I will stop buying at the market. This allows me to manage my risk exposure depending on the situation’s evolution. I fixed the entry size, habitually between 500€ and 1000€. The maximum size of my position is around 10000€ in assets. I prefer to take time to build a position before completing a line. Depending on the asset, I open new entries on a monthly or quarterly basis.
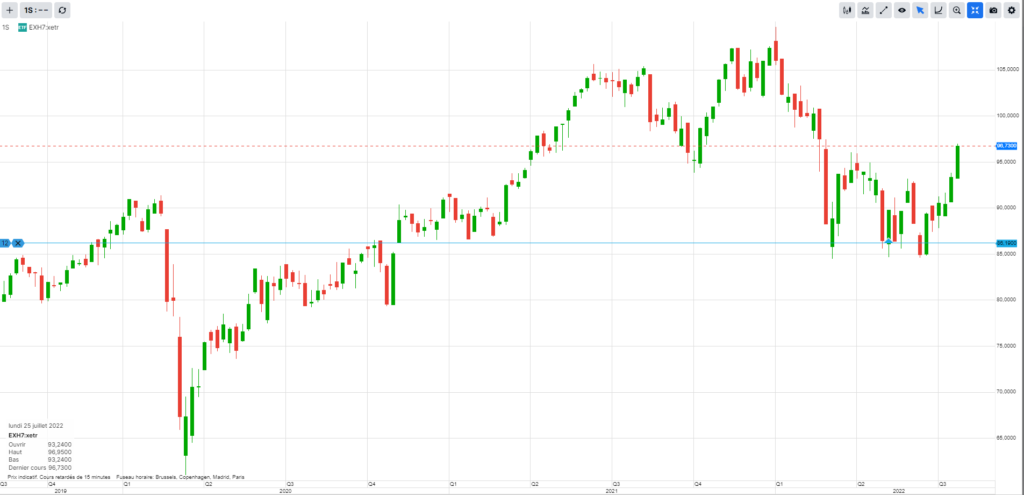
I am building a position on the Euro stocks 50, the “Personal & Household Goods” and the “Consumer Staples” ETFs. I did not take all the signals sent by my system for some weeks. On the following chart, the blue line corresponds to my entry price on the Personal & Household Goods ETF:
Buy the dip Summary
Buying the dip needs to be prudent. Here is the synthesis of the stages of buying the dip:
- Evaluating the severity of the bear market cause.
- Identify the main supports and wait for a decrease in market volatility.
- Focusing on main indexes or defensive assets.
- Building a position progressively, depending on the evolution of the market.
Range Breakout Indicator for Prorealtime
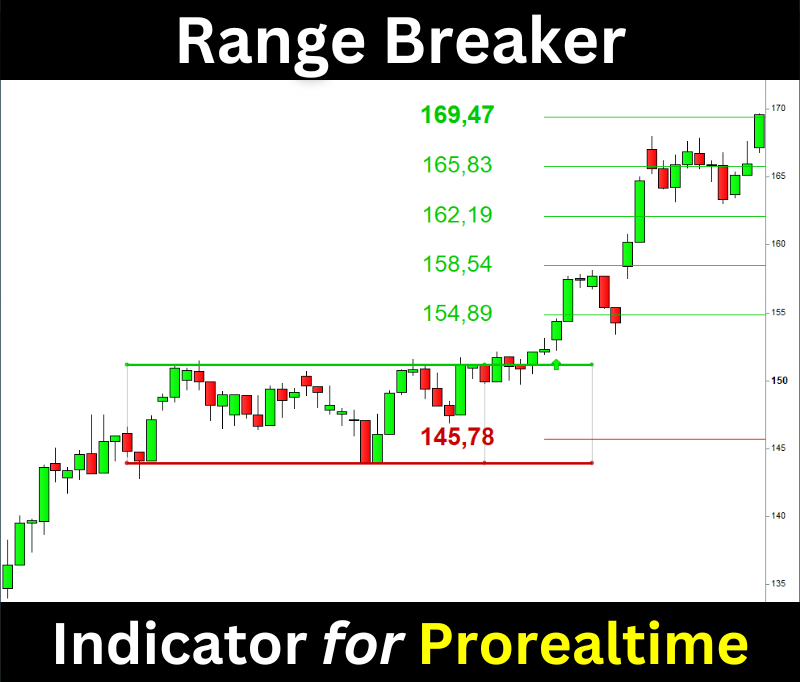
The Range Breaker will help you trade the Range Breakouts on Prorealtime. It displays the ranges, breakout signals, and target prices on your chart.