Honestly, it took me a lot of time to understand how to buy the dip. My first positions were disastrous, and I lost a significant amount of money before I learned when to buy the dip. Thanks to my mistakes, I established ten rules for buying a dip safely from a long-term investment. Let me share my experience and explain the ten rules.
- How did I lose 10 000$ in five minutes?
- 1. Selecting a stock list
- 2. Prioritizing the quality of fundamentals
- 3. Choosing the best sectors
- 4. Favoring the low beta
- 5. Defining the maximum position size
- 6. Define the entry size
- 7. Choosing the right time unit
- 8. Defining a buying frequency
- 9. Spotting the main long-term supports
- 10. Be patient
- Summary
How did I lose 10 000$ in five minutes?
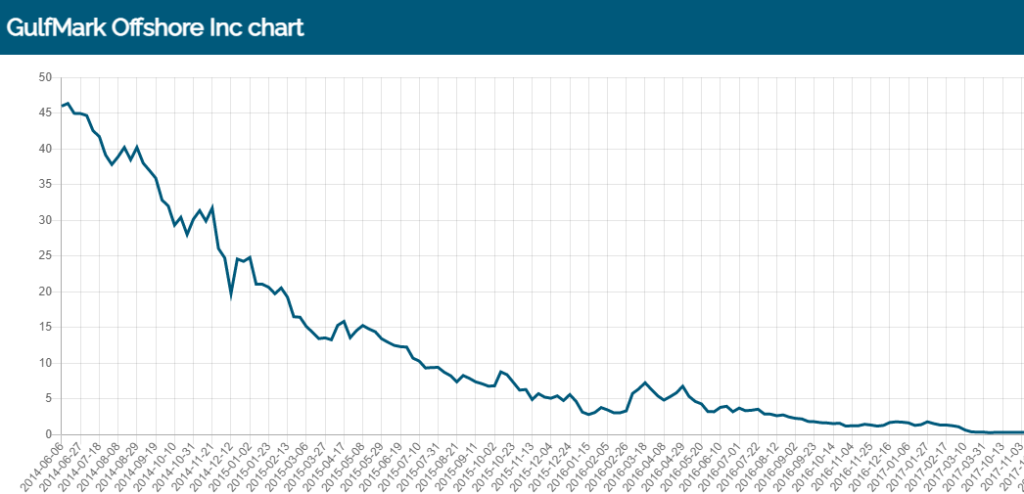
I took my first counter-trend entry in the oil companies during the 2015 crash. I increased my positions while falling until I reached considerable exposure. In 2016, OPEC strongly reduced its crude oil production, triggering a significant rise for oil companies. On this day, I hit the jackpot! I thought I had discovered the secret to making money in stocks. During the second crude oil drop, I restarted averaging an enormous position on oil companies, including “Gulfmark Offshore”. The OPEC reduced its crude oil production again, but the market considered this measure insufficient. The crude oil dropped 7% in the day, and Gulfmark filed for Chapter 11 sometime later. I fired my position and took a loss of 10000$. I repeated the same error with the automotive industry sometime later, ending with another significant loss.
After that, I questioned my investment capacity and decided to learn trading system programming and backtesting. I began a lengthy period of strategy backtesting using the ProRealTime platform. I may have experimented with thousands of strategies across various assets. I will share the rules I found to buy a dip on the market safely.
1. Selecting a stock list
When the market falls, many opportunities occur. If you do not have a list of stocks or ETFs, you will be flooded with a number of opportunities. You will risk opening positions without deeply analyzing what you will regret later. In a market-falling case, you should prepare a list of stocks and ETFs you agreed to buy. Ideally, this list would contain, at most, ten stocks and ETFs.
Here is my stocks list I would buy during a dip:
| Procter & Gamble |
| Colgate Palmolive |
| Air Liquide |
| L’Oréal |
Here is my ETFs list I would buy during a dip:
| iShares Dow Jones Industrial Average |
| iShares MSCI World Consumer Staples |
| iShares STOXX Europe 600 Personal & Household Goods |
In the post “What ETFs to buy during a bear market?” I explain why I chose these ETFs.
2. Prioritizing the quality of fundamentals
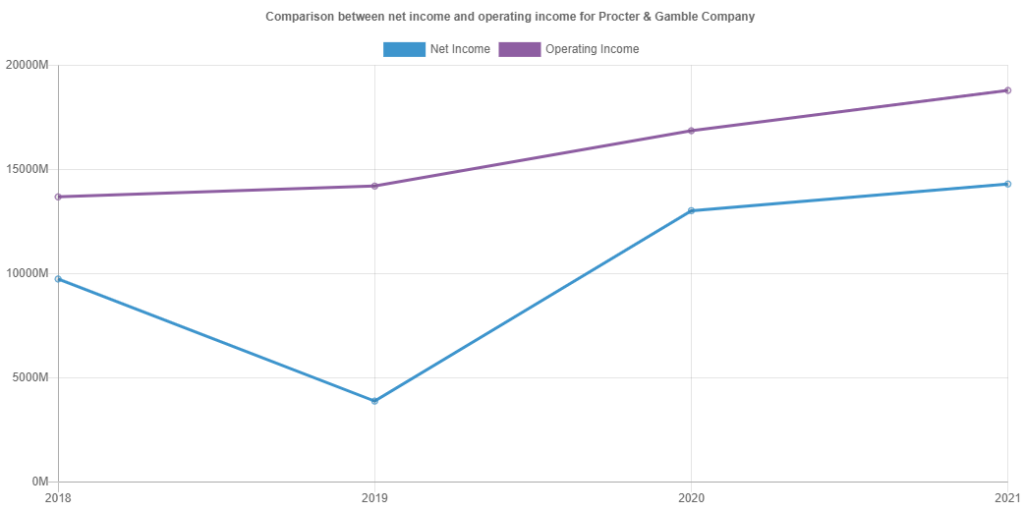
There is something counterintuitive during a bear market. The most solid company stocks decrease less than the others. One is tempted to buy a stock that dropped 50% rather than another that dropped 20%. In fact, it is the opposite. The stocks that decreased less during a crash or a recession have the best chance to benefit from the next bull market. Companies with the most robust fundamentals are likely to bounce back and profit from the next economic cycle.
You can see how Procter & Gamble survived the pandemic crisis:
3. Choosing the best sectors
Choosing the right sector is essential if you want to buy the dip. Some sectors are definitely unsuitable for counter-trend strategies. This is especially true in the energy, automotive, and raw materials sectors. These sectors are too volatile to identify a dip. Others, such as the technology and utility sectors, are highly sensitive to interest rates. While interest rates are low, buying the dip in technology and utilities can yield benefits. If the rates increase, they risk plunging for an extended period.
The sector I prefer to buy the dip in is Consumer Defensive. The industries included in this sector produce essential goods for daily life.

4. Favoring the low beta
You should pay attention to the beta during a highly volatile market period. The beta indicates the volatility of an asset regarding a benchmark index. Habitually, the benchmark is the S&P 500. A 0.5 beta of a stock means the amplitude of its price is half that of the S&P 500. If the S&P 500 decreases by 20%, this stock decreases by 10%. Inversely, if the S&P 500 increases by 20%, this stock increases by 10%. If a stock’s beta is 2, its volatility is twice that of the S&P 500.
The following chart shows the performance of the low-volatility stocks against the US stock market:
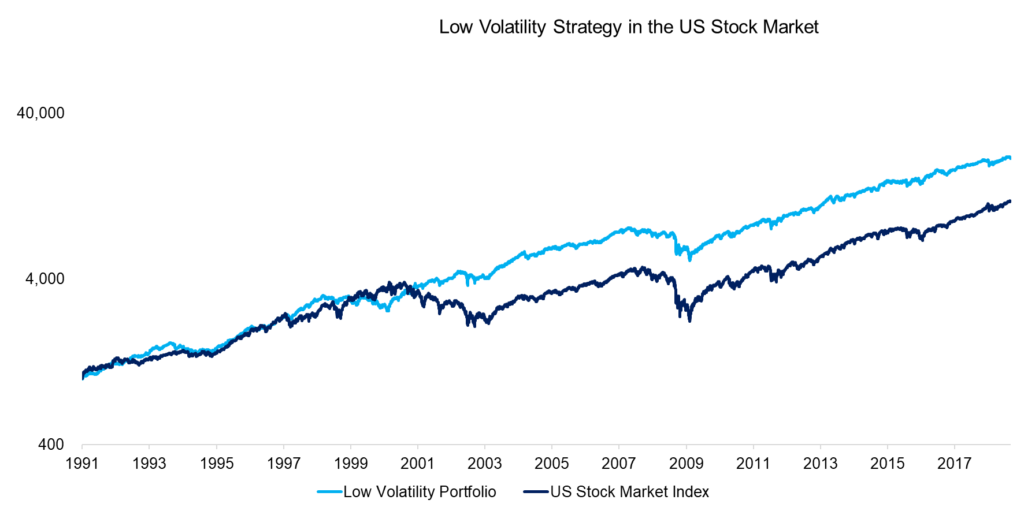
Source: FactorResearch, THE DARK SIDE OF LOW-VOLATILITY STOCKS
5. Defining the maximum position size
It is crucial to define the maximum position size. That will allow you to avoid a portfolio that is too imbalanced. I believe my biggest mistake has been taking an overly large position in a single stock. If you are wrong on one stock in a well-balanced portfolio, this mistake will be compensated for by the other lines. The position size depends on the type of asset you operate. I defined a maximum position size of €2,000 per stock, €5,000 per specialized exchange-traded fund (ETF), and €10,000 per leading ETF. A “specialized ETF” is a sector-specific ETF, such as the S&P 500.
Here is the summary table showing the relative position size to your capital:
| Type of Asset | Capital proportion |
|---|---|
| Stocks | 2% |
| Specialized ETF | 5% |
| Main ETF | 10% |
6. Define the entry size
After defining the maximum position size, you will have to set the size of each entry you will open on an asset. Habitually, I open entries between 500€ and 1000€. The definition of the ideal entry size depends on several factors. The entry size will mainly depend on the maximum position size and the broker’s fees. I chose a low position size, for example, 2000€, and I will take stakes of 500€. If the total position size is €10,000, I will open stakes of €1,000. However, if the broker fees are high, I would prefer to open entries for 1000€ to reduce the transaction cost. In principle, if you trade liquid stocks or main indexes, the spread would be thin.
Summary entry size table:
| Max Position Size | Low Broker Fees | High Broker Fees |
|---|---|---|
| 2000€ | 500€ | 1000€ |
| 5000€ | 500€ | 1000€ |
| 10000€ | 1000€ | 1000€ |
7. Choosing the right time unit
The time unit corresponds to the candle duration. The most adapted time units for long-term investments are weekly and monthly. These time units enable the highlighting of an asset’s trend. You can set an entry point from a daily timeframe for long-term investment. However, if you operate under a daily time unit, you risk confusing market noise with the buying signal. The more you watch the market in a short time, the more the market movements are noised. The effective approach involves identifying the trend from a monthly timeframe and setting entry points based on a daily or weekly timeframe.
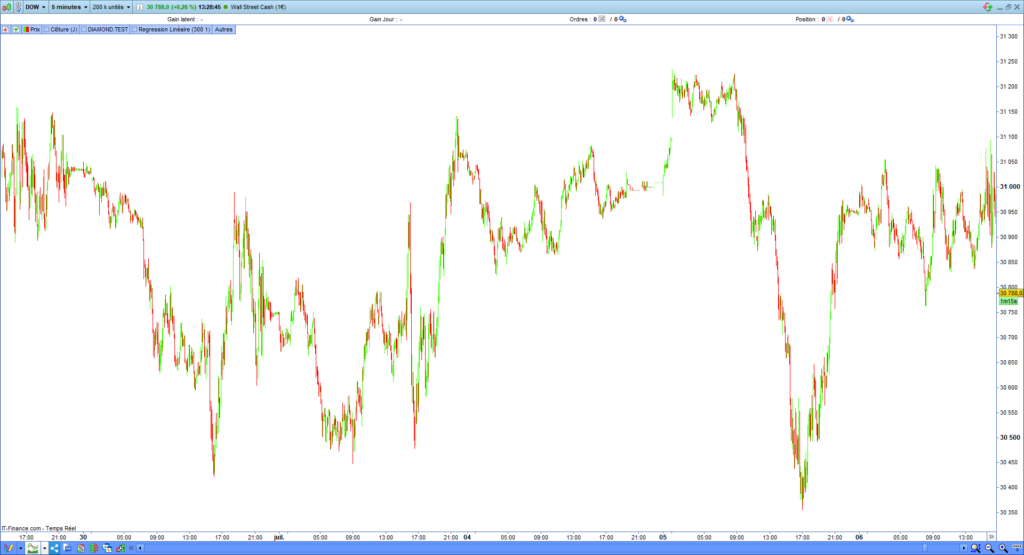
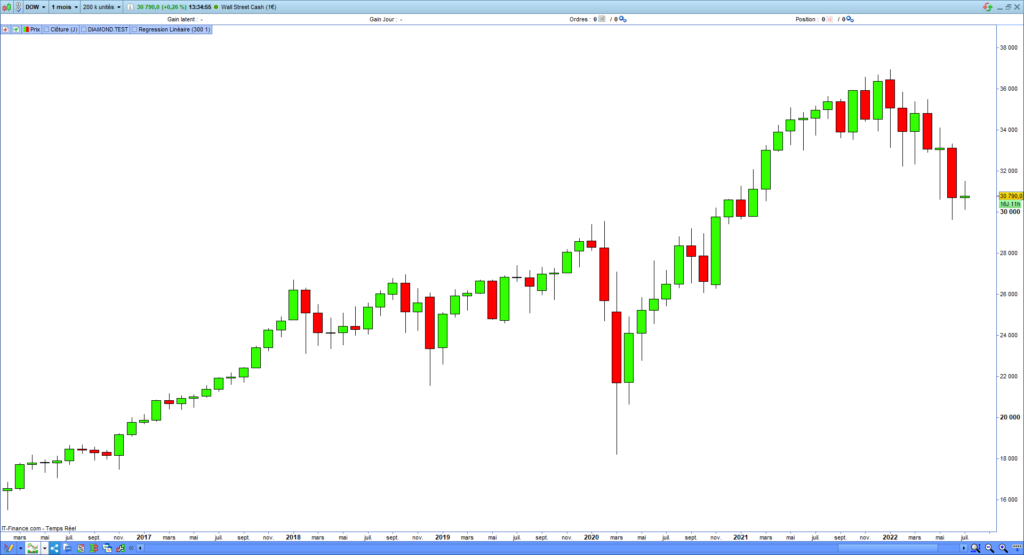
The following two charts show a noisy price timeframe (5-minute) and a timeframe allowing the trend reading (monthly):
Five-minute Dow Jones price:
Monthly Dow Jones price:
8. Defining a buying frequency
The space-time between each new entry characterizes the buying frequency. When I buy a dip, I prefer to space my entries and take time to build a position. Usually, I space each entry by one month. It is impossible to predict the depth and its duration. In addition, if you respect a monthly buying frequency by imposing the requirement to buy one entry alone, that will force you to select the best opportunity. That meets the second rule, which is favoring quality.
Example of an investment signal system buying a dip on the Euro Stocks 50:
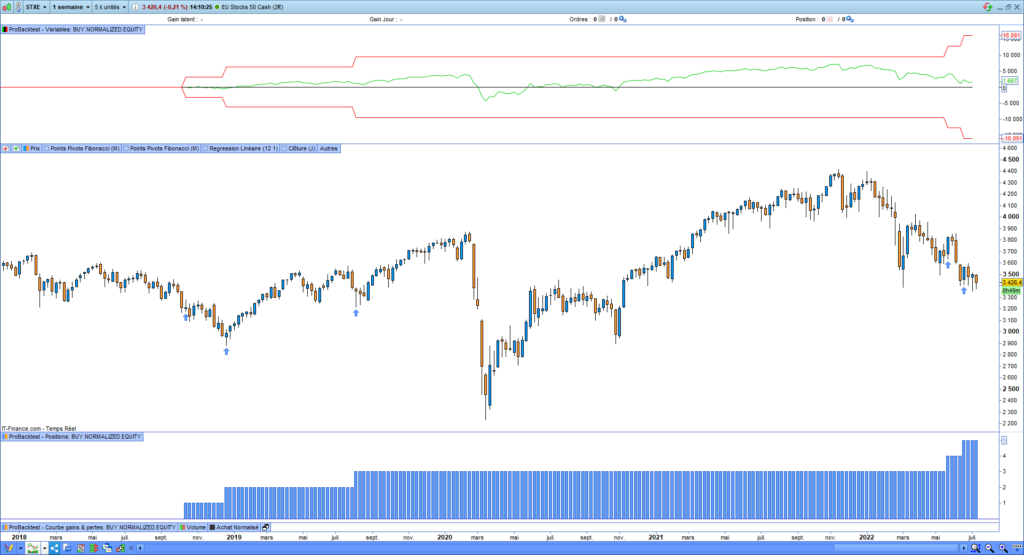
I wrote a complete post explaining how to buy the dip. You can obtain the source code of the buy-the-dip signal system, which is runnable on the Prorealtime platform.
9. Spotting the main long-term supports
The main supports are significant price levels. They correspond to prices at which big price movements occur. For example, they could be the historical high or low. These price levels durably shifted the market trend.
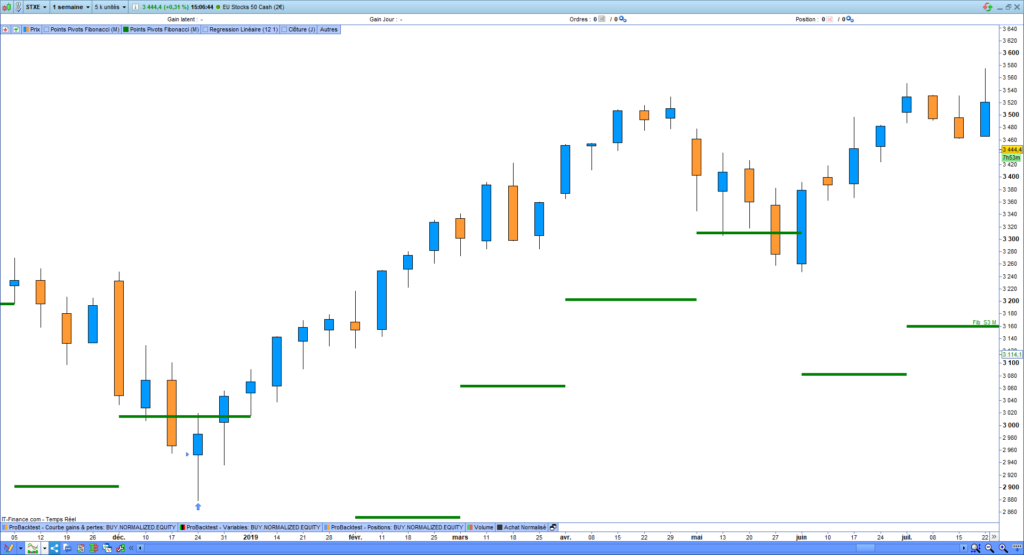
These supports and resistances can be « predicted » thanks to monthly Fibonacci retracements. Most trading platforms allow the monthly pivots to be printed on the chart price. These pivots will indicate if the market will rebound or confirm its trend. If the market bounces on a monthly pivot or an older highest/lowest price, that may be the end of the dip. If the price crosses these levels, the market could continue its trend.
Here are some monthly pivot points on the Euro stocks 50:
10. Be patient
I believe patience is the most valuable quality for an investor. However, be careful on this point: patience does not mean buying at the highest price, seeing the market collapsing, and concluding that you must be patient to get your money back. The patience counts as before opening an entry as after. From a monthly point of view, the dips occur approximately every two years on the main indexes. You must show patience before starting a position construction in a dip. The market needs time before a bounce. It can consolidate over several quarters. You must show patience again before the market gives you the right.

Summary
Buying a dip amounts to betting against the market. That means you consider everybody wrong. From a long-term perspective, it can be justified. If you believe the root cause of the market fall is episodic and the world economy will absorb it, you may be right to buy the market. However, do not forget the technological bubble bursting in 2001 and the real estate 2008 crisis. You should not buy the dip if you think there is a bubble bursting or a paradigm shift.
In the next post, I will describe how I buy the dip and show you the technical indicators and algorithms I use to build a position during a dip.
Range Breakout Indicator for Prorealtime
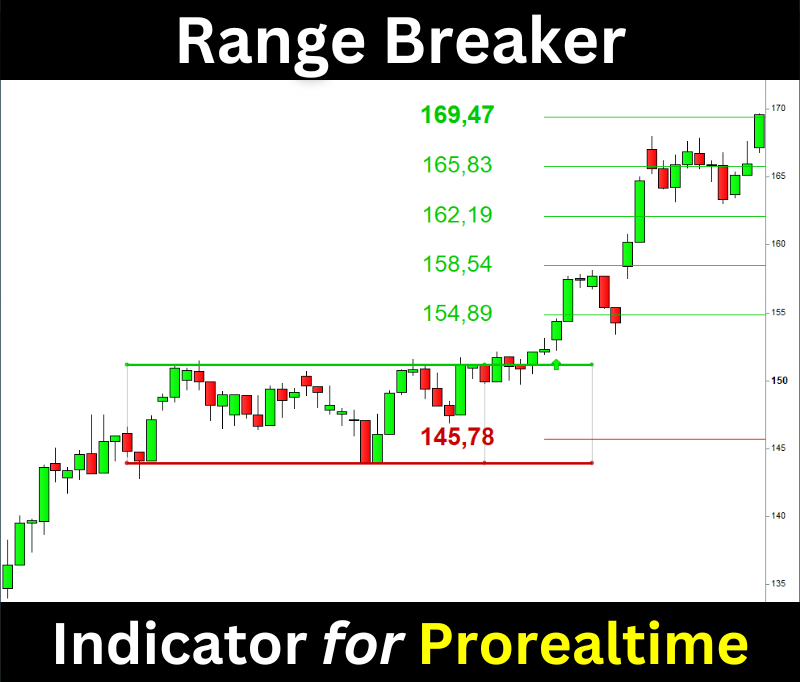
The Range Breaker will help you trade the Range Breakouts on Prorealtime. It displays the ranges, breakout signals, and target prices on your chart.
Credit image:
https://www.pexels.com/photo/gold-10-paper-cut-2249538/
https://www.pexels.com/photo/young-couple-selecting-food-in-market-4173325/
https://www.pexels.com/photo/silhouette-of-woman-with-fishing-pole-sitting-on-bech-2174613/
If you liked this post, please share it on your social media 🙂