Take advantage of increased volatility
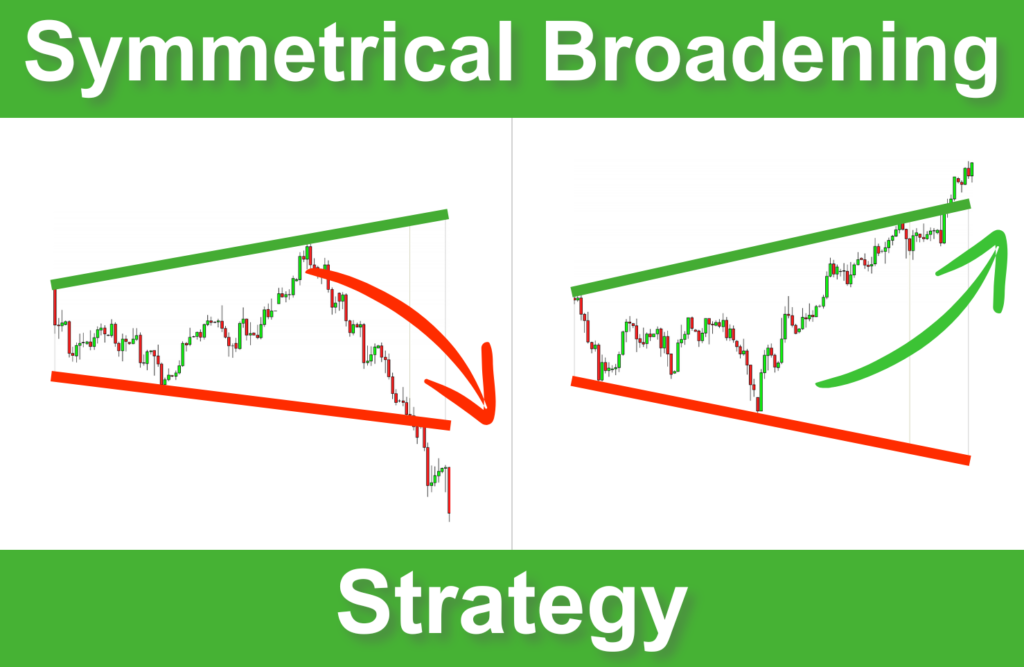
Sometimes, the market’s volatility increases significantly, making its reading difficult. Prices make higher highs and lower lows without taking a new direction. This is precisely where symmetrical broadening wedges will help you. This pattern forms in highly volatile markets, providing excellent bullish and bearish reversal signals.
In this post, I will show you how to use symmetrical broadening wedges to take advantage of increased volatility.
What is a Symmetrical Broadening Wedge?
A Symmetrical Broadening Wedge is a chart pattern that occurs during periods of increasing volatility. It appears when the price makes higher highs and lower lows within two diverging trendlines, creating a shape that looks like an expanding wedge.
This figure reflects market indecision, with traders pushing the price to extremes in both directions. The breakout of one of its shaping lines will determine the next trend.
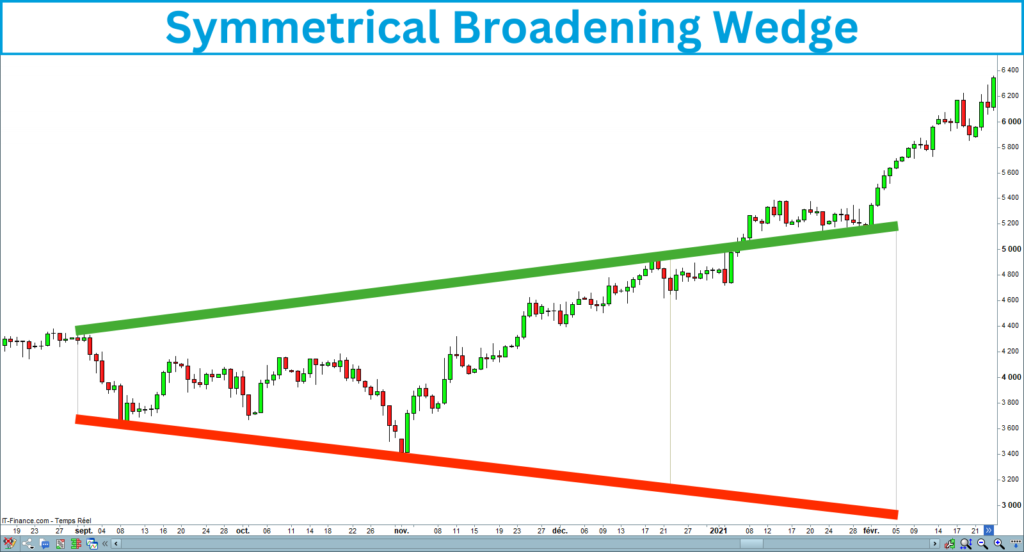
The following screenshot shows a symmetrical broadening wedge that occurred on the WTI in the daily time unit:
Symmetrical Broadening Wedge Recognition
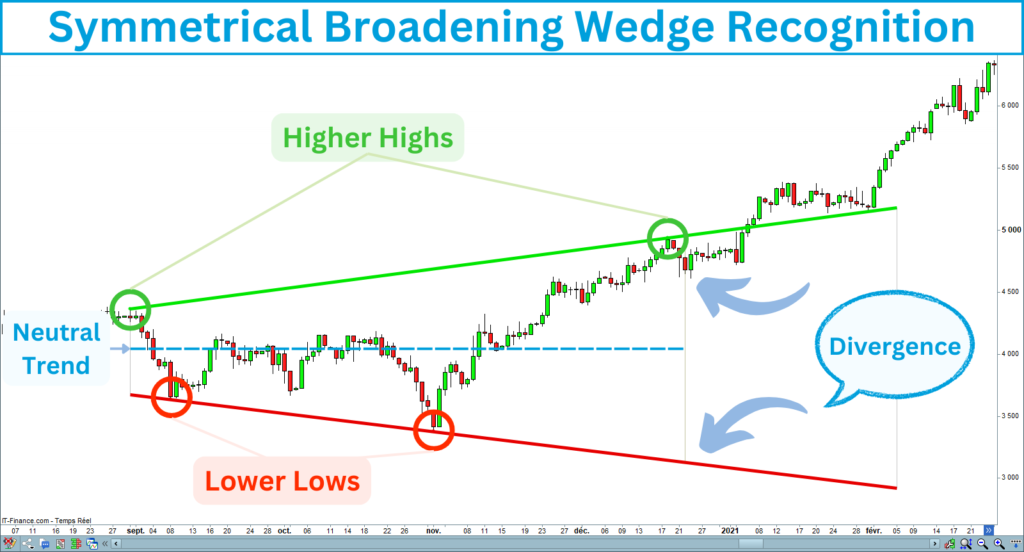
Before plunging into the strategy, you must correctly recognize the symmetrical broadening wedges on your charts. Here are the key characteristics of this pattern you have to check:
The following chart shows a symmetrical broadening wedge meeting the previous criteria:
The Symmetrical Broadening Wedge Breakouts
The breakout happens when the price closes beyond one of the trendlines of the wedge. This indicates that the price will start a new trend. A breakout can be bullish or bearish.
A. Bullish Breakout
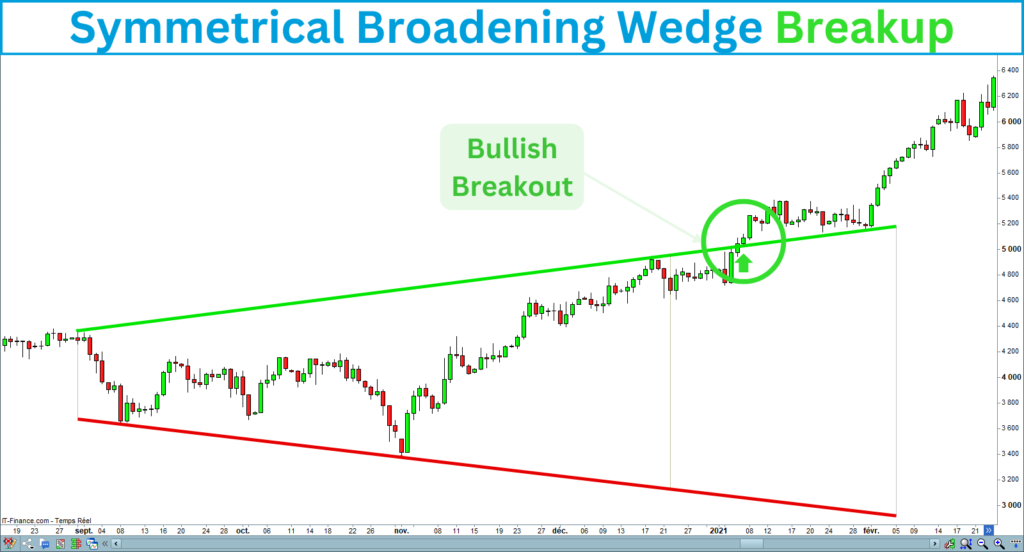
A bullish breakout occurs when the price breaks above the top line of the wedge. This means buyers have gained control, and the price could start a new bullish trend.
Here is an example of a symmetrical broadening wedge bullish breakout:
B. Bearish Breakout
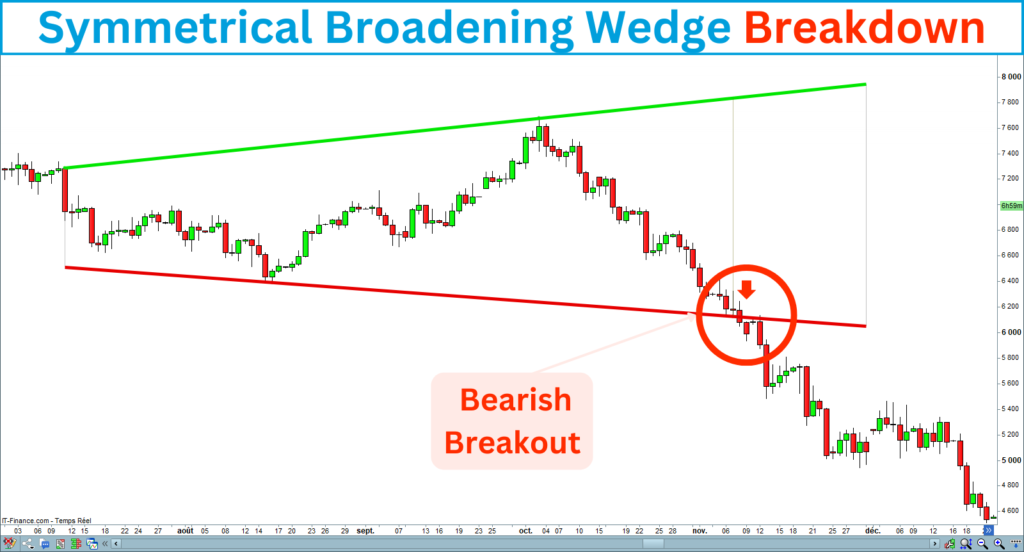
A bearish breakout occurs when the price breaks below the bottom line of the wedge. This signifies that sellers have taken control, and the price could start a new bearish trend.
Here is an example of a symmetrical broadening wedge bearish breakout:
How to Trade the Symmetrical Wedge Breakouts?
Trading the symmetrical broadening wedge involves waiting for a confirmed breakout to capitalize on the upcoming reversal trend. After filtering the signals, you will enter the trade and place your stop-loss and take-profit levels. I will show you the steps to trade this pattern effectively:
1. Identify the Symmetrical Wedge Pattern
First, spot the symmetrical broadening wedge on your chart by drawing its two trendlines: one connecting the lower lows and the other connecting the higher highs. Ensure that the two lines diverge and the price widening ranges horizontally, forming a broadening wedge:
2. Wait for the Breakout
Wait for the price to break above the top line or below the bottom line before entering the trade. It’s crucial not to jump into the trade before a completed breakout to avoid false signals:
3. Validate the Breakout
Sometimes, the price closes beyond a trendline and reverses. So, it is essential to validate the breakout before entering a trade.
To validate a breakout, ensure the following candle closes in the same direction:
- A bullish breakout is validated when the next candle closes above the upper line.
- A bearish breakout is validated when the next candle closes below the down line.
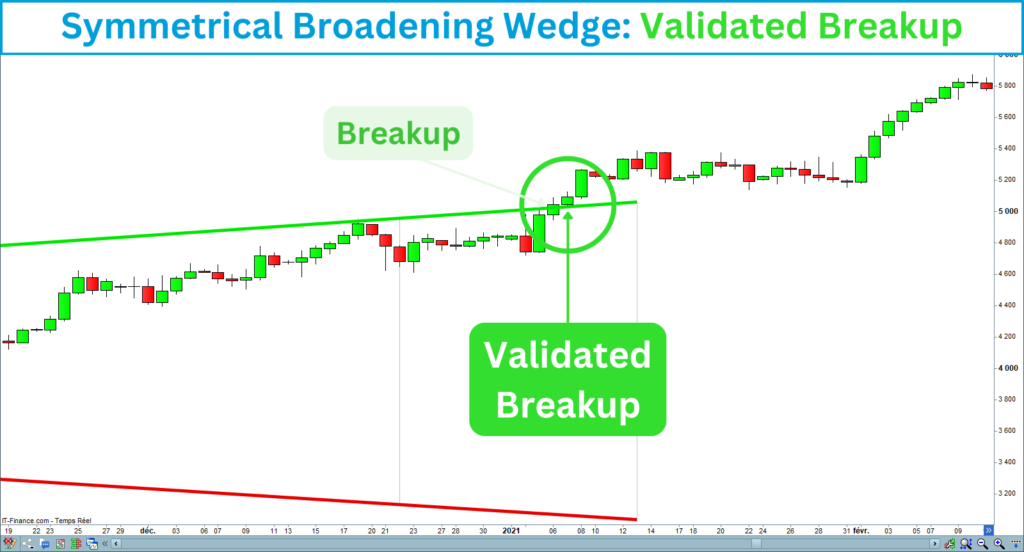
Validated breakup
Here is an example of a validated bullish breakout of a symmetrical broadening wedge:
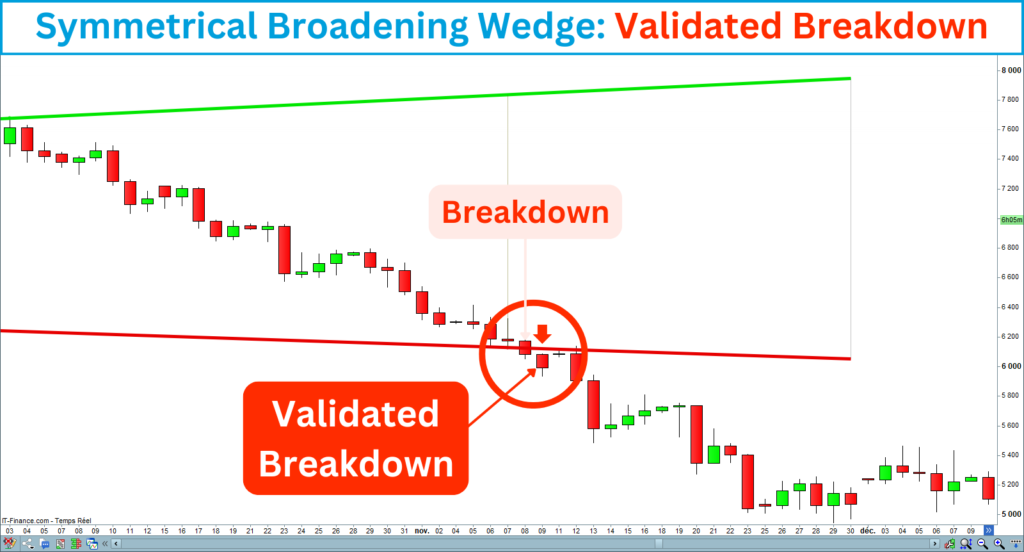
Validated breakdown
Here is an example of a validated bearish breakout of a symmetrical broadening wedge:
4. Confirm the signal with the volumes
The volume is probably the best indicator to confirm a signal. It reveals a consensus about the starting trend.
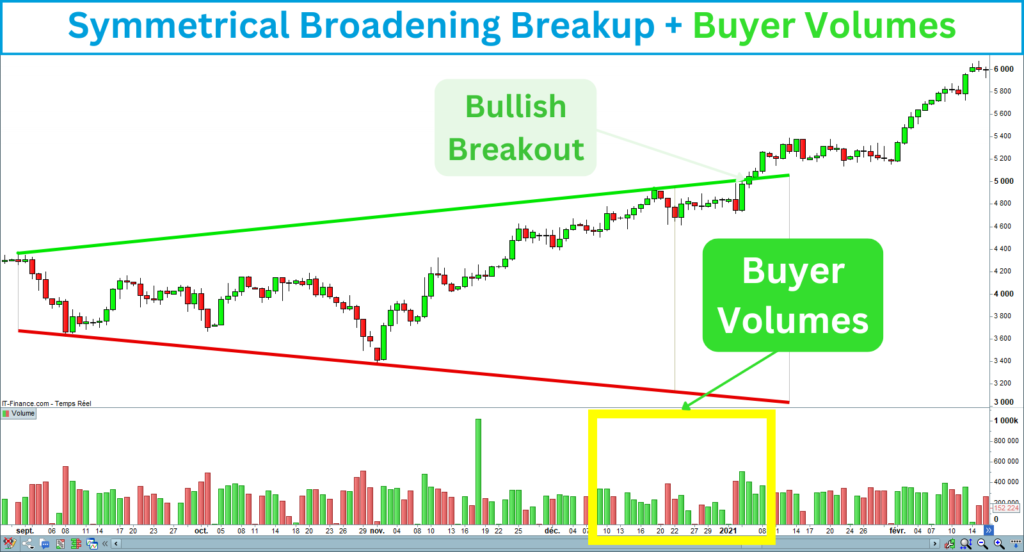
Verify that substantial or increasing volumes corroborate the signal. Ensure buyer volumes support the bullish breakout and seller volumes support the bearish breakout.
Buyer volumes
The following chart shows buyer volumes supporting a bullish breakout:
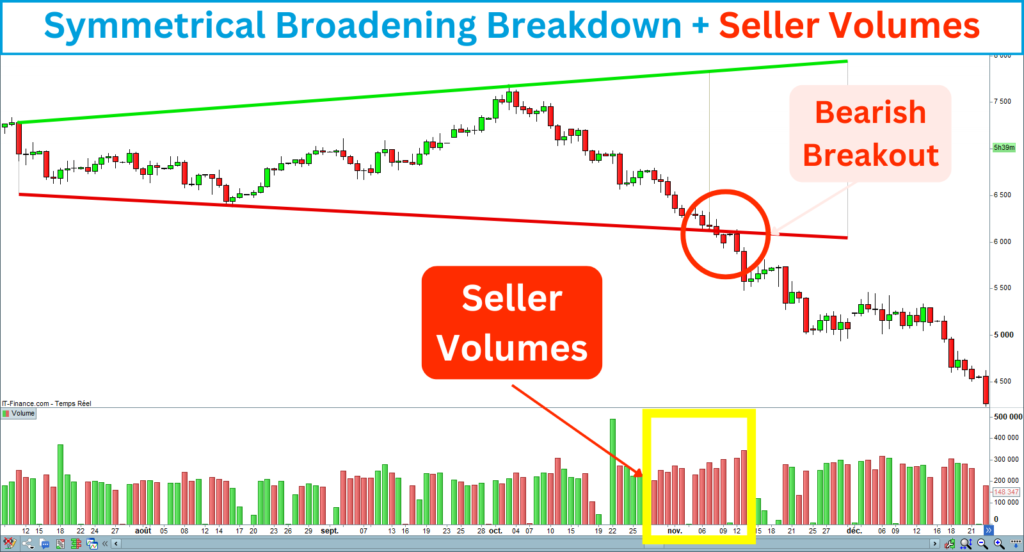
Seller volumes
The following chart shows seller volumes supporting a bearish breakout:
5. Confirm the signal with the market strength
Market strength corresponds to the ability of the market to maintain its trends over time. You can utilize many indicators to evaluate the market’s strength, such as RSI, ADX, OBV, MACD, Stochastic, etc. Ensure the market’s strength aligns with the signal. A positive strength must support buying signals, and a negative strength must support selling signals.
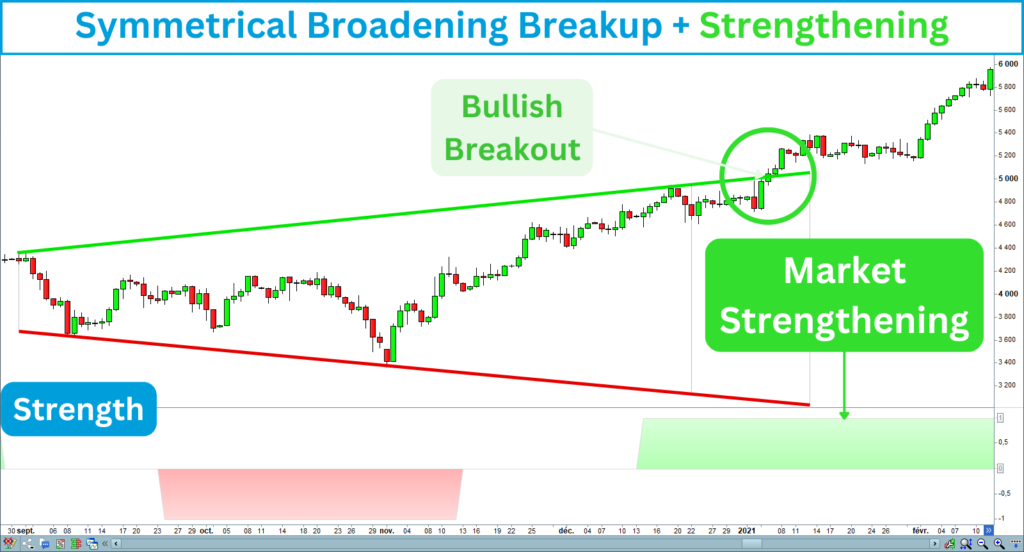
Breakup with positive strength
The following chart shows a bullish breakout supported by an increase in market strength:
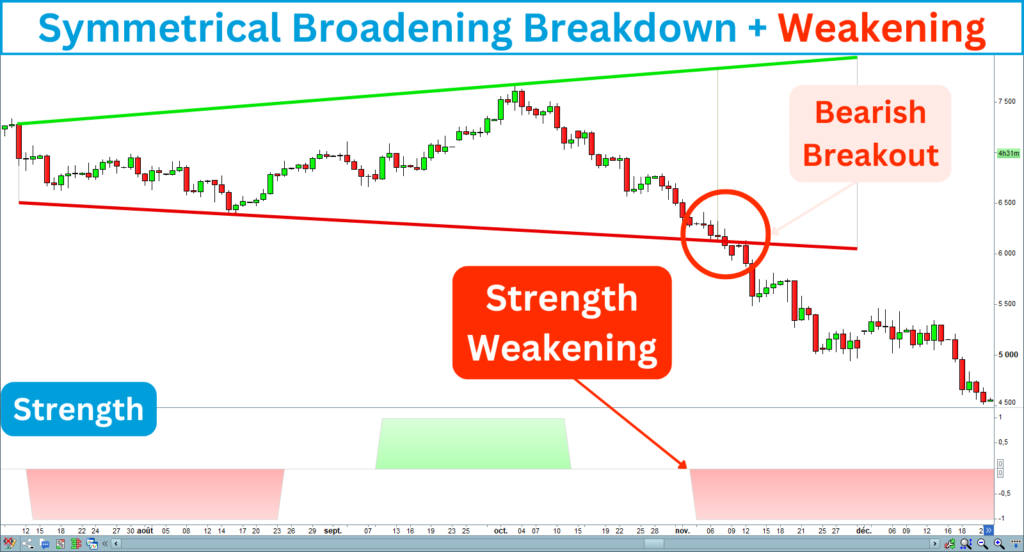
Breakdown with negative strength
The following chart shows a bearish breakout accompanied by a weakening of the market strength:
6. Enter the Trade
Once the breakout is validated and confirmed, enter the trade toward the breakout.
Exploit the trendline retests
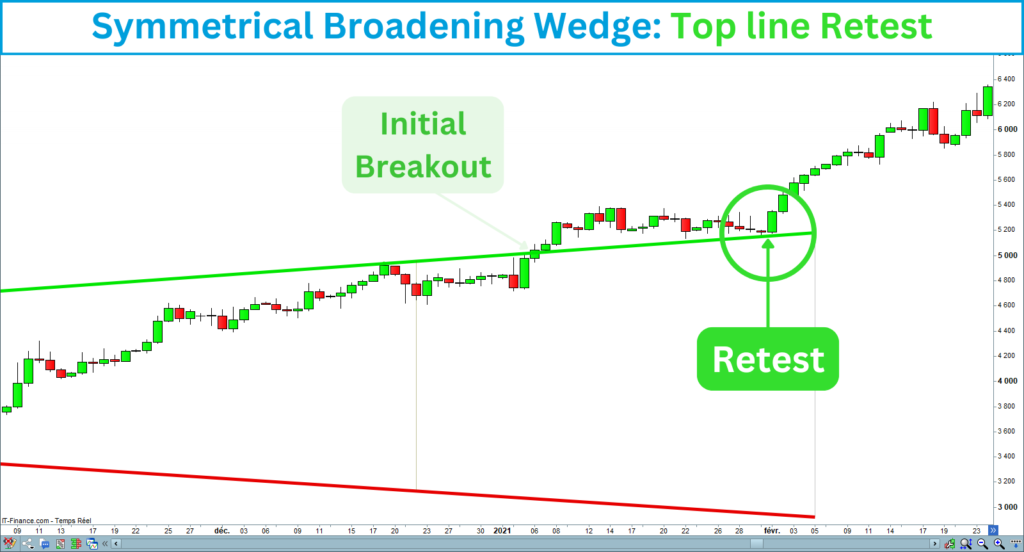
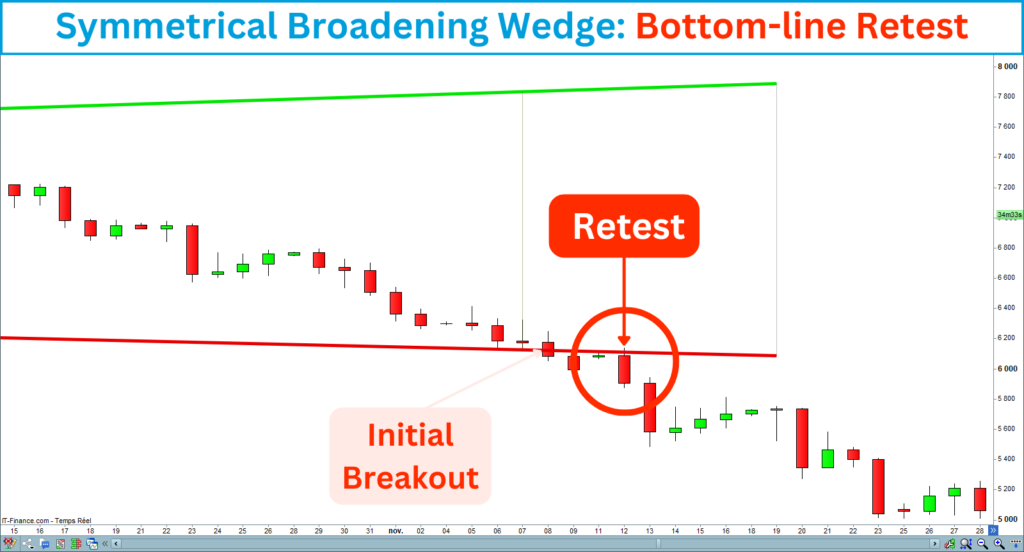
Sometimes, the price retests the trendline after the breakout. The signal is confirmed if the price holds the level and continues toward the breakout. The retest does not happen every time, but it allows you to reinforce your position or enter the trade if you have missed the initial breakout.
Buying the retest opportunity
The following chart shows a buying retest opportunity:
Shorting retest opportunity
The following chart shows a short-selling retest opportunity:
7. Protect your capital by setting a Stop-Loss
A stop-loss order will allow you to limit your potential losses. This instruction automatically closes your trade if the price touches the predetermined level. This will prevent significant losses if the market moves against your position.
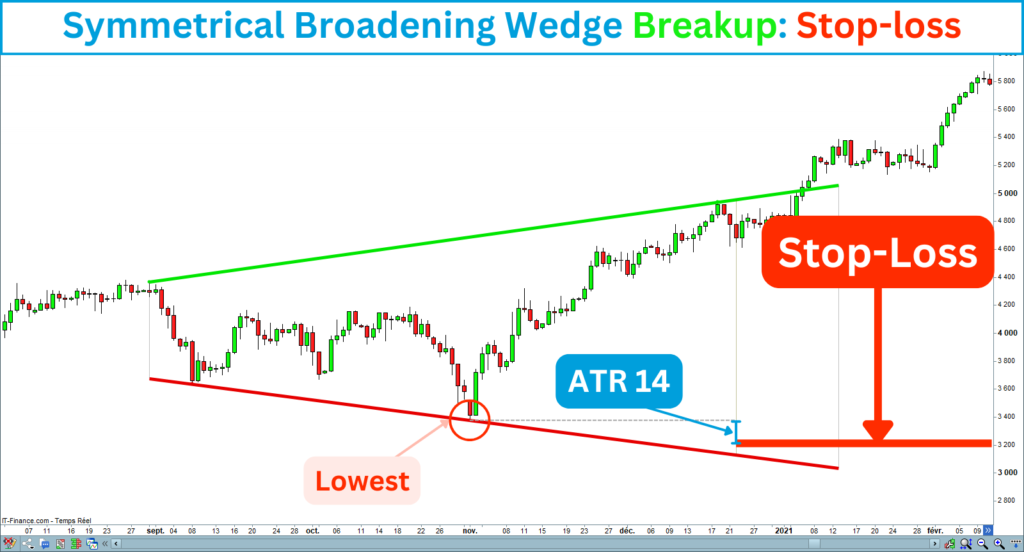
In principle, you should place the stop-loss on the opposite side of the wedge. The following charts show the stop-loss position for long and short entries:
Stop-Loss for long entries
Stop-Loss for short entries
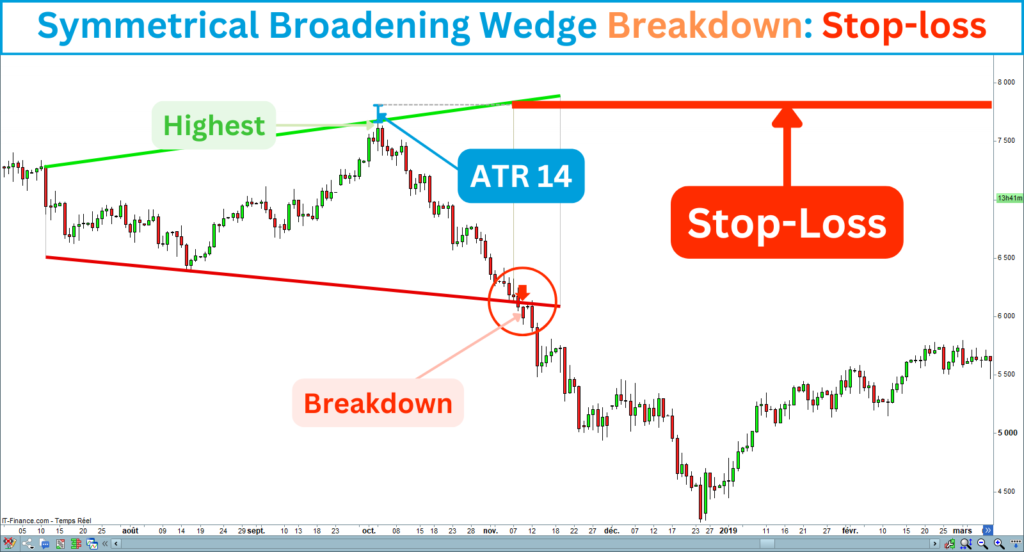
Be careful of the Risk/Reward ratio
As you know, a broadening wedge enlarges over time. If you set the stop-loss beyond the opposite breakout side, it could be placed too far. That could question the Risk/Reward ratio. That means the risk of loss could become greater than the expected gain. You can try to find an intermediate level to place the stop-losses.
First, look for a key level price inside the broadening wedge. Then, place the stop-loss at some points beyond this level. Habitually, I add an ATR 14 from a key level to set my stop-losses.
8. Take your profits by setting a Target
A profit target, also called “take-profit”, is an exit order allowing you to close your position at a predetermined price. It is helpful to concretize your latent profit. The market will not continue to rise indefinitely, so accurately setting your profit targets is essential.
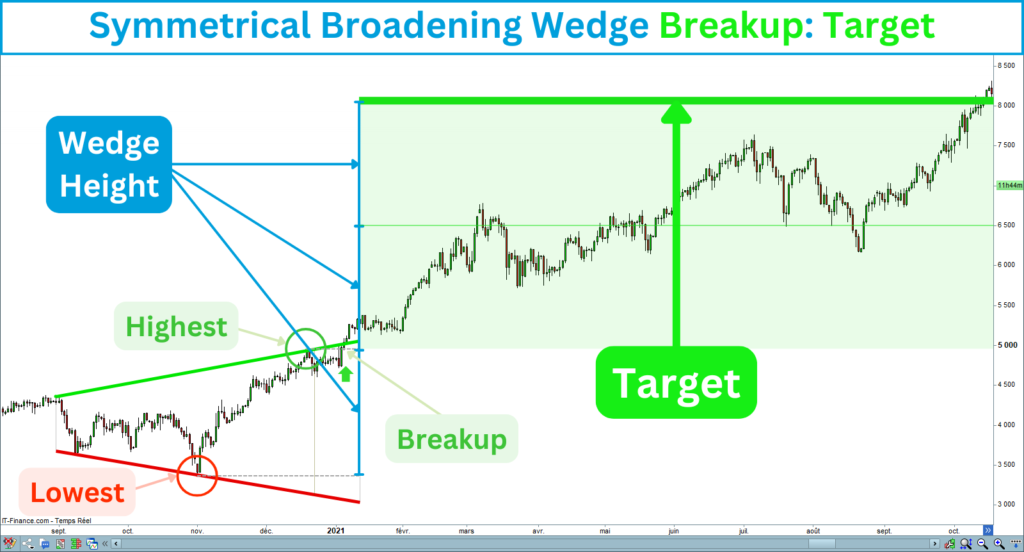
You can calculate the profit targets from the height of the wedge. If you have validated and confirmed the signals with the marker’s strength, you can easily target the wedge height two times.
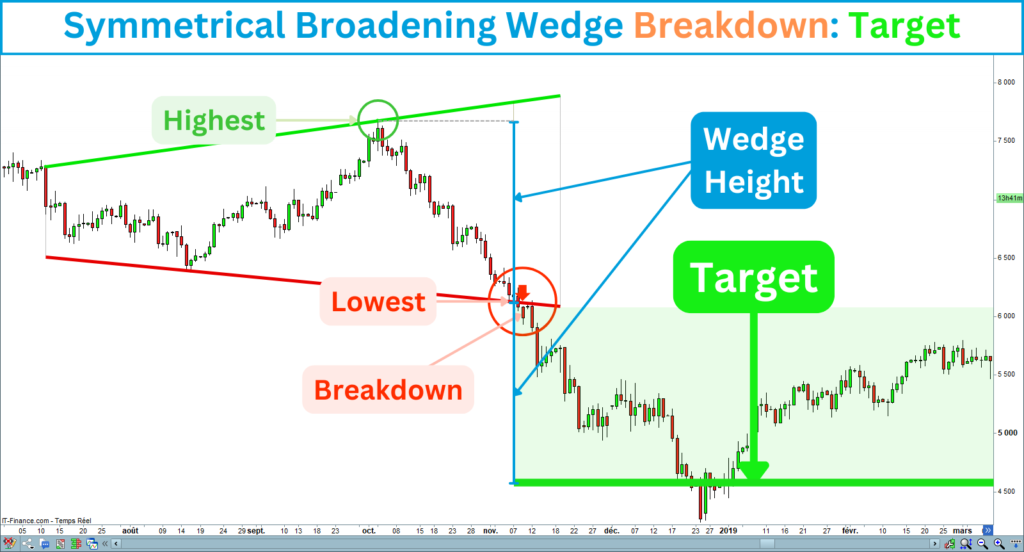
Many traders use the widest part of the wedge to evaluate its height, but I prefer to take the distance between its highest and lowest construction points. Then, I project the height one or two times from the last construction point to find the target level. The direction of the projection depends on the direction of your trade.
Target for long entries
Project the height upward from the last high point of the wedge to find the target for a long entry:
Target for short-sale entries
Project the height downward from the last low point of the wedge to find the target for a short entry:
Tips for Trading the Symmetrical Broadening Wedge Breakouts Successfully
Symmetrical Broadening Wedge Summary
The symmetrical broadening wedges will help you benefit from the increased volatility.
This pattern provides reliable bullish and bearish reversal signals.
Applying strength and volume filters will increase the success rate and expected gains.
Trading broadening wedges requires mastering signals and target positionings.
If you are interested in the symmetrical broadening wedge strategy, I created an indicator that recognizes this pattern. It draws trend lines, detects breakouts, displays the target and stop-loss, and allows for signal filtering.
The indicator is available on the marketplace of Prorealcode on this page:
https://market.prorealcode.com/product/ultimate-breaker
I wish you profitable trades 😊
Vivien