The root cause
There are many reasons why an automatic trading system did not open a position at the right time.

If the late is only on one or two candles, this is maybe the normal lag of your indicators. ProOrder can only open or close a position at the opening of the next candle. That means there is necessarily one candle late for each trade. Nonetheless, if a STOP, TARGET, or LIMIT order is touched, this order should be immediately completed.
However, if the late is over one or two candles, or if your automatic trading system sends bad orders, the most likely cause of a timing problem is a variable not reinitialized.
Find the root cause in source code thanks to GRAPH instruction
The best way to find the root cause of a variable or condition problem in the code source is to print their value evolution during the backtest. The GRAPH instruction allows you to print variables.
GRAPH myVariable AS "myVariableName"
How to use GRAPH instruction effectively?
When you find a problem, thanks to GRAPH instruction, the most important consists of setting it at the right place in the source code. You should place GRAPH instruction from the « IF NOT LongOnMarket » block. (if your automatic system is short, you should set GRAPH instruction out of « IF NOT ShortOnMarket ») In this way, more information about your variable will appear.
Print several variables thanks to GRAPH
Thanks to GRAPH, it’s possible to print as many variables as you want; however, visibility could become difficult. It is, therefore, at your disposal the possibility to color variables while printing.
GRAPH myVariable1 coloured(255, 0, 0) AS "myVariableName1"
GRAPH myVariable2 coloured(0, 255, 0) AS "myVariableName2"
GRAPH myVariable3 coloured(0, 0, 255) AS "myVariableName3"
Print variables on the price chart
You can enhance the visibility by printing a variable directly on the price chart. That is very convenient to see when your buying and selling orders are positioned and see the STOP, TARGET, and LIMIT order evolution. To do that, please use GRAPHONPRICE instruction in this way:
GRAPHONPRICE buyingLimitVariable AS "buy order price"
The GRAPHONPRICE instruction accepts colored variables as GRAPH instruction.
graphonprice stopOrderPrice coloured(255, 0, 0) as "STOP"
graphonprice targetOrderPrice coloured(0, 255, 0) as "TARGET"
credit image: https://www.maxpixel.net/Blue-Clock-Time-Way-Of-Thinking-Gears-Face-Gear-64264
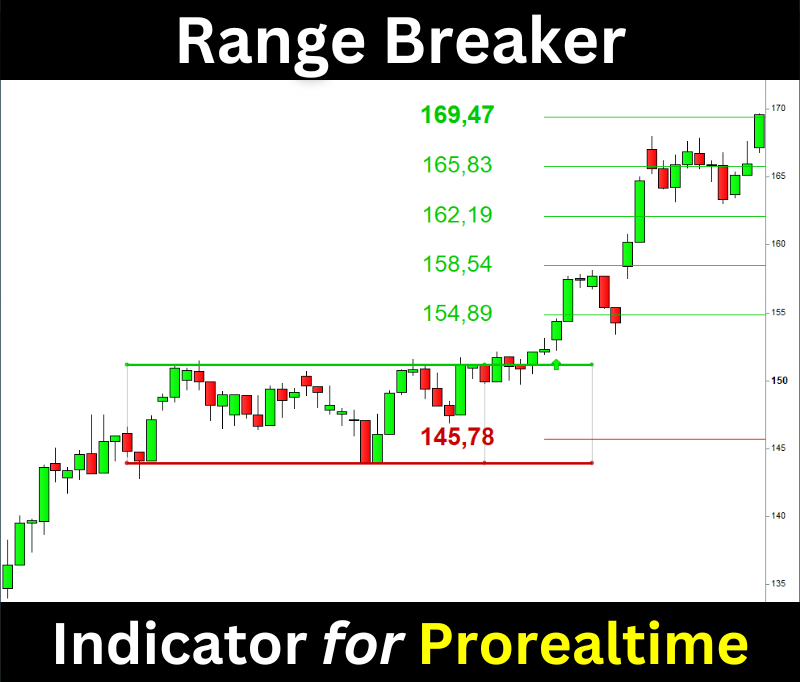
Range Breakout Indicator for Prorealtime

The Range Breaker will help you trade the Range Breakouts on Prorealtime. It displays the ranges, breakout signals, and target prices on your chart.


