Take advantage of the downtrend restarting
Betting on the bear market can be profitable, but it requires mastery of risk and signals. The rising wedge will help you profit from the downtrend restarting. This chart pattern reveals weakening momentum that may lead to a sharp price downturn.
In this post, I will show you how to trade the rising wedge breakdown. You will learn to recognize this pattern, detect the selling signal, and place the target and stoploss.
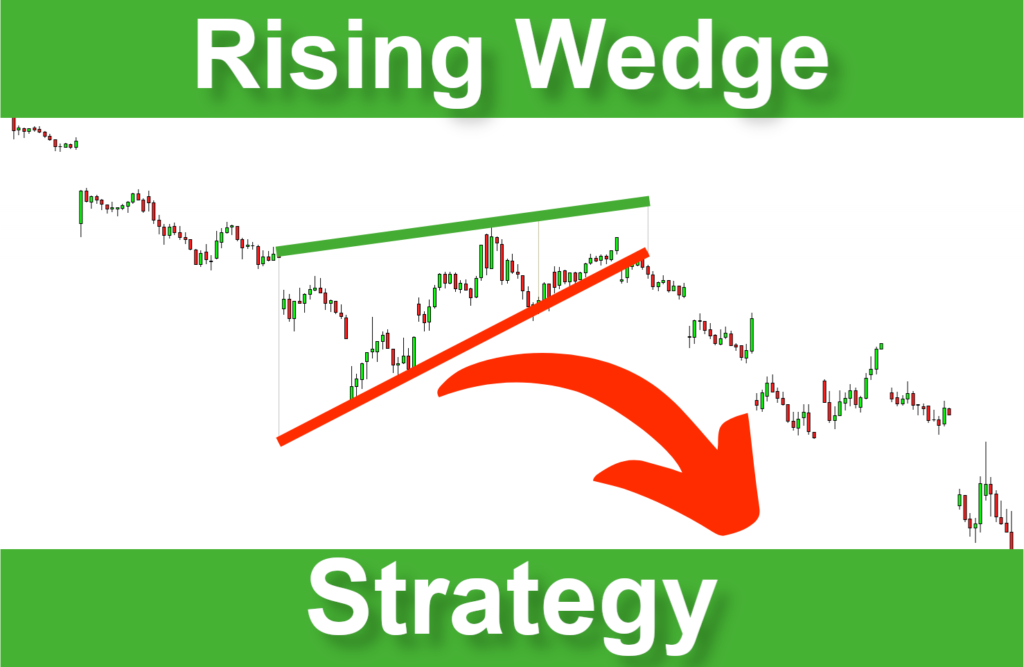
What is a Rising Wedge?
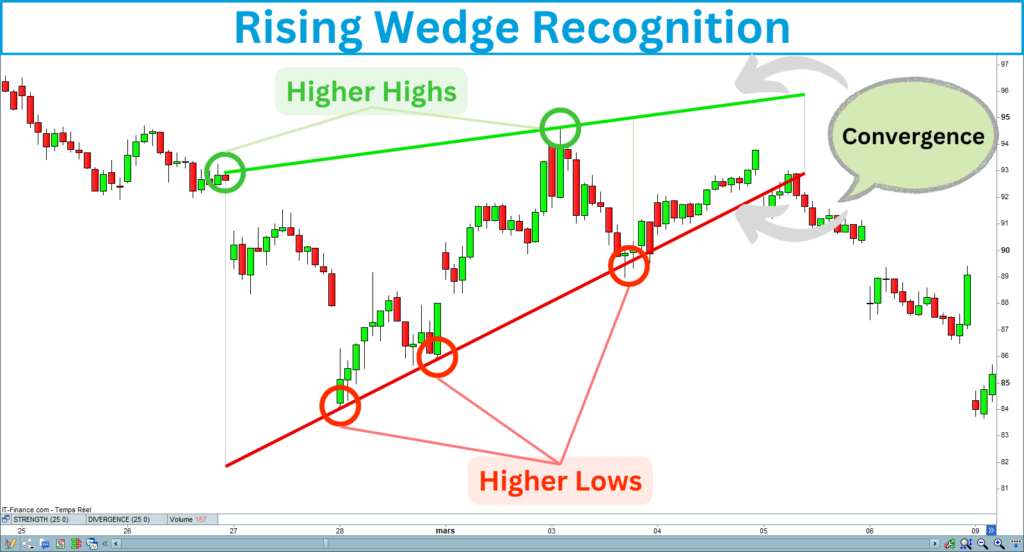
A rising wedge is a bearish reversal pattern that forms after an uptrend. It is characterized by two converging trendlines that both slope upwards. The upper trendline connects a series of higher highs, while the lower trendline connects a series of higher lows. Despite the upward movement in price, the narrowing of the wedge indicates that the bullish momentum is waning, setting the stage for a potential breakout to the downside.
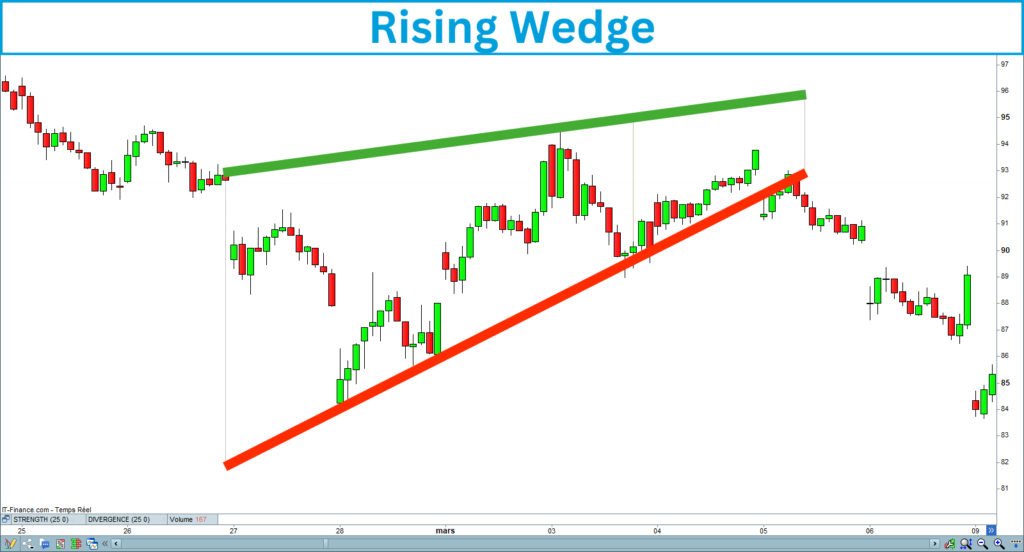
How to Identify a Rising Wedge
Rising Wedge properties
Before diving into the strategy, correctly identifying a rising wedge on the chart is indispensable. Here are the key characteristics of this pattern, which must be satisfied:
The following chart shows a rising wedge meeting the previous criteria:
Rising Wedge inclination
As the ascending channel, the rising wedge is a bullish pattern indicating a bullish bias. The particularity of this pattern is that its bullish bias is more accentuated. That is why the rising wedges are a little more risky than the ascending channels. In return, they give buying signals before the ascending channels, increasing the expected gain.
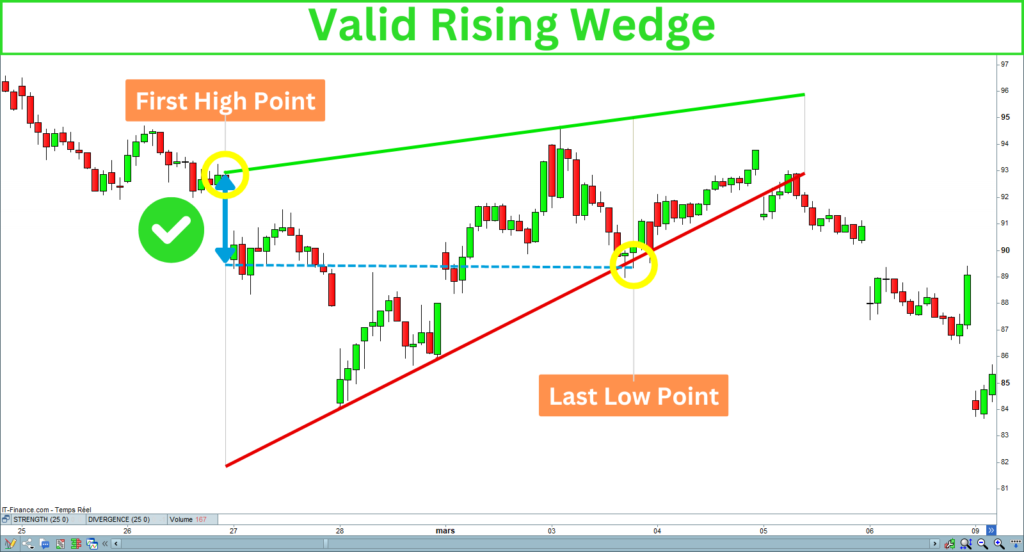
Selling a bull market, hoping for a reversal, would be dangerous. You must validate the properties of the wedge before opening a short entry. The wedge line’s slope should not be too steep. You can verify that the last low point is lower than the first highest.
The last low is lower than the first high point of the rising wedge, meaning the wedge is not too ascending:
Rising Wedge Breakout
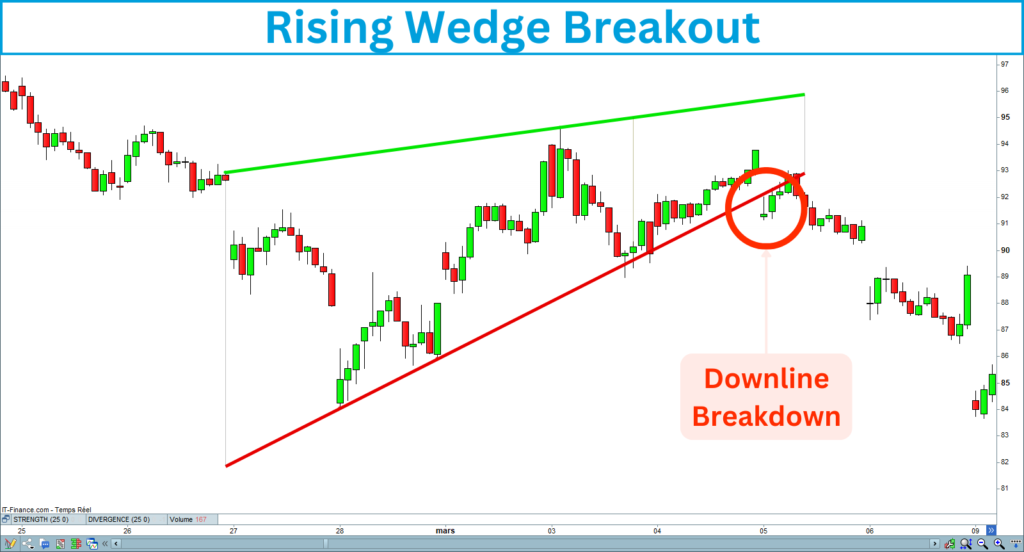
The rising wedge works like an ascending channel. The breakout occurs when the price breaks down the wedge’s bottom line. It is a bearish signal indicating a potential trend reversal.
The following chart shows the topline breakdown of a rising wedge:
Seven steps to trade the Rising Wedge Breakout
Trading the rising wedge breakout strategy involves entering a position when the price breaks below the lower trendline. Here are the seven steps to trade the rising wedge correctly:
1. Draw the Trendlines
Draw the upper trendline by connecting the higher highs, and the bottom trendline by connecting the higher lows. These trendlines should converge as the pattern develops.

2. Check the Trend
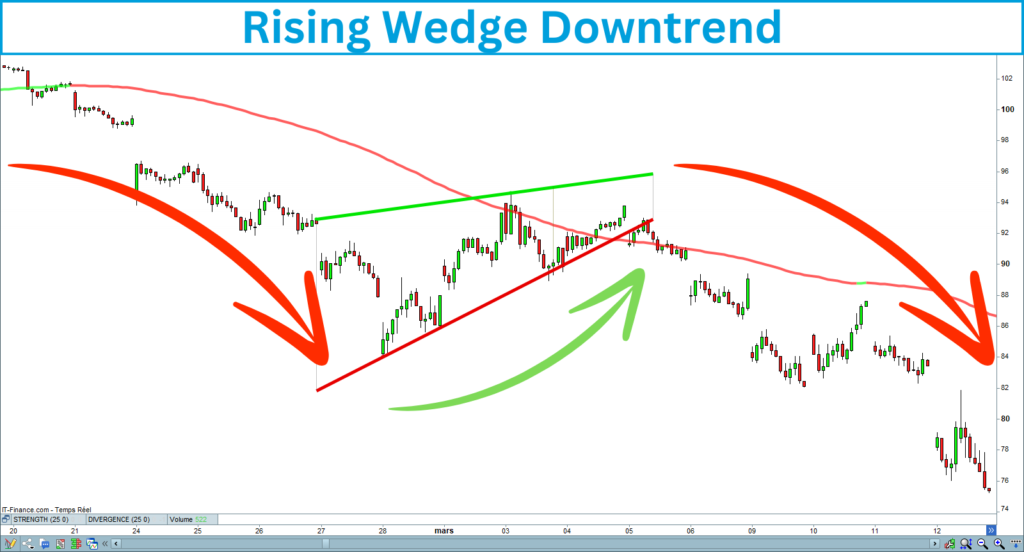
The rising wedge has a strong short-term bullish bias. It is crucial to verify that it occurs in a bearish trend. You can measure the trend using a moving average or a linear regression. Setting the trend indicator length to two times the wedge length is preferable.
2. Check a Divergence
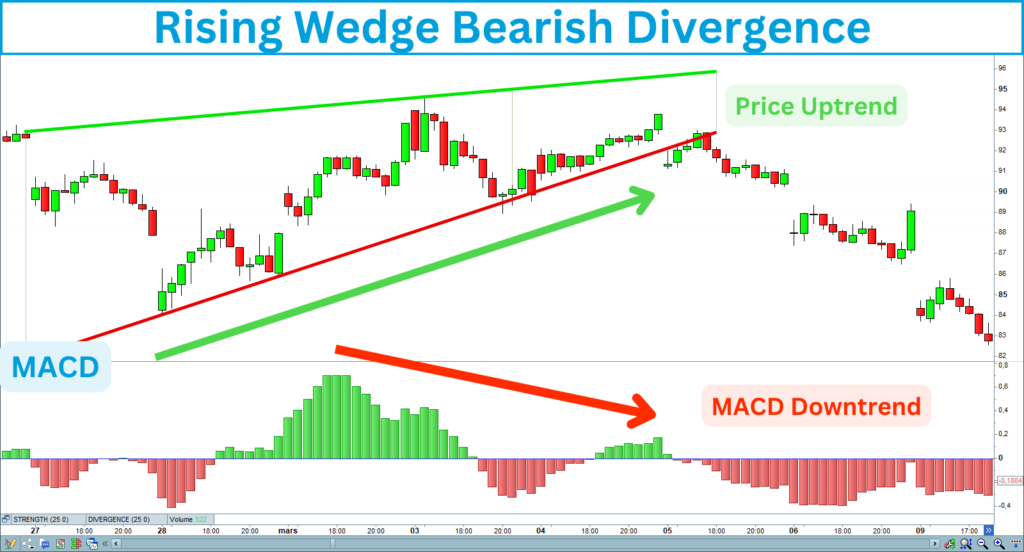
A divergence happens when a strength indicator contradicts the trend. Since the rising wedge has a middle-term uptrend, it is essential to ensure a bearish divergence occurs at the end of the figure or during the breakdown signal. That will allow you to eliminate false signals.
You can use many strength indicators to detect a divergence, such as RSI, MACD, or Stochastic. The following chart shows a bearish divergence between the MACD and the mid-term trend:
3. Watch for a Breakdown
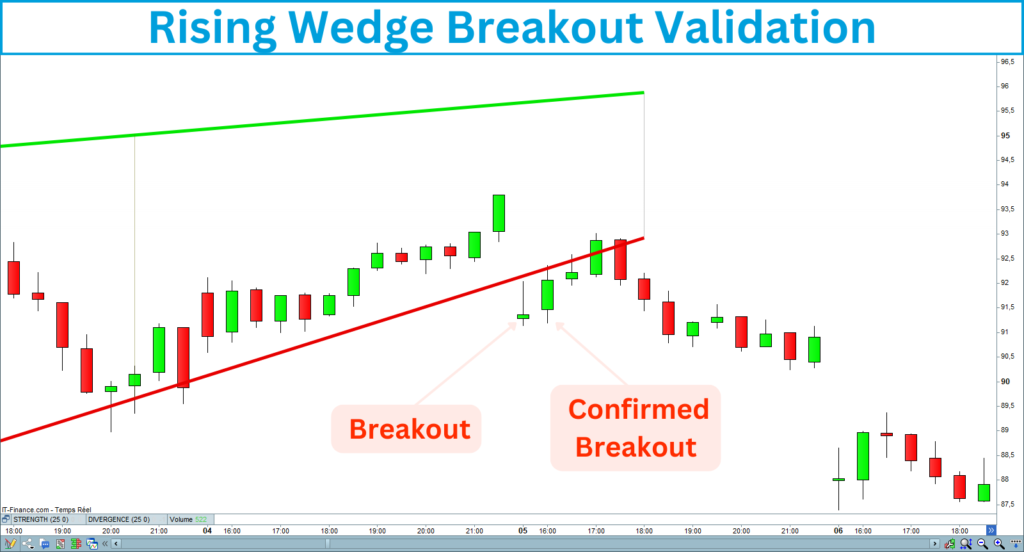
The pattern is complete when the price breaks below the lower trendline, with increasing volume, signaling a potential bearish reversal. The breakdown typically occurs when the price falls below the lower trendline, indicating the possible start of a downtrend.

4. Confirm the Breakdown
Wait for a confirmed breakdown of the bottom line. A breakout is validated when the candle following the breakout closes under the broken line. Ideally, this breakdown should be accompanied by an increase in volume, confirming that the sellers are taking control.
5. Enter the Trade
Once the breakdown is confirmed, enter a short position. If you trade large indexes such as the S&P 500, the Nasdaq, or the Dow Jones, you can place an order at the market price, guaranteeing its execution. If you operate in a thick market, such as with illiquid stocks, you should use a limit or stop order. These types of orders allow you to control the price execution.
What is the difference between a limit and a stop order?
- A sell limit order will be executed only at the limit price or a higher one.
- A sell stop order will be executed only at the stop price or a lower one.
You can place a sell limit order above the current price and gradually decrease the order price until it is executed. In this way, you will be assured that your order is executed by mastering the entered price.
Multiple trade entries
Bear markets are often very volatile, making it challenging to build a position. However, you can fractionate your entry into several trades. You could sell the breakout, its confirmation, the retest, and the retest confirmation.
6. Set a Stop-Loss
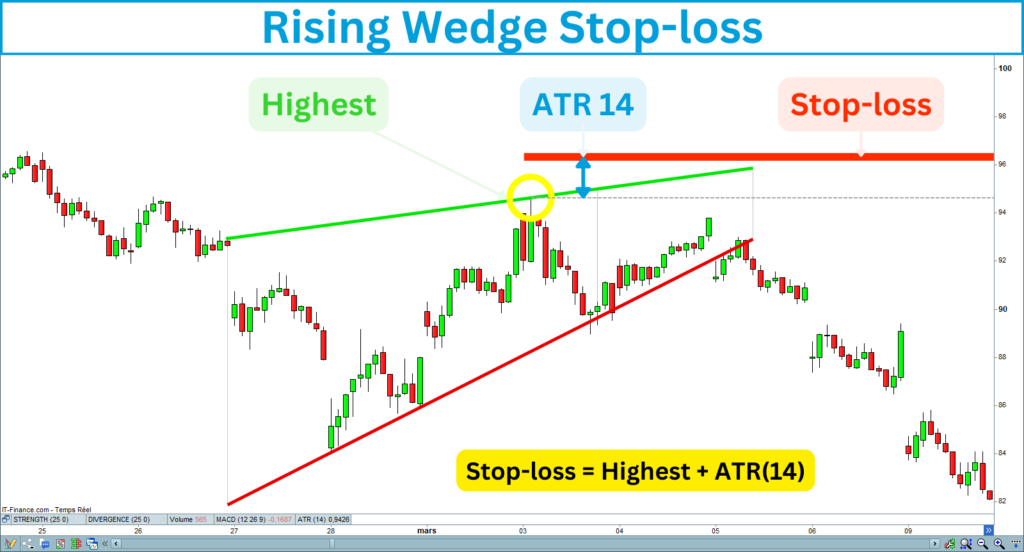
We can never be sure that things will go well when we enter a trade. To manage risk, place a stop-loss order above the highest candle of the wedge. This will protect your trade if the breakdown fails and the price reverses.
The following chart shows you where to place the stop-loss after the breakdown of a rising wedge:
7. Determine the Target
It is essential to determine the target price before entering the market. That will allow you to evaluate your risk-reward regarding your stop-loss position.
How to determine the rising wedge target?
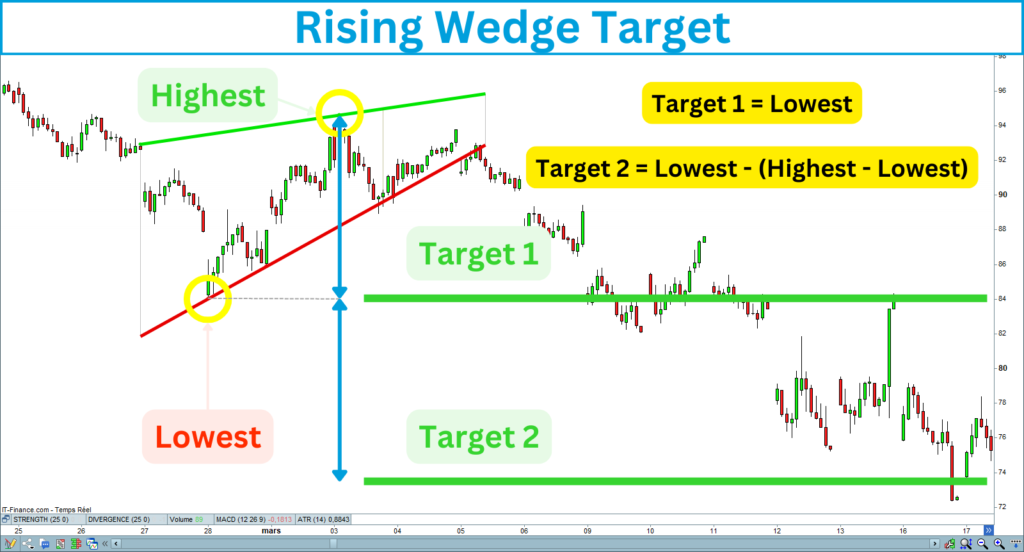
In principle, the target price for a figure is typically its height, corresponding to the distance between the upper and lower trendlines at the widest point. In fact, each figure has its own specificities, and each trading configuration is unique. I often noted that the lowest point of rising figures plays a crucial role in defining the target.
Set several target prices
It would be a good idea to set two targets: one at the lowest point and another by reporting the distance between the figure’s high and low points.
The following chart shows the positioning of the two targets for the rising wedge figure:
Tips to Improve your Rising Wedge Trading
Here are some tips to help you better trade the rising wedge breakout and improve your performance.
Rising Wedge Summary
The rising wedge breakouts will help you take advantage of the downtrend restarting.
It is crucial to validate the selling signal with strength indicators.
The position of your target and stop-loss will determine the profitability of your trades.
The bear market volatility requires you to monitor your position daily.
If you are interested in this strategy, I created an indicator that recognizes rising wedges. It draws the figure lines, detects breakouts, and displays the target and stop-loss on the chart.
This indicator is available on the marketplace of Prorealcode:
https://market.prorealcode.com/product/ultimate-breaker
I wish you good trades 😊


