Finding a reliable indicator to follow the trend is challenging. Numerous of them give the trend but not signals. If you know Prorealtime, you have undoubtedly heard about the PRT Bands indicator. Natively implemented in the platform, it has been specially developed to follow the trend.
In this post, I will show you how to use the PRT Bands indicator. I will backtest several trading strategies you can use in your trading.
What is PRT Bands?
PRT Bands is a visual indicator that simplifies the detection and follow-up of bullish markets. It is only available from the ProRealTime platform. PRT Bands may help you identify trend reversals, follow rising trends, measure the intensity of a trend, and find potential entry and exit points. This indicator is initially designed for stocks with high bullish potential, but it is also perfectly applicable to indexes like the Nasdaq.
How does the PRT Bands indicator work?
The PRT Bands indicator includes a set of four technical indicators. They will allow you to open long entries on any asset and time unit.
Here are the four PRT Bands indicators:
PRTBandsUp
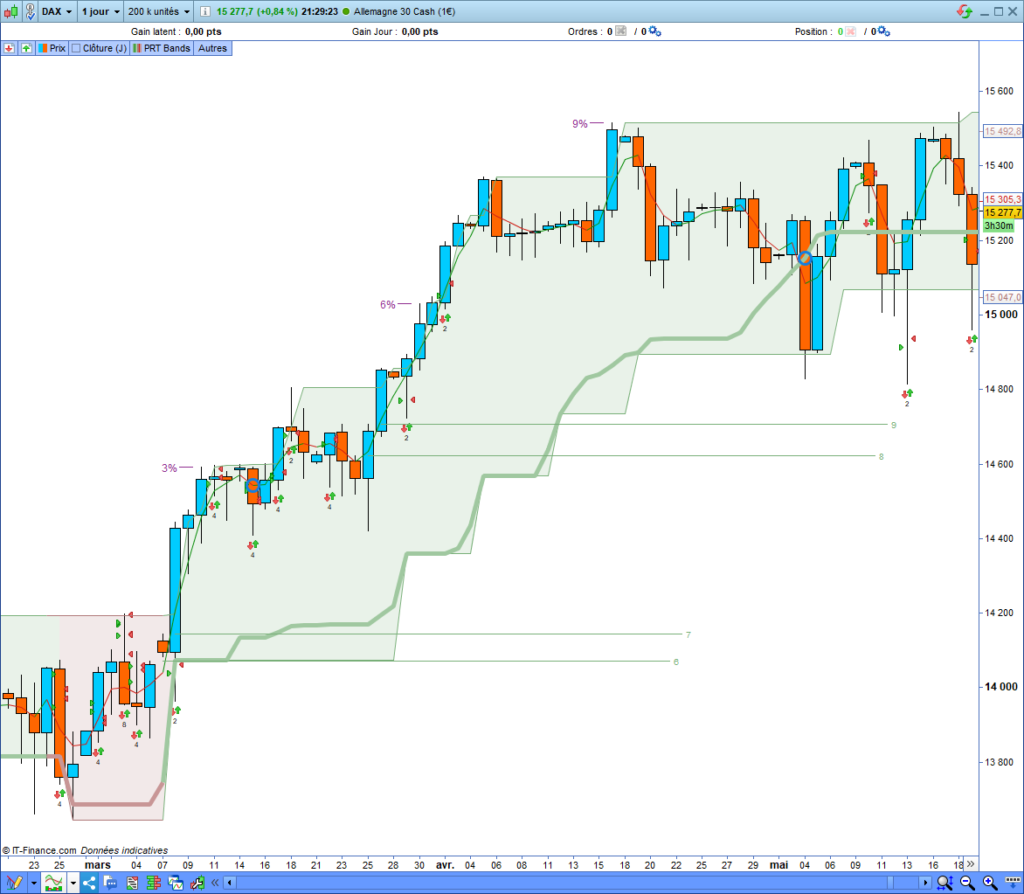
The PRTBandsUp indicator returns the high band value. It works like a resistance:

PRTBandsDown
The PRTBandsDown indicator returns the low band value. It works like a support:
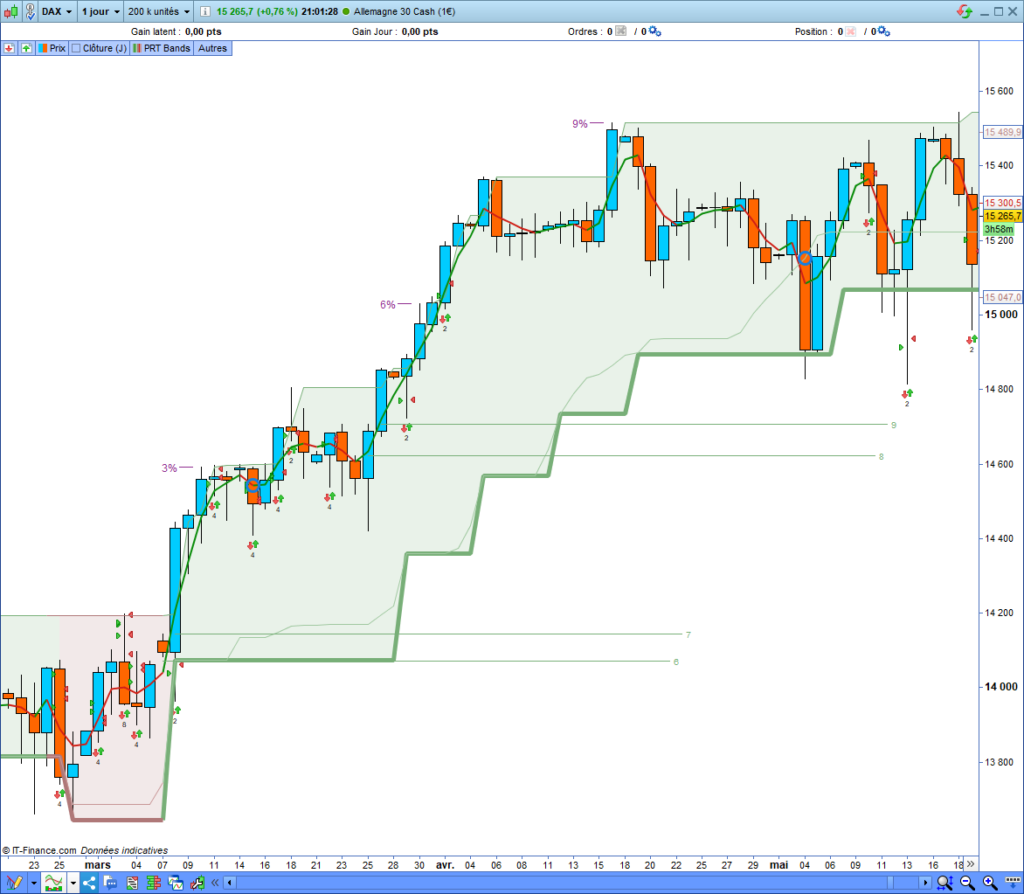
PRTBandsmediumterm
The PRTBandsmediumterm indicator returns the middle-term line. It indicates the middle-term trend:
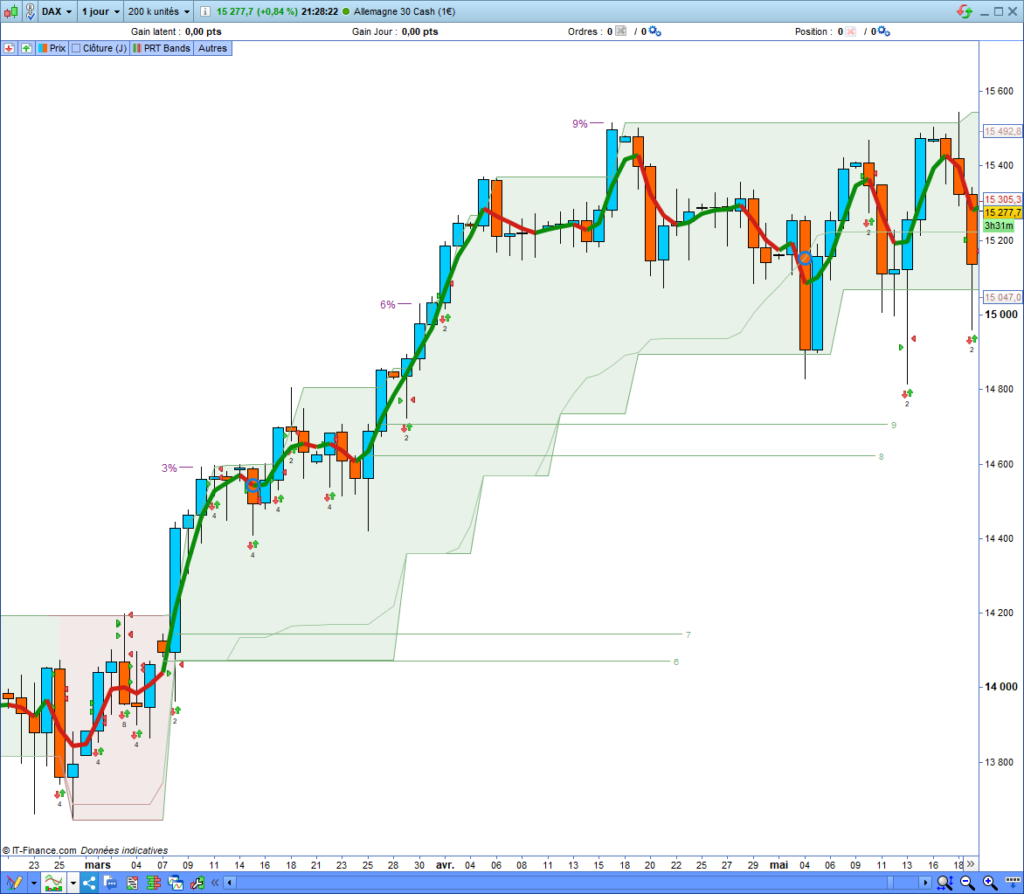
PRTBandsShortTerm
The PRTBandsShortTerm indicator returns the short-term line. It indicates the short-term trend:
The PRT Bands’ signals
The PRT Bands indicator can help you detect buying signals in the market and provides several possibilities for opening a position: starting the trend, trend continuation, and trend reversal.
You can build three types of buying signals: band breakout, line crossing, and line reversal. I will present to you the following four signals:
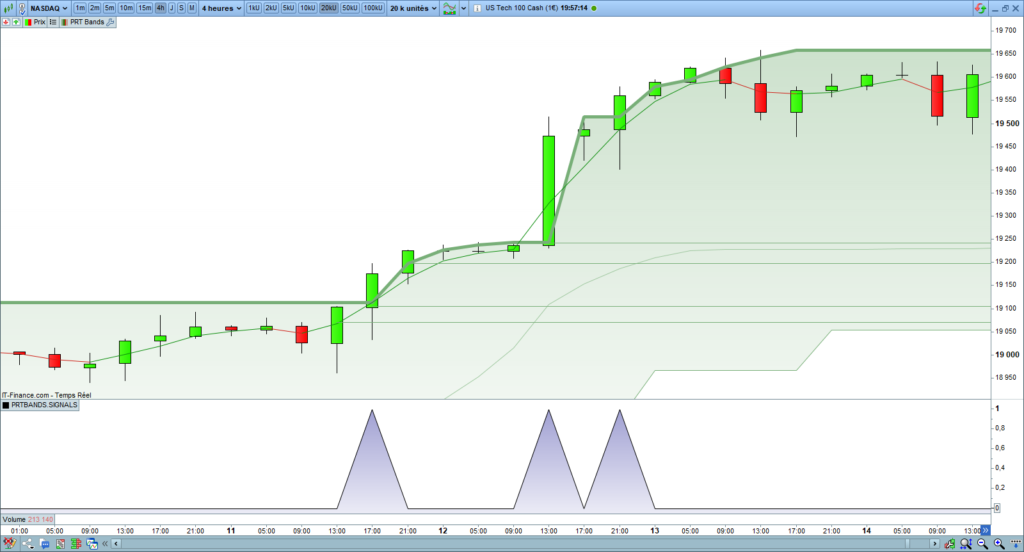
1. High band breakout
The high band of PRT Bands works like a resistance. You can consider it as a key level in a breakout strategy. The following code will detect the breakouts of the high band. You can run it in the Probacktest editor of the Prorealtime platform:
TopPRTBandBreakout = close CROSSES OVER PRTBandsUp

RETURN TopPRTBandBreakout
Here is an example of a high-band breakout of the PRT Bands indicator:
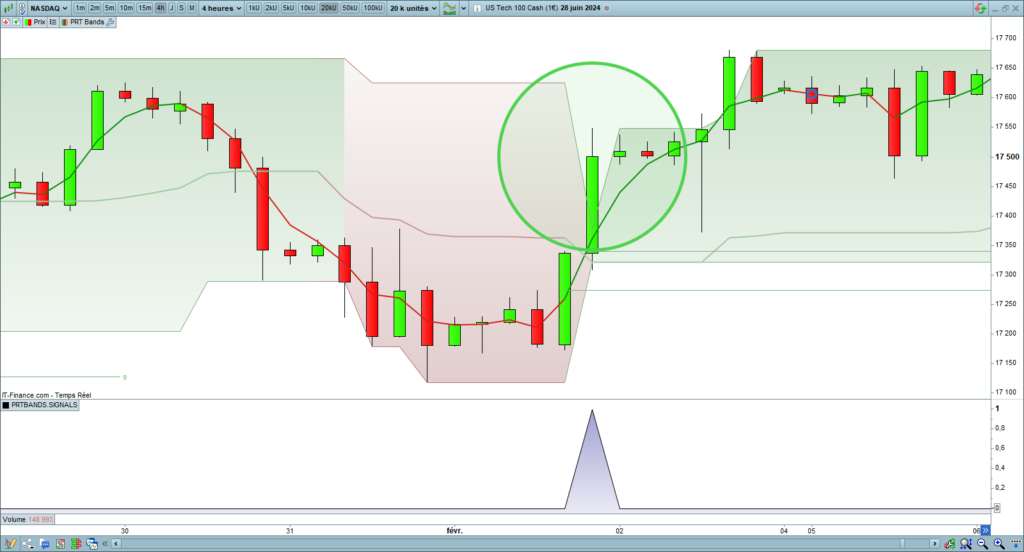
2. Descending channel breakup
The PRT Bands indicator enables the detection of the uptrend beginning. A bull trend begins when the price breaks the high band of a descending channel. Here is the code for detecting the start of an uptrend. It checks the breakout of the high band and the channel’s bearish trend:
LongCrossingCondition = close CROSSES OVER PRTBandsUp
BearishCanal = PRTBandsDown[1] < PRTBandsDown[0]

TopBandBreakout = LongCrossingCondition AND BearishCanal
Here is an example of an entry opening of a new uptrend beginning:
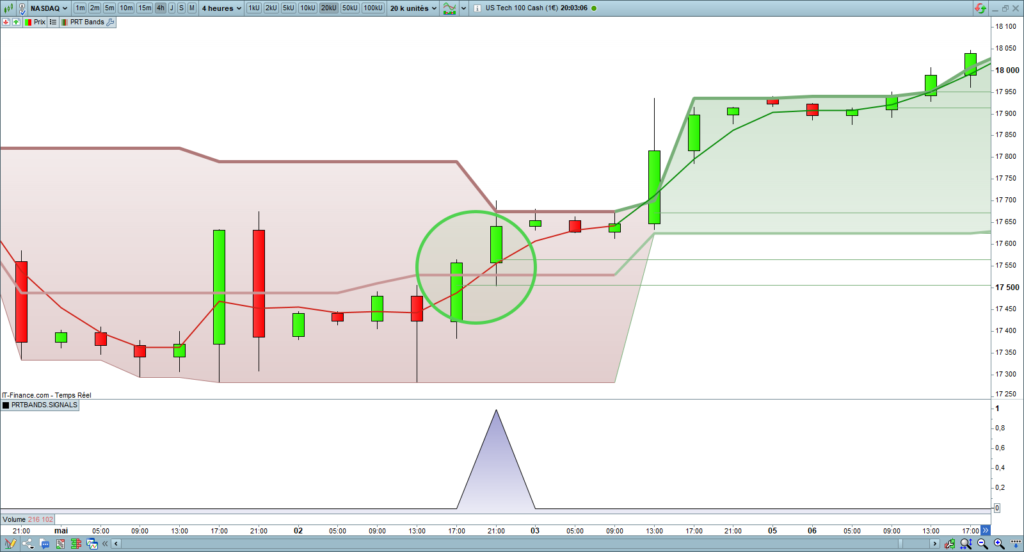
3. Trend lines crossing
The short and middle trend lines of PRT Bands work like moving averages. You can use their crossing as a buying signal. The following code detects the overcrossing of the middle trend line by the short trend line of the PRT Bands indicator:
PRTBandsCrossingLines = PRTBandsShortTerm CROSSES OVER PRTBandsMediumTerm

RETURN PRTBandsCrossingLines
Here is an example of an overcrossing of the middle-term line by the short-term line of the PRT Bands indicator:
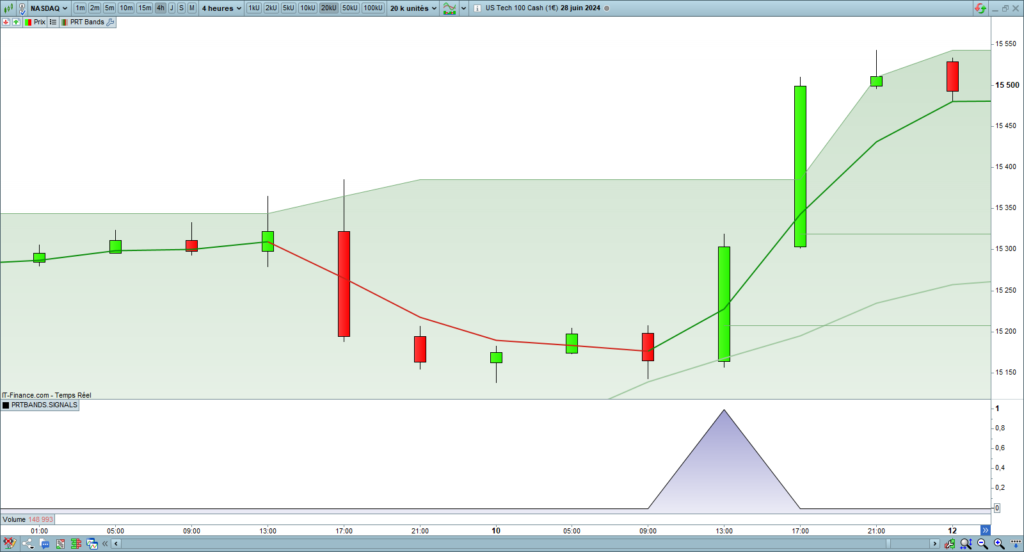
4. Bullish trend restarting
The short trend line obtained by the PRTBandsShortTerm instruction follows the price movement to reduce the noise. Sometimes, price consolidations occur during a bullish trend. A bullish channel with a bearish short trend line will express this case. A short-term line becoming positive would indicate the restarting of the uptrend.
The following code will detect the restarting of the uptrend:
ShortTermRestarting = PRTBandsShortTerm[2] > PRTBandsShortTerm[1] AND PRTBandsShortTerm[1] < PRTBandsShortTerm[0]

RETURN ShortTermRestarting
Here is an example of a restarting uptrend entry given by the short-term line:
Backtests of PRT Bands strategies
Now, I will show you how to use the PRT Bands indicator to build trading strategies and present four backtests:
- Uptrend continuation strategy
- Bullish trend reversal strategy
- Trend lines crossing strategy
- Uptrend restarting strategy
A. Uptrend continuation strategy
The bullish breakouts of the high bands allow for buying the market. This strategy will help you benefit from the continuation of the uptrend.
Code of the backtest
The following code will open a long position each time the price breaks up the high band of the PRT Bands indicator:
// * PRT Bands Uptrend continuation strategy * //
// Risk Management
capital = 10000
numberOfContracts = ROUND(capital/close, 2)
targetPercent = 5
stoplossPercent = 2

// PRT Bands long Signal
TopPRTBandBreakout = close CROSSES OVER PRTBandsUp

// Long entry opening condition
IF NOT LongOnMarket AND TopPRTBandBreakout THEN
  BUY numberOfContracts CONTRACTS AT MARKET
  SET TARGET %PROFIT targetPercent
  SET STOP %LOSS stoplossPercent
ENDIF
Result of the backtest
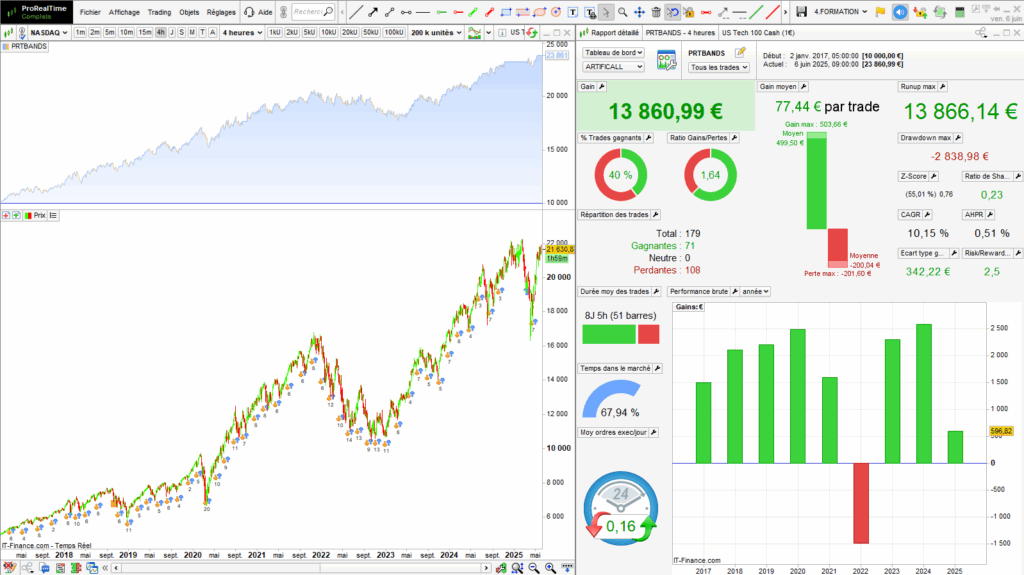
Here is the result of this trend continuation strategy using PRT Bands applied to the Nasdaq in the 4-hour time frame. The return of the strategy is positive, but the success rate is low at 40%, and the 2022 drawdown is relatively deep:
Detailed report
You can download the detailed report to obtain more information about the position price, size, and the transaction date:
Strategy enhancement
The breakout of a resistance is a good buying signal. However, it is essential to see volume increase. That means numerous traders share the same point of view. You can use the following instructions to filter the breakouts with volume increase:
volumeIncreases = LinearRegressionSlope[20](Volume) > 0The following code will detect the high band breakup, associated with volume increase:
// * PRT Bands Uptrend continuation strategy with Volumes * //
// Risk Management
capital = 10000
numberOfContracts = ROUND(capital/close, 2)
targetPercent = 5
stoplossPercent = 2

// PRT Bands long Signal
TopPRTBandBreakout = close CROSSES OVER PRTBandsUp

volumeIncreases = LinearRegressionSlope[20](Volume) > 0

// Long entry opening condition
IF NOT LongOnMarket AND TopPRTBandBreakout AND volumeIncreases THEN
  BUY numberOfContracts CONTRACTS AT MARKET
  SET TARGET %PROFIT targetPercent
  SET STOP %LOSS stoplossPercent
ENDIF
Result of the optimized backtest
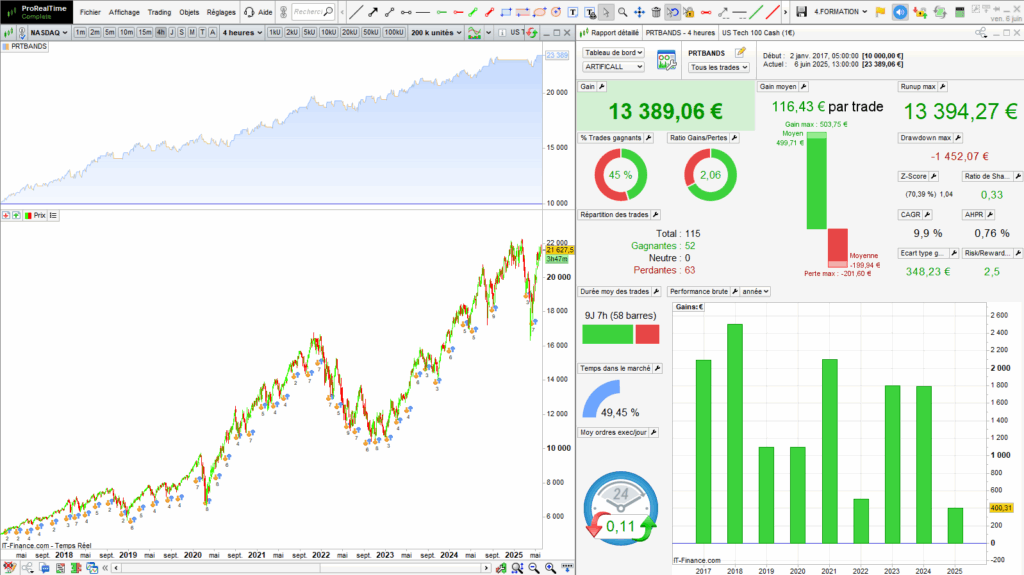
The return is slightly lower than previously, but the success rate has increased to 45%, and the drawdown is significantly lower than before. Besides, the Profit/Loss ratio is clearly more advantageous:
Detailed report
You can download the detailed report to obtain more information about the position price, size, and the transaction date:
B. Bullish reversal strategy
The PRT Bands indicator can detect bullish trend reversals. The buying signal is given when the price breaks the top band of the bearish channel.
Code of the backtest
The following code will open long entries at the beginning of a new uptrend:
// * PRT Bands Bullish reversal strategy * //
// Risk Management
capital = 10000
numberOfContracts = ROUND(capital/close, 2)
targetPercent = 5
stoplossPercent = 2

// PRT Bands long Signal
BearishCanal = PRTBandsDown[1] < PRTBandsDown[0]
TopPRTBandBreakout = close CROSSES OVER PRTBandsUp

StartingTrend = BearishCanal AND TopPRTBandBreakout

// Long entry opening condition
IF NOT LongOnMarket AND StartingTrend THEN
  BUY numberOfContracts CONTRACTS AT MARKET
  SET TARGET %PROFIT targetPercent
  SET STOP %LOSS stoplossPercent
ENDIF
Result of the backtest
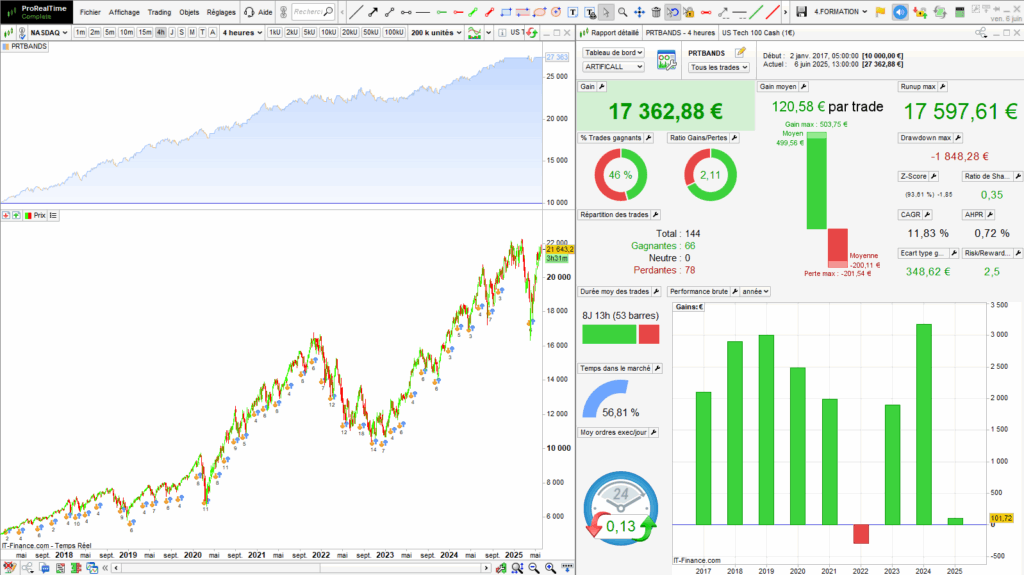
Here is the result of the backtest run on the Nasdaq in the 4-hour time unit. The strategy yields a profit of € 17,362. This is the most profitable approach we can take with the PRT Bands indicator. However, it has a low success rate of 46%:
Detailed report
You can download the detailed report to obtain more information about the position price, size, and the transaction date:
Strategy enhancement
As this strategy is a breakout type, we can apply a volume increase filter to improve the performance. The following code will detect breakups of the top band associated with a volume increase:
// * PRT Bands Bullish trend reversal strategy with Volumes* //
// Risk Management
capital = 10000
numberOfContracts = ROUND(capital/close, 2)
targetPercent = 5
stoplossPercent = 2

// PRT Bands long Signal
BearishCanal = PRTBandsDown[1] < PRTBandsDown[0]
TopPRTBandBreakout = close CROSSES OVER PRTBandsUp

StartingTrend = BearishCanal AND TopPRTBandBreakout

volumeIncreases = LinearRegressionSlope[20](Volume) > 0

// Long entry opening condition
IF NOT LongOnMarket AND StartingTrend AND volumeIncreases THEN
  BUY numberOfContracts CONTRACTS AT MARKET
  SET TARGET %PROFIT targetPercent
  SET STOP %LOSS stoplossPercent
ENDIF
Result of the optimized backtest
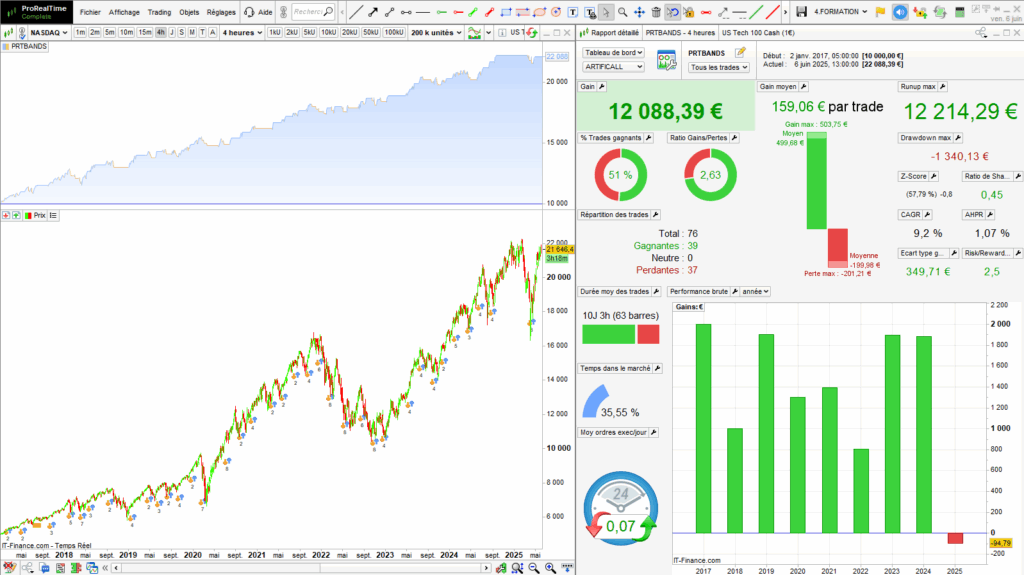
The profit of the optimized version decreased from €17,000 to €12,000, but the success rate increased to 51%. Additionally, the number of entries is half of what it was previously, and the drawdown is significantly reduced. The optimized backtest is less profitable but more robust:
Detailed report
You can download the detailed report to obtain more information about the position price, size, and the transaction date:
C. Trend lines crossing strategy
The PRT Bands indicator provides two trend lines: a short-term and a medium-term line. A buying signal occurs when the short-term line crosses over the medium-term line. This strategy works similarly to a moving average crossover.
Code of the backtest
The following code will open long entries after the short-term line crosses over the middle-term line of the PRT Bands indicator:
// * PRT Bands Trend lines crossing strategy * //
// Risk Management
capital = 10000
numberOfContracts = ROUND(capital/close, 2)
targetPercent = 5
stoplossPercent = 2

// PRT Bands long Signal
PRTBandsCrossingLines = PRTBandsShortTerm CROSSES OVER PRTBandsMediumTerm

// Long entry opening condition
IF NOT LongOnMarket AND PRTBandsCrossingLines THEN
  BUY numberOfContracts CONTRACTS AT MARKET
  SET TARGET %PROFIT targetPercent
  SET STOP %LOSS stoplossPercent
ENDIF
Result of the backtest
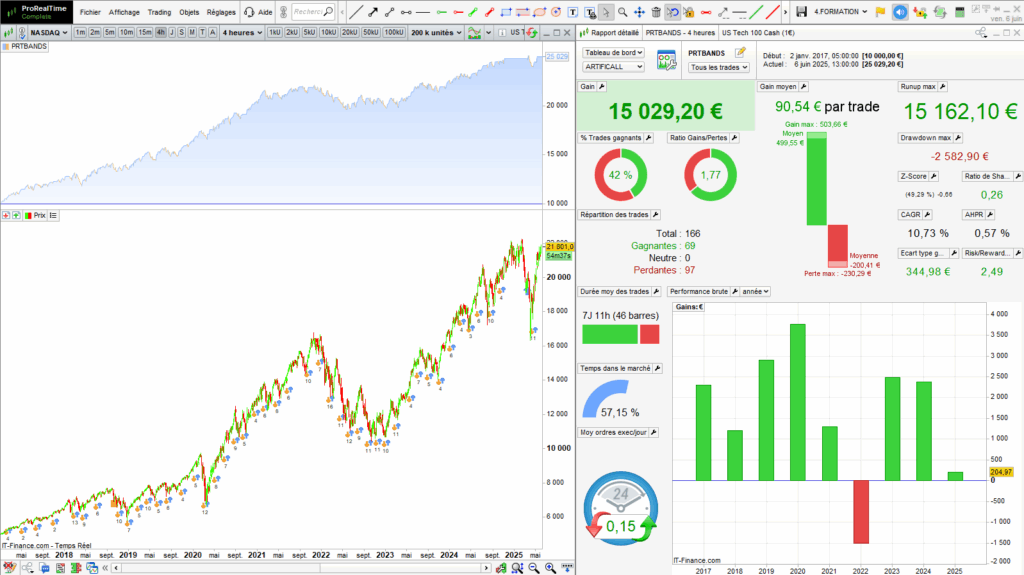
Here is the result of the PRT Bands crossing trend lines. The strategy yields a gain of €15,029 with a success rate of 42%. However, a deep drawdown happened in 2022:
Detailed report
You can download the detailed report to obtain more information about the position price, size, and the transaction date:
Strategy enhancement
I will implement a trend filter to enhance this strategy. I added a condition checking the uptrend of the short-term line:
// * PRT Bands Trend lines crossing in positive trend strategy * //
// Risk Management
capital = 10000
numberOfContracts = ROUND(capital/close, 2)
targetPercent = 5
stoplossPercent = 2

// PRT Bands long Signal
PRTBandsCrossingLines = PRTBandsShortTerm CROSSES OVER PRTBandsMediumTerm

// Trend Filter
trend = PRTBandsShortTerm[1] < PRTBandsShortTerm[0]

// Long entry opening condition
IF NOT LongOnMarket AND PRTBandsCrossingLines AND trend THEN
  BUY numberOfContracts CONTRACTS AT MARKET
  SET TARGET %PROFIT targetPercent
  SET STOP %LOSS stoplossPercent
ENDIF
Result of the enhanced backtest
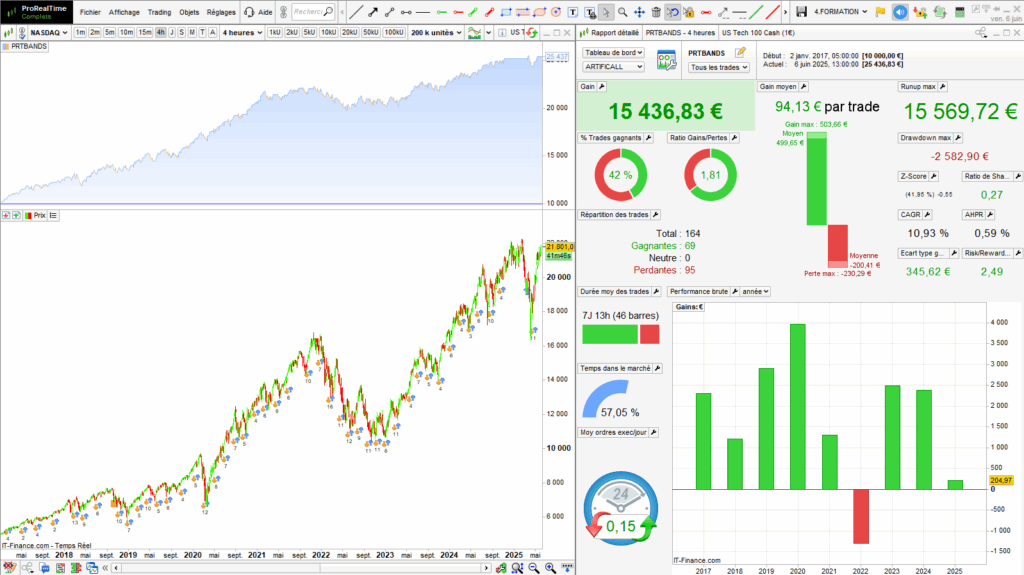
The result of this strategy enhancement is limited. Only two losing trades have been eliminated. The profit and success rate are a bit better, but the drawdown is unchanged:
Detailed report
You can download the detailed report to obtain more information about the position price, size, and the transaction date:
D. Uptrend restarting strategy
The PRT Bands indicator can detect a trend resuming, thanks to the direction of the short-term trend line. You can consider a buying signal when the short-term trend line becomes positive.
Code of the backtest
The following code will open long entries when the short-term trend line becomes positive:
// * PRT Bands Uptrend resuming strategy * //
// Risk Management
capital = 10000
numberOfContracts = ROUND(capital/close, 2)
targetPercent = 5
stoplossPercent = 2

// PRT Bands long Signal
ShortTermRestarting = PRTBandsShortTerm[2] > PRTBandsShortTerm[1] AND PRTBandsShortTerm[1] < PRTBandsShortTerm[0]

// Long entry opening condition
IF NOT LongOnMarket AND ShortTermRestarting THEN
  BUY numberOfContracts CONTRACTS AT MARKET
  SET TARGET %PROFIT targetPercent
  SET STOP %LOSS stoplossPercent
ENDIF
Result of the backtest
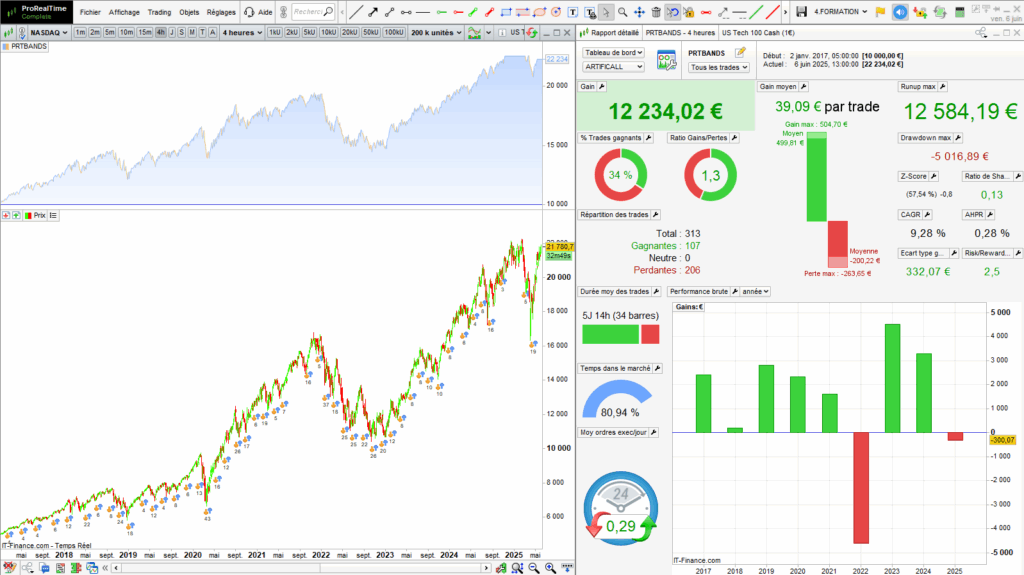
The performance of this strategy is poor. The return is €12,234 with a success rate of 34%. The equity curve is extremely volatile with a very deep drawdown:
Detailed report
You can download the detailed report to obtain more information about the position price, size, and the transaction date:
Strategy optimization
To enhance this strategy, I will implement a trend restarting validation. The candle following the trend resuming must be green to validate the signal. In addition, I added a trend filter: the 100-candle trend must be positive to avoid false signals:
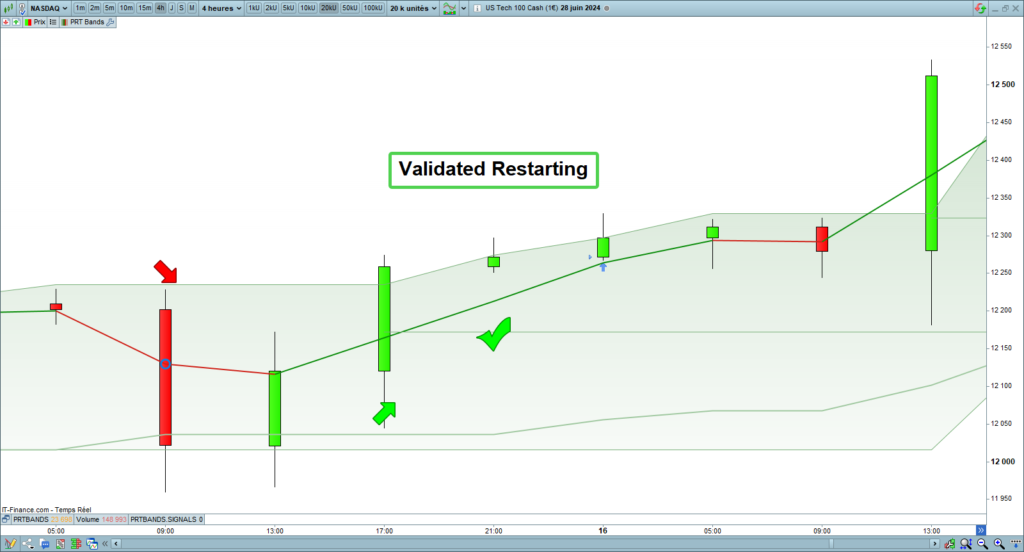
The following code will open long entries if the trend restarting is validated and if the 100-candle trend is positive:
// * PRT Bands validated Uptrend resuming strategy * //
// Risk Management
capital = 10000
numberOfContracts = ROUND(capital/close, 2)
targetPercent = 5
stoplossPercent = 2

// PRT Bands long Signal
ShortTermRestarting = PRTBandsShortTerm[2] > PRTBandsShortTerm[1] AND PRTBandsShortTerm[1] < PRTBandsShortTerm[0]

// Validated Resuming signal
ValidatedShortTermRestarting = ShortTermRestarting[1] AND PRTBandsShortTerm[1] < PRTBandsShortTerm[0]

// Trend Filter
trend = LinearRegressionSlope[100](close) > 0

// Long entry opening condition
IF NOT LongOnMarket AND ValidatedShortTermRestarting AND trend THEN
  BUY numberOfContracts CONTRACTS AT MARKET
  SET TARGET %PROFIT targetPercent
  SET STOP %LOSS stoplossPercent
ENDIF
Result of the optimized backtest
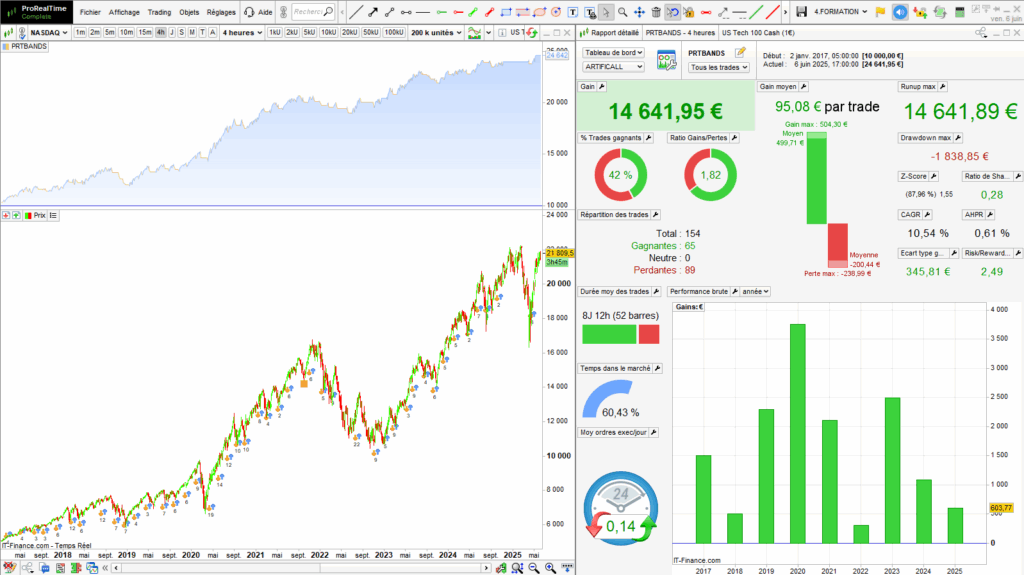
Here is the result of the optimized trend restarting strategy. The strategy delivers a gain of €14,640 with a success rate of 42%. The drawdown is strongly reduced during 2022:
Detailed report
You can download the detailed report to obtain more information about the position price, size, and the transaction date:
PRT Bands strategy summary
1. The PRT Bands indicator provides consistent buying signals.
2. It allows for uptrend continuation, resuming, and bullish reversal.
3. Regarding the backtests, the high-band breakout would be the best signal.
4. You can enhance the performance with volume and trend filters.
5. You should prioritize the robustness of the strategy over the profits.
6. The PRT Bands indicator is efficient for timeframes of 4 hours or higher.
7. It is an indicator perfectly adapted for swing trading.
Additionnal ressources
Here are some resources about the PRT Bands indicator:
Topic on Prorealcode
https://www.prorealcode.com/topic/prt-bands-trend-following-prorealtime/
Documentation
https://www.prorealcode.com/documentation/prtbandsup/
https://www.prorealcode.com/documentation/prtbandsdown/
https://www.prorealcode.com/documentation/prtbandsshortterm/
https://www.prorealcode.com/documentation/prtbandsmediumterm
French documentation
https://www.prorealtime.com/fr/manuel-aide/prorealtime-bands
Range Breakout Indicator for Prorealtime
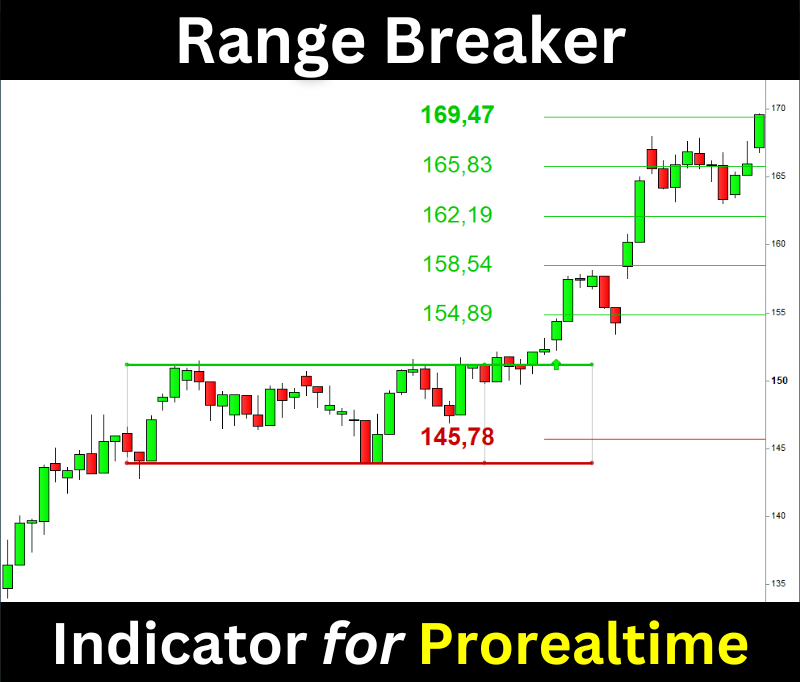
The Range Breaker will help you trade the Range Breakouts on Prorealtime. It displays the ranges, breakout signals, and target prices on your chart.