Take advantage of the trend resuming
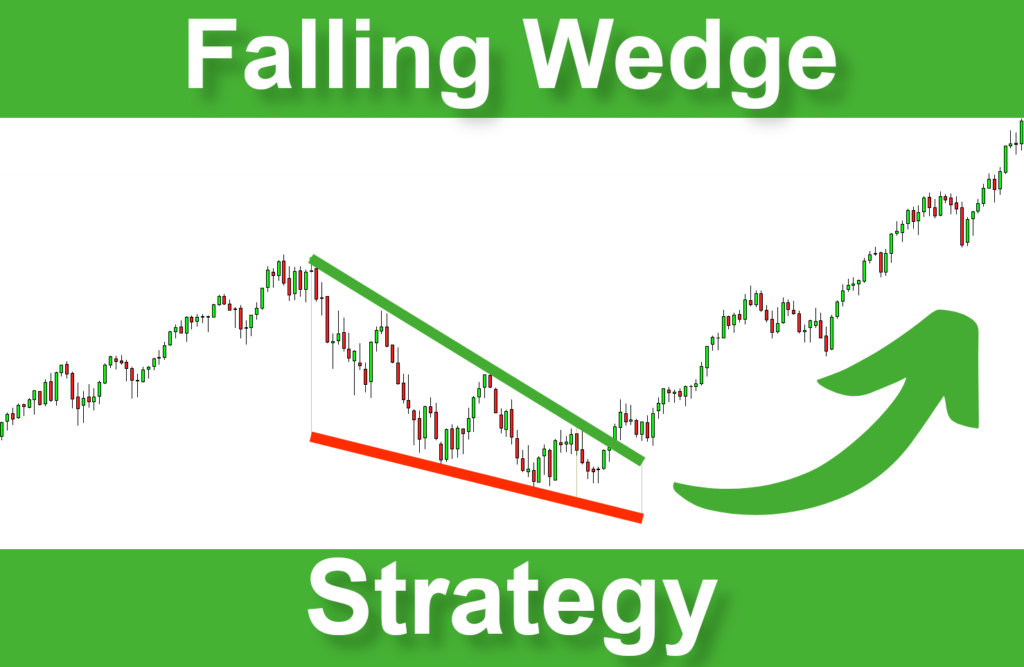
Bearish markets can offer tempting buying opportunities. However, buying a bear market could destroy your capital. Falling wedges will help you capitalize on the trend resuming. This pattern provides powerful bullish reversal signals that will help you catch large price movements.
In this post, I will show you how to trade falling wedge breakouts efficiently. You will learn to recognize this pattern, detect buying signals, enter the trade, and correctly place your targets and stop-loss.
I. What is a Falling Wedge?
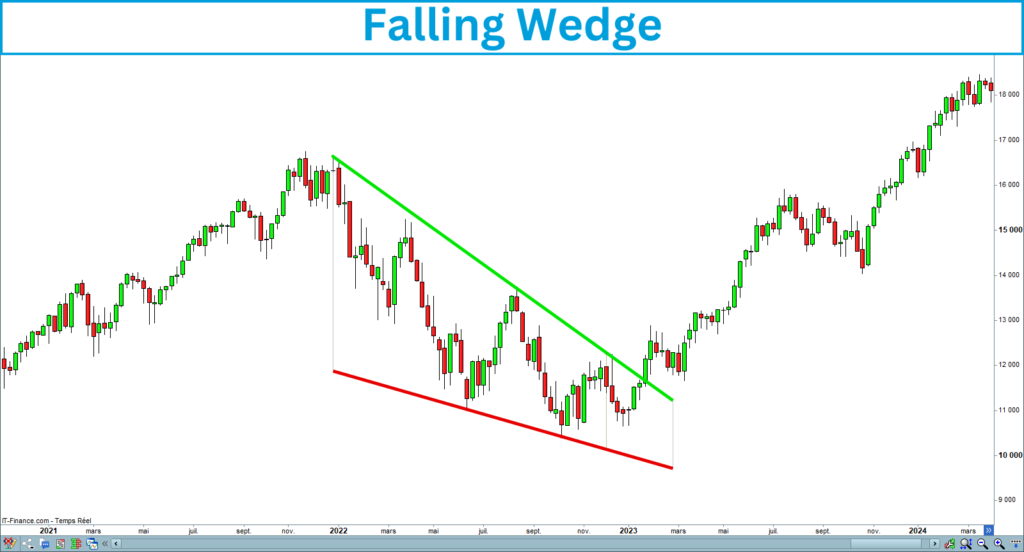
A falling wedge is a bullish reversal pattern that forms after a downtrend. This figure is composed of two converging trendlines that slope downwards. The upper trendline connects a series of lower highs, while the lower trendline connects a series of lower lows. As the price moves within this narrowing range, it indicates a loss of momentum in the downward trend, setting the stage for a potential breakout to the upside.
Here is a screenshot of a falling wedge that occurred on the Nasdaq in the weekly timeframe:
II. How to Identify a Falling Wedge?
Falling Wedge properties
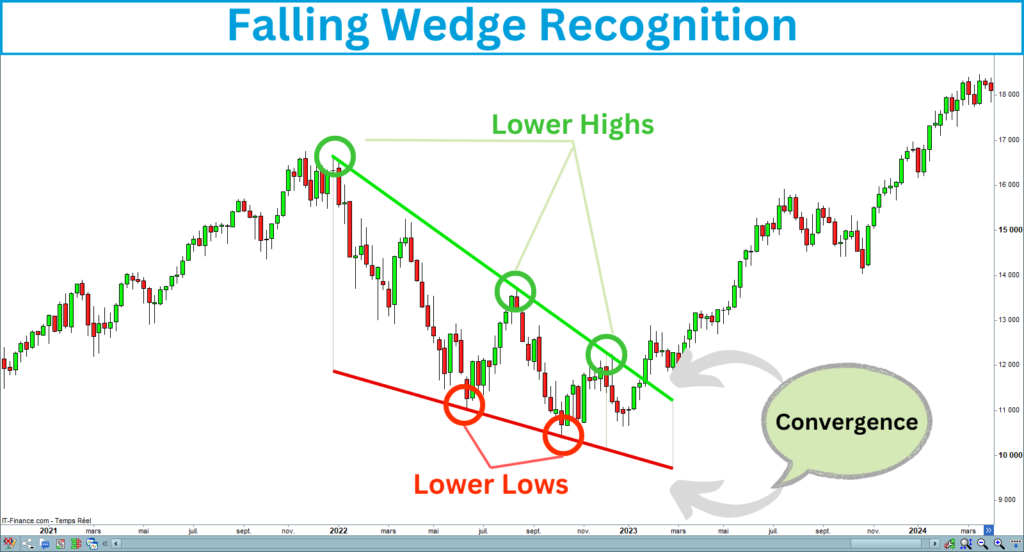
Before diving into the strategy, correctly identifying a falling wedge on the chart is essential. Here are the key characteristics of this pattern, which must be satisfied:
The following chart shows a falling wedge meeting the previous criteria:
Falling Wedge inclination
As the descending channel, the falling wedge is a descending figure indicating a bearish bias. The particularity of this pattern is that its bearish bias is more pronounced. That is why the falling wedges are a little more risky than the descending channels. In return, they give buying signals before the descending channels, increasing the expected gain.
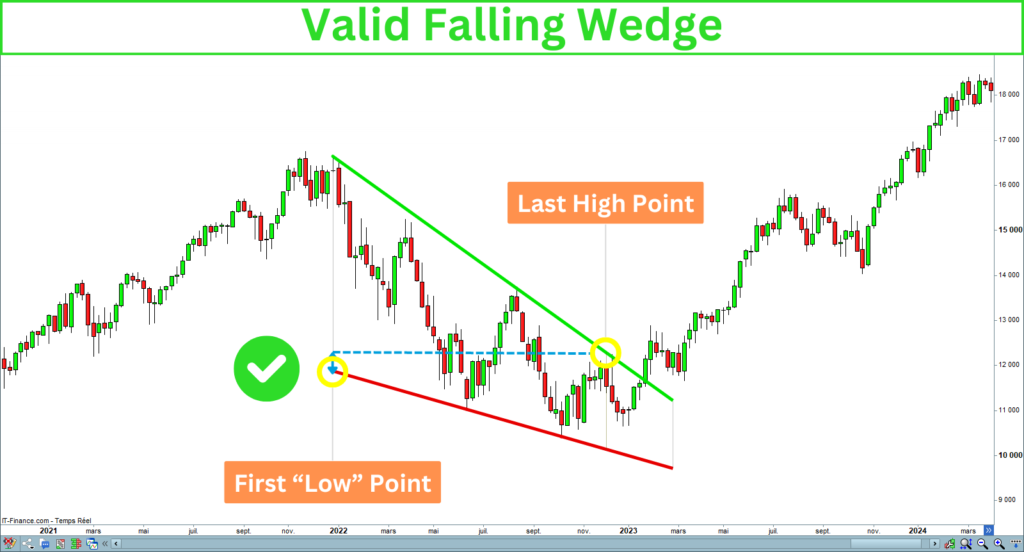
As you know, opening a long entry in a bear market would be perilous. That is why you should validate the properties of the wedge before opening an entry. The wedge line’s slope should not be too descending. You can verify that the last highest point is greater than the first lowest.
The following screenshots illustrate this comparison you must control:
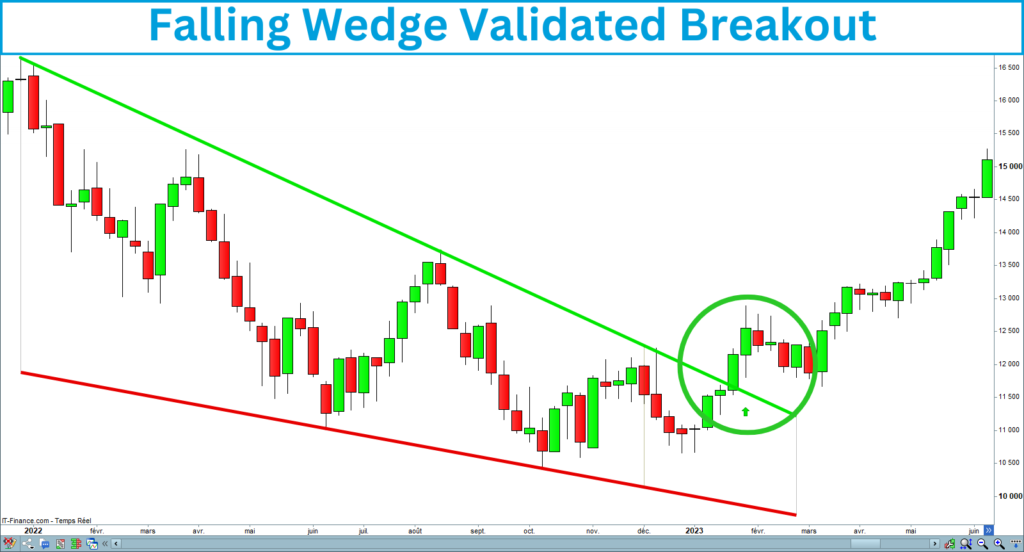
Valid falling wedge
The last high is greater than the first low point of the falling wedge, meaning the wedge is not too descending:
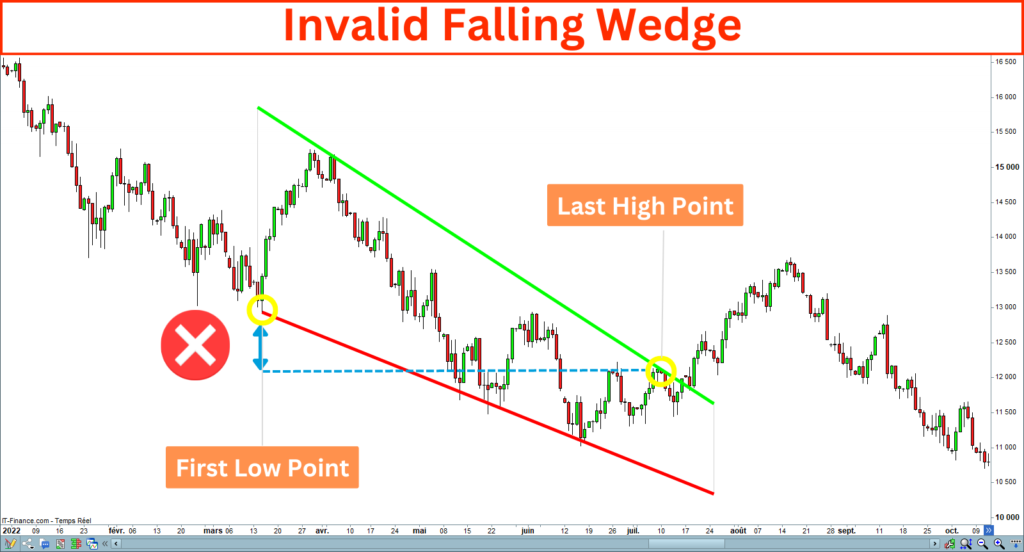
Invalid falling wedge
The last high is lower than the first low point of the falling wedge, meaning the wedge is too steeply descending:
III. Falling Wedge Breakout
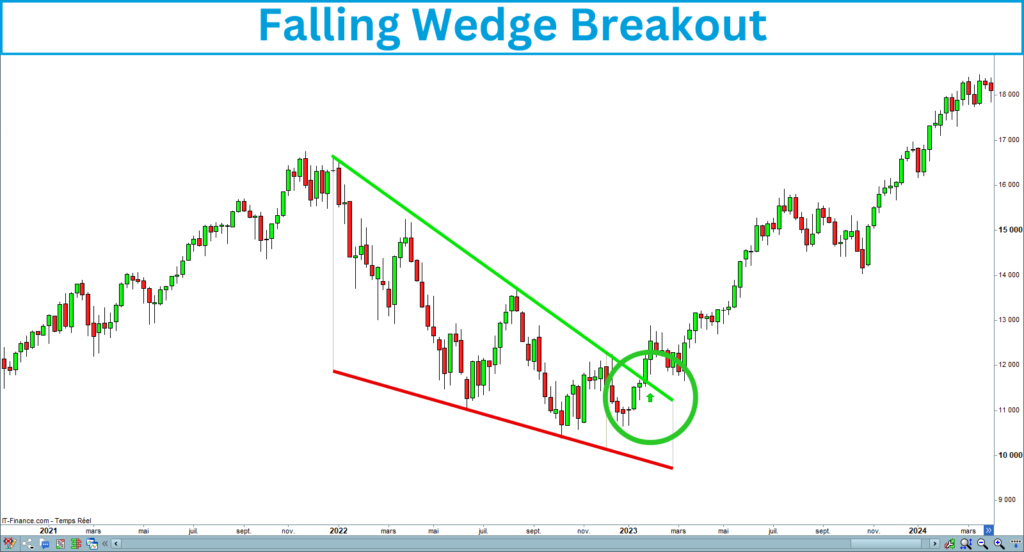
The falling wedge works like the descending channel. The breakout occurs when the price breaks the top line of the wedge. It is a bullish signal indicating a potential trend reversal.
The following chart shows the topline breakup of a falling wedge:
IV. The Falling Wedge Breakout Strategy step-by-step
Trading the falling wedge breakout involves entering a position when the price breaks above the upper trendline. Here’s a step-by-step guide:
1. Identify the wedge
Draw the upper trendline by connecting the lower highs, and the lower trendline by connecting the lower lows. These trendlines should decrease and converge as the pattern develops.
2. Validate the global trend
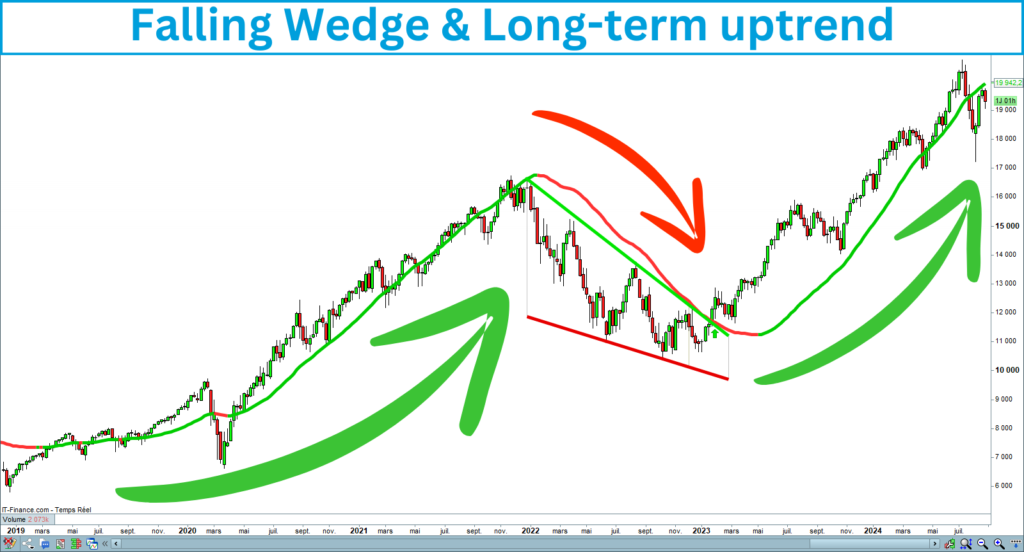
It is crucial to check the long-term uptrend of the asset before opening a long entry in the market. Since the falling wedge occurs in a bearish trend, you must validate the global bullish bias of the asset you want to trade. Most major indices, such as the Nasdaq, S&P 500, and Dow Jones, exhibit this bias.
You can verify whether the slope of a trend indicator over a large period is positive. Many trend indicators, such as moving averages or linear regressions, enable the measurement of market trends. You should determine the trend period at least three times the figure length. For example, if you watch a 50-candle falling wedge, you must evaluate the trend on 100 or 200 candles.
The following chart shows a falling wedge in a bearish trend on an asset with a global bullish bias. The line represents a falling wedge on 50 candles with a linear regression calculated on 100 periods:
3. Watch for a Breakout
The pattern is complete when the price breaks above the upper trendline with increasing volume, signaling a potential bullish reversal.
4. Confirm the Breakout
For the breakout to be valid, the next candle must close above the upper line of the falling wedge. Ideally, this breakout should be accompanied by increased volume, confirming that the buyers are taking control.
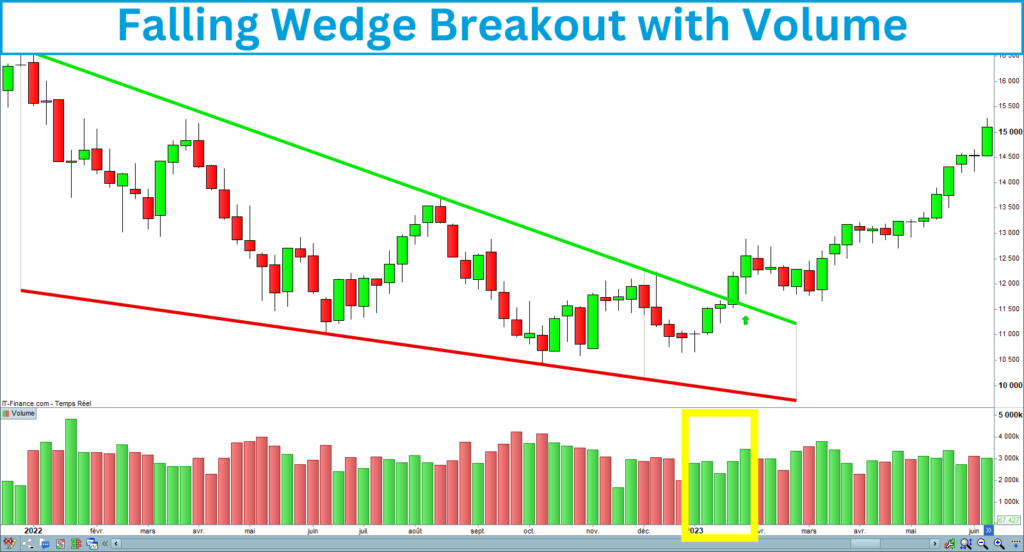
5. Verify the volume
Volume is an excellent indicator for understanding the investor’s behavior. Verify that the buyer volume increases before and during the breakout. It is one of the most efficient ways to eliminate false breakouts.
The following chart shows that buyer volumes occurred before and during the breakout:
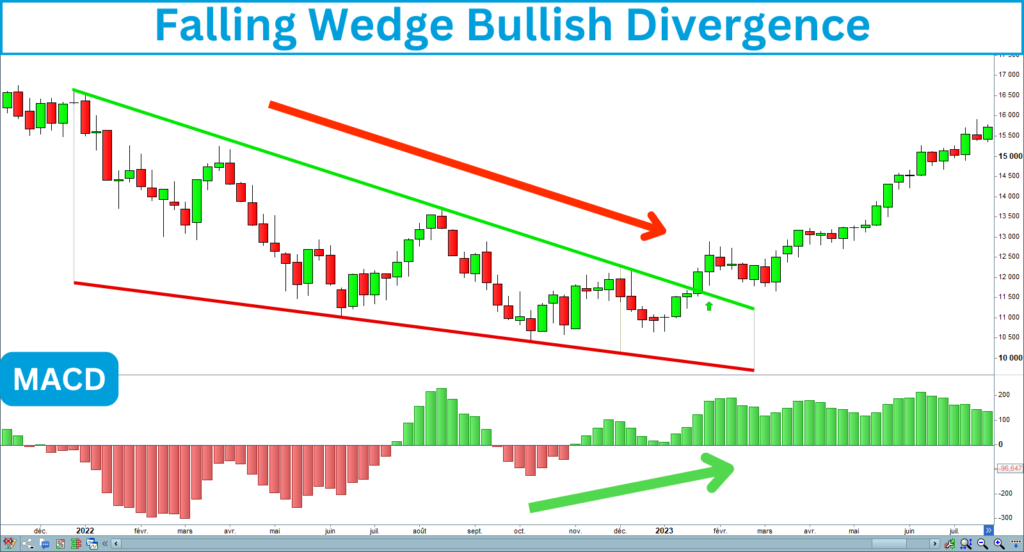
6. Validate a bullish divergence
A bullish divergence occurs when a strength indicator becomes bullish while the trend is still bearish. It reveals that traders are returning to the assets. Check for a bullish divergence at the end of the falling wedge and during the breakup. This is an excellent way to prevent false breakouts and bull traps.
The following chart shows a bullish divergence associated with a falling wedge:
7. Enter the Trade
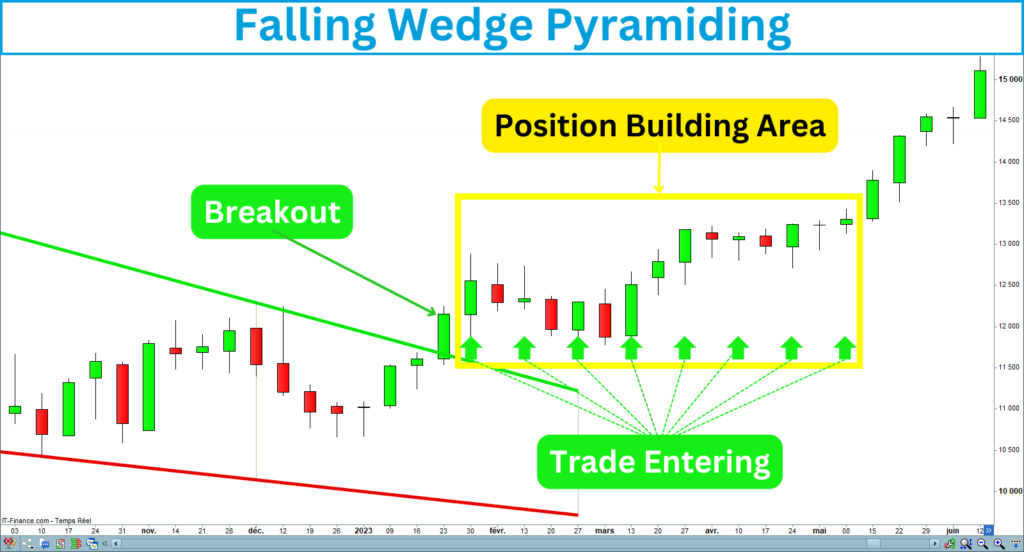
Enter a long position once the breakout is confirmed with volumes and a positive divergence. However, betting on the trend restarting is no easy task. Since the falling wedge breakup happens in a bear market, you have to stay careful.
A good way to benefit from a trend restarting by limiting risks is to enter the trade gradually. You can start to build your position from the falling wedge breakup and continue to buy while the market confirms the trend is restarting. In this way, you will benefit from trend restarting and mastering your risk.
The following chart shows how you can pyramid a position after a falling wedge breakout:
8. Set a Stop-Loss
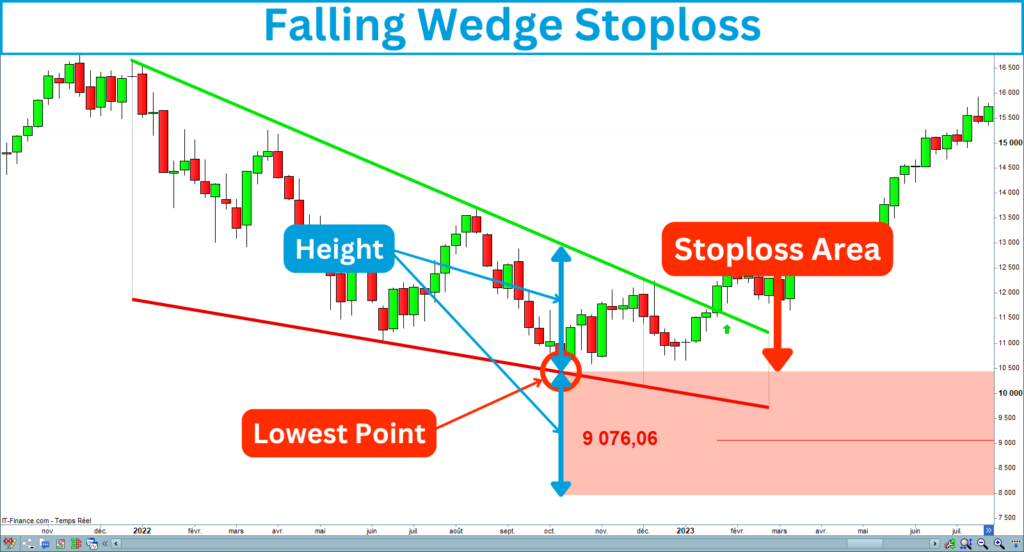
To manage risk, place a stop-loss order below the lowest point of the wedge. It will protect your trade if the breakout fails and the price reverses.
You will need the height of the wedge to place the stoploss. Several ways allow the height evaluation. Some use the distance between the upper and lower trendlines at the widest point. I prefer to take the distance between the last construction point and the trend line of the wedge.
The best stoploss area is under the last construction point of the falling wedge. You can report the figure height from the lowest point to draw the zone.
The following chart shows the stoploss position for a long entry opened after the falling wedge breakup:
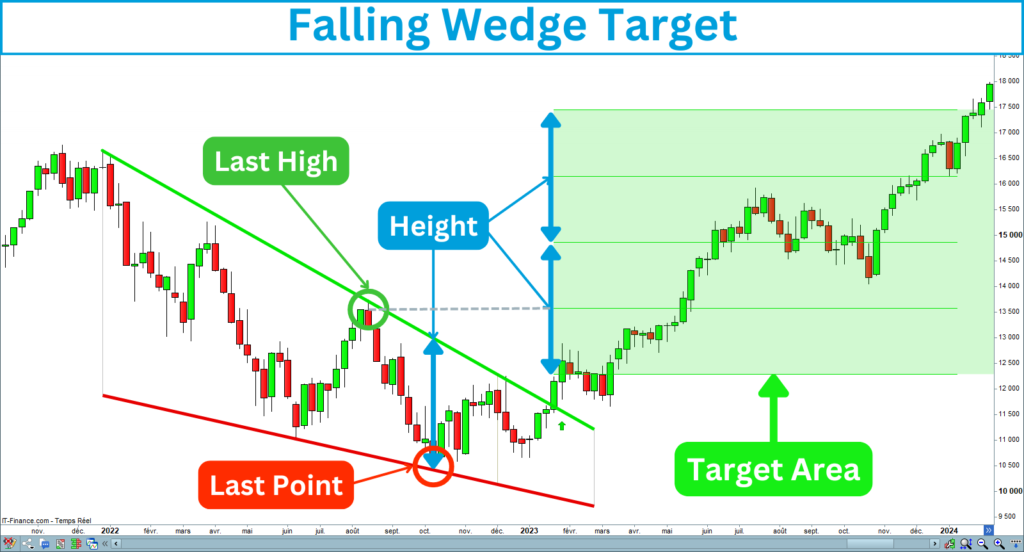
9. Determine the Target Price
As for the stoploss, you have to consider the height of the wedge to place the target. You can report this distance from the last high of the falling wedge topline. You can report a height or half-height under the last high if there is sufficient space between this level and your price entry.
Many traders think the best target place corresponds to one wedge height from the breakout point or the highest point of the wedge. However, operating an asset with a consistent bullish bias allows targeting between two and three times the wedge height. Remember, you bet on the restarting trend by buying a falling wedge breakout.
The following chart shows the target area for a long entry opened after the falling wedge breakup:
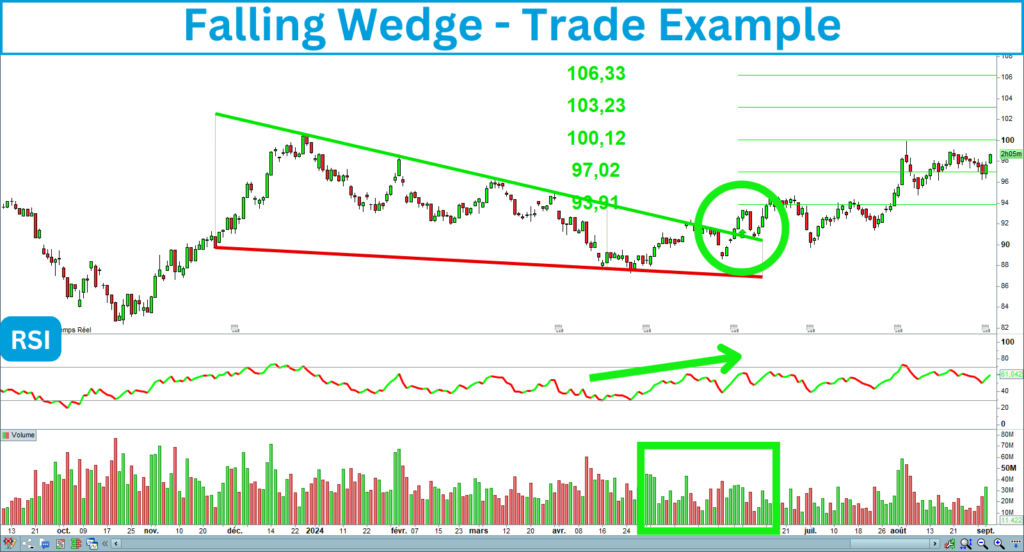
V. Example of a Falling Wedge Breakout Trade
Here is an example of a trade after a falling wedge breakup on the 20-Year U.S. Treasury Bond in the daily timeframe. The breakout was validated, accompanied by buying volumes and a bullish divergence on the RSI.
I took advantage of this buy signal to strengthen my position on TLT. A few weeks later, I reinforced this position again after the bullish breakout of a descending channel.
VI. Tips for Trading the Falling Wedge Breakout Strategy
VII. Falling Wedge Strategy Summary
The falling wedge breakout strategy is a powerful tool for traders looking to capitalize on potential reversals after a downtrend.
This strategy is slightly riskier than the descending channel due to its more pronounced bearish bias.
That is why it is essential to associate the buying signal with a bullish divergence, buyer volumes, and breakout confirmation.
By understanding how to identify and trade this pattern, you can profit from the start of a new bullish trend.
If you are interested in the falling wedge strategy, I created an indicator that recognizes this pattern. It draws trend lines, detects breakouts, and displays the target and stop-loss.
The indicator is available on the marketplace of Prorealcode on this page:
https://market.prorealcode.com/product/ultimate-breaker
Have good trades 😊