Capitalize on the bearish momentum
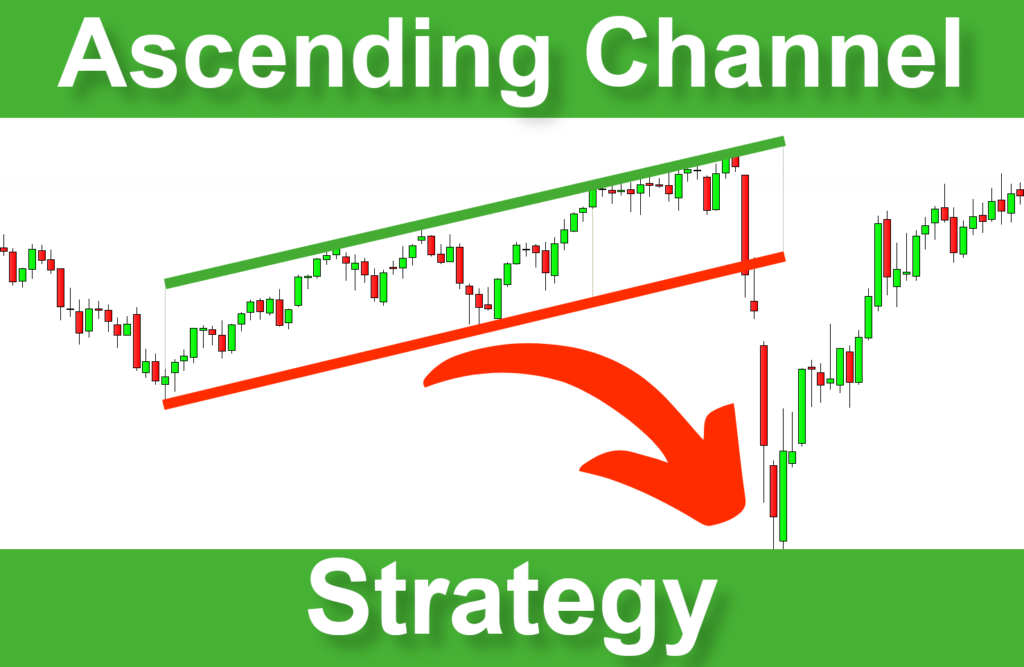
Identifying trend reversals can be as profitable as riding an ongoing trend. One effective way to catch a reversal is by recognizing the breakdown of an Ascending Channel. The Ascending Channel Breakdown Strategy is a potent tool to help traders capitalize on shifting from bullish to bearish momentum.
In this post, I will explore what an Ascending Channel is, how to spot it, and how to trade the breakdown for maximum profit.
What is an Ascending Channel?
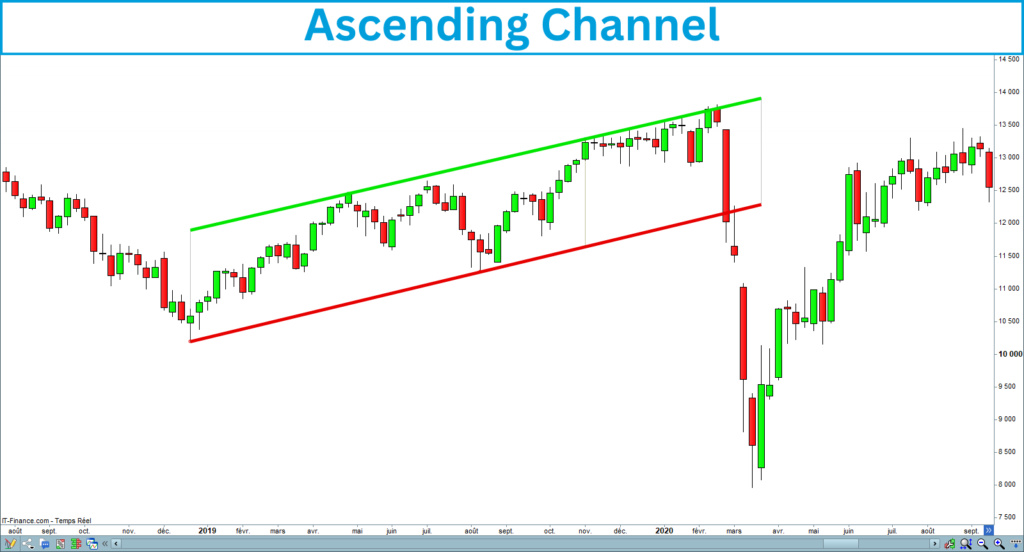
An ascending channel is a technical analysis chart pattern that forms when the price of an asset consistently moves higher within a set of parallel upward-sloping trendlines. This pattern is also known as a rising channel, indicating a bullish market trend.
Here is a screenshot of an ascending channel:
Ascending Channel breakout
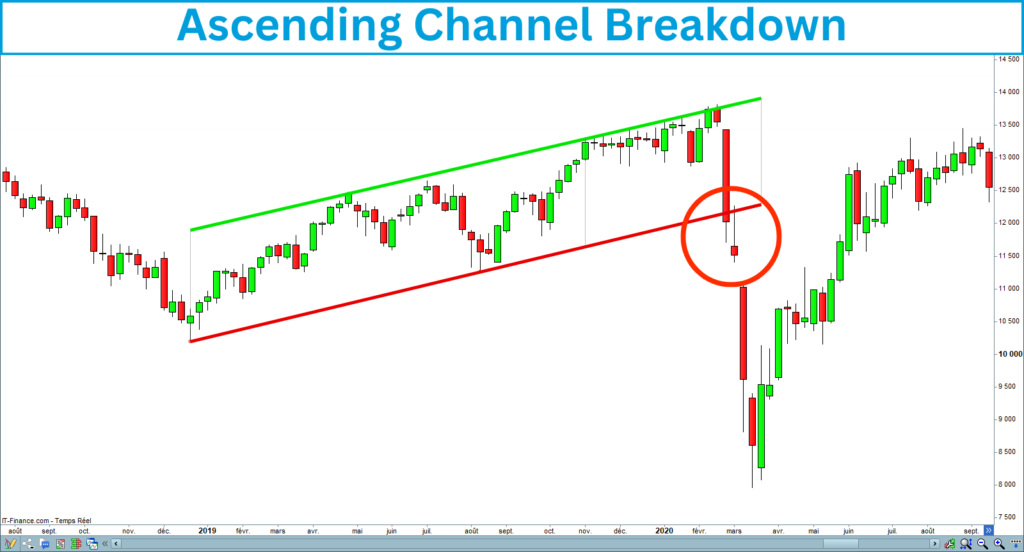
While ascending channels generally indicate a bullish trend, a breakdown from this pattern can signal a shift in momentum, offering traders an opportunity to capitalize on the reversal. The breakdown happens when the price closes above the lower line.
Here is a screenshot of an ascending channel breakdown:
How to identify an ascending channel?
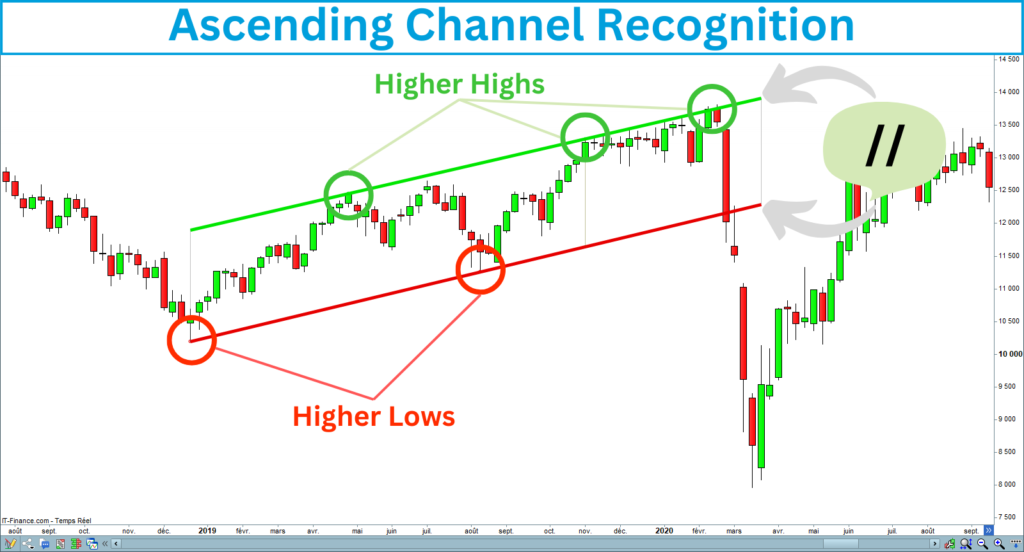
Ascending channel properties
To efficiently trade an ascending channel Breakdown, you must first correctly identify the price chart pattern. Here’s how:
The following chart shows an ascending channel meeting the previous criteria:
Channel inclination
As an ascending figure, the ascending channel induces a bullish bias. Opening a short entry in a bull market could destroy your capital. That is why you have some parameters to check before entering a trade.
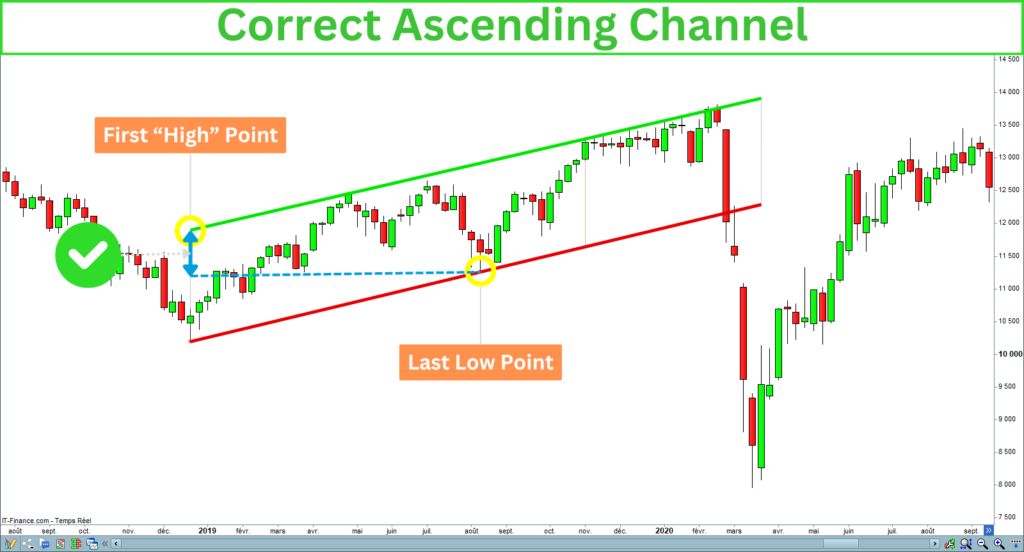
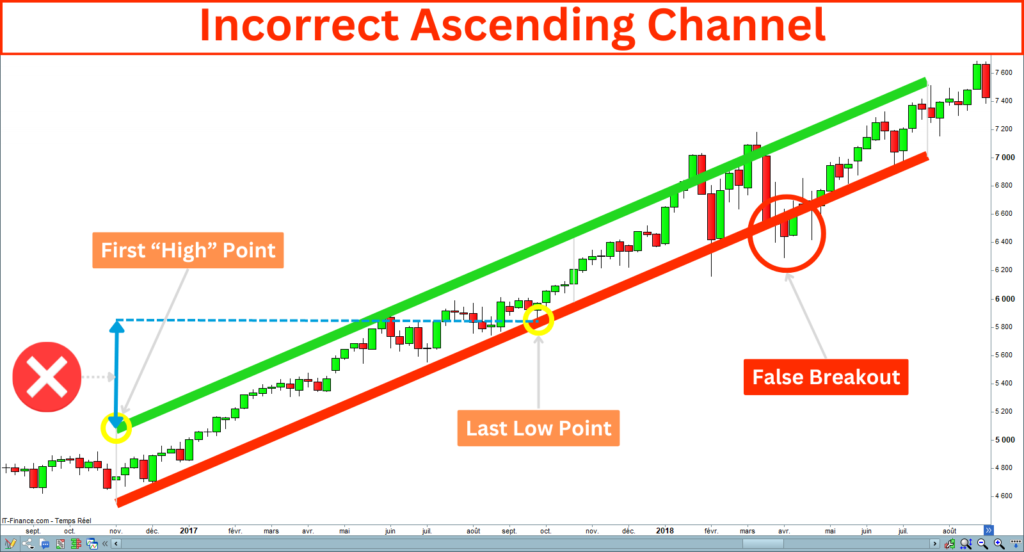
The channel line’s slope should not be too ascending. You can compare the last lowest with the first highest to validate the channel inclination. Checking that the last lowest is lower than the first highest is crucial. The following screenshots illustrate this comparison you must control:
Correct ascending channel
The last low is lower than the first high point of the ascending channel, meaning the channel is not too ascending:
Incorrect ascending channel
The last low is greater than the first high point of the ascending channel, meaning the channel is too ascending:
Bearish divergence
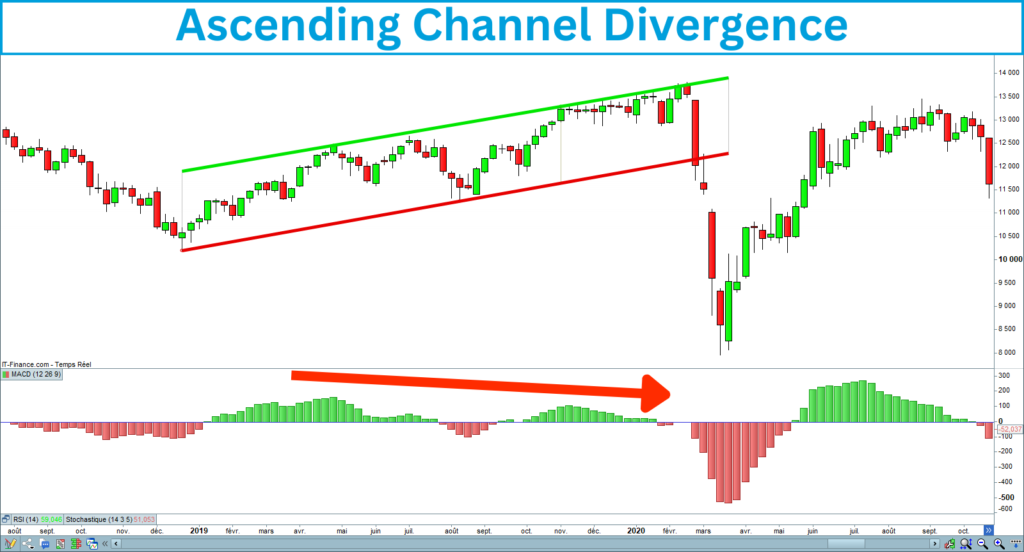
A bearish divergence indicates a potential downward reversal in an asset’s price. It happens when the price goes up, but an indicator, like the Relative Strength Index (RSI) or MACD, goes down. This mismatch suggests that the underlying momentum is weakening despite rising prices. It can be a warning that the uptrend might be losing strength and that the price could decline soon. It is preferable to see a bearish divergence before selling the market.
Here is an example of a bearish divergence between an ascending channel and the MACD:
The Ascending Channel Breakdown Strategy
Now that you know how to recognize the ascending channel pattern, let’s explore the strategy step by step.
The seven steps of the ascending channel strategy
The breakdown occurs when the price closes below the lower support line of the ascending channel, signaling that the bullish momentum is ending and a bearish trend may begin. Here are the seven steps to trade this breakdown effectively:
1. Identify the Channel
Start by drawing a well-defined ascending channel on your chart. The channel should be clear, and the price should move consistently between the two trendlines.
2. Wait for the Breakdown
The breakdown occurs when the price closes below the lower line of the ascending channel. It is a bearish signal, suggesting that the upward trend may be reversing.
3. Confirm the Breakout
Not all breakdowns start a downtrend. Waiting for signal confirmation can avoid false breakouts or bear traps. The selling signal is validated if the candle following the breakdown closes under the lower line of the ascending channel.
4. Enter the Trade
Once the signal is validated, you can enter a short position at the closing price of the breakdown candle. You might wait for a pullback to the support line and enter when the price fails to reclaim the channel.
Depending on the type of orders you prefer, there are several ways to sell to the market. You can sell at the market, place a limit order above the last price, a stop order under the last price, or a trigger range order:
- Buying and selling at the market is easier if you operate with a liquid value, such as the S&P 500 or the Nasdaq.
- Limit, stop, or range orders can help you control your entry price when trading stocks or a few liquid assets.
5. Set a Stop-Loss
Setting a stop-loss order will protect your trade in the case of a false breakout. Before placing a stoploss, consider the relationship between success rate and risk of loss:
- If you place your stoploss too near the last price, you reduce the potential loss but increase the risk of seeing your position stopped.
- If you place your stop-loss too far from the last price, you will increase the success rate but take the risk of incurring a significant loss.
You can equilibrate the success rate with the loss risk by placing the stoploss around the top line of the ascending channel.
6. Define Your Target
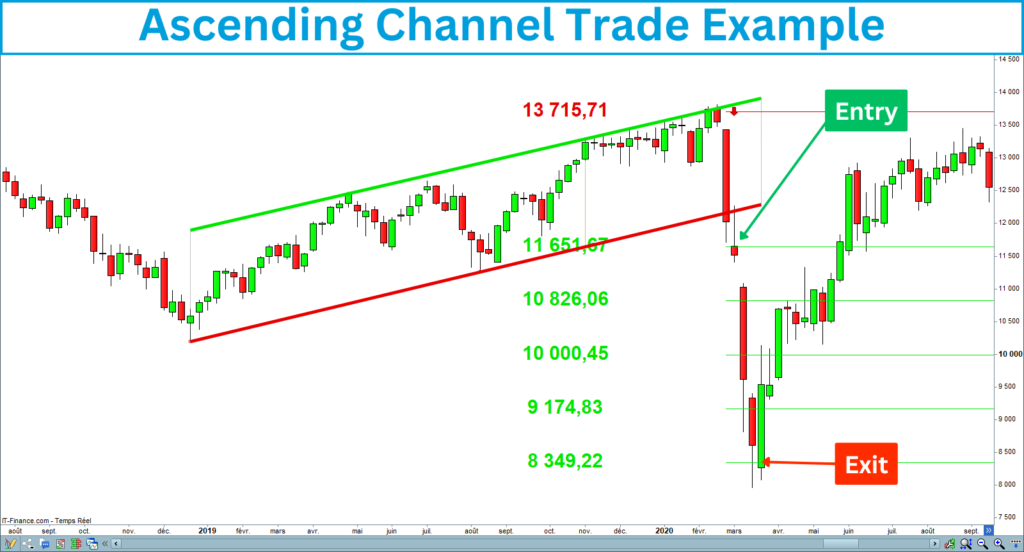
The advantage of operating trading patterns is that you can easily evaluate the target by reporting the channel height on the chart. The height of an ascending channel corresponds to the distance between the upper resistance and lower support lines.
Project channel height downward from the last highest point of the low line. The best target position I backtested is between two and three times the channel height.
Alternatively, you can use a trailing stop to lock in profits as the price declines.
7. Manage the Trade
When we enter a trade, we are never sure that the price will reach the target. You can use a trailing stop to lock in profits as the price declines.
In this case, waiting until the price touches a key support level is better before placing your trailing stop order. Each time the price breaks down support, you can adjust your stop order by some points.
In this way, you secure your latent profits and keep the possibility of increasing your gains if the market continues to fall.
Example of an ascending channel breakdown trade
The following example shows the breakdown of an ascending channel on the DAX 40 that occurred at the start of the coronavirus pandemic in 2020:
The short-selling particularities
Here are the particularities of short-selling you need to remember to trade efficiently:
Origin of the bear market
Sometimes, an unexpected event can disrupt or threaten the creation of wealth. Bad news often triggers bear markets or crashes. This is the context in which you will trade the market. You will need to be careful to remain reasonable in your decisions.
Bear market volatility
During a bear market, volatility can surge to levels never seen before, making target and stop-loss positioning challenging. You should adjust your financial exposure to account for volatility. It is preferable not to operate in a bear market with leverage.
Market operator interests
Except for those who sold the market, most operators have interests in a bull market: banks, investors, brokers, marketplaces, politicians, and central banks. Everybody will activate safety devices to limit the collapse when a market crash happens.
Consequently, the expected profits from short sales are lower than buying the market.
Bear market duration
The average duration of a recession can vary depending on the country and the specific economic context. Generally, recessions in the United States have lasted about 10 to 18 months on average. Even though recessions are often associated with bear markets, the market can plunge without one. The bad news at the origin of the crash can be solved quickly.
After opening a short-sell position, you can’t close your platform and go on vacation. The market can crash or rebound sharply, so you must monitor your position daily.
Long-term bullish bias
The market has a bullish bias, which comes from wealth creation. The bull market’s average duration typically lasts about 6 to 9 years. When you open a long entry, you bet on the continuation of wealth creation. When the wealth creation risks are interrupted, the market falls, giving short-selling opportunities.
However, sooner or later, the economy will restart. Everyone has an interest in maintaining economic growth. The bullish bias is stronger than the bearish bias. This is why keeping a short position for a long time is difficult.
Arbitrage opportunities
Finally, falling markets can offer investment opportunities for long-term investors. By buying stocks that have reached attractive values, investors can block the market downtrend, reducing the potential profits of short sellers.
Tips for Success with the Ascending Channel Breakdown Strategy
Summary
The Ascending Channel Breakdown Strategy is a powerful tool for traders seeking to capitalize on reversals in bullish trends.
You can benefit from a bear market by correctly identifying an ascending channel and waiting for a confirmed breakout associated with bad news.
The particularities of bear markets impose a high level of discipline, daily monitoring of your position, and sophisticated risk management.
If you’re interested in the ascending channel strategy, I’ve created an indicator that identifies this pattern. It draws trend lines, detects breakouts, and displays the target and stop-loss on the chart.
The indicator is available on the marketplace of Prorealcode:
https://market.prorealcode.com/product/ultimate-breaker
I wish you good trades 😊


