This is the third and last post about evaluating automated trading robustness. The first was about evaluating a trading strategy at first glance, the second was about the stress tests, and now, I will talk about the Stochastic modeling.

I was initially foreseen to present the stochastic modeling about robustness in my last post, but finally, I preferred to present this test in a separate post to facilitate your reading.
What about Stochastic modeling?
Definition of the stochastic test
Stochastic tests are very important in robotics and the industry. What is more, when the robot has artificial intelligence, like an autonomous car interacting with human beings.
The stochastic test applies little variations on the environmental properties in which the robot will operate. These variations could also be applied to the internal properties of the system.
Purpose of the stochastic test
The stochastic test tries to measure the degree of flexibility of an autonomous system. It is a kind of stress test used to validate the robustness of a system. We want to be sure that the robot will continue to be efficient even if there are some environmental changes.
To validate the stochastic modeling test, the following conditions must be completed :
Little variations of environmental or internal properties shall not entail a large variation of the system’s performance.
(that is my point of view)
Application of the test on Prorealtime
Back to the spread increase test
The spread is the only environmental property we can modify on the Prorealtime platform.
To validate the test, a little variation of the spread shall not entail a big variation in the performance of the automated trading system.
How to process stochastic modeling on Prorealtime?
It is impossible to apply variations on the quotation historical of an asset with Prorealtime apart from the spread. However, it is perfectly possible to launch stochastic modeling only on the internal properties of a trading system. Thus, we will apply little variations on the values of the variables implicated in the decision-making, such as the opening, the management, and the closing of an entry.
For example, if your automatic trading system opens an entry when the relative strength index exceeds 30, the stochastic modeling will replace 30 with 29 and 31. For the stochastic modeling to be valid, these two values do not provoke a significant change in the performance of the automated trading system.
Validation requirements of the test
There are two steps to validate stochastic modeling. First, we will apply a little variation on each variable about the RSI, as in the previous example. This is the unitary test of stochastic modeling.
And secondly, we will test all the combinations of little variations on all the variables in the same sample. This is the global test of stochastic modeling.
What are we trying to find?
We are trying to verify that the automated trading system is slightly under-optimized. That means the system has a sufficient degree of liberty to accept a change in the environment into which it will operate.
Unitary test of stochastic modeling
Initial problematic
When you launch the optimizer of the variables, it sorts the result from the largest to the smallest gain. And it will naturally choose the value which gives the best performance. It is very tempting to choose this value, but it is often an over-optimized value.
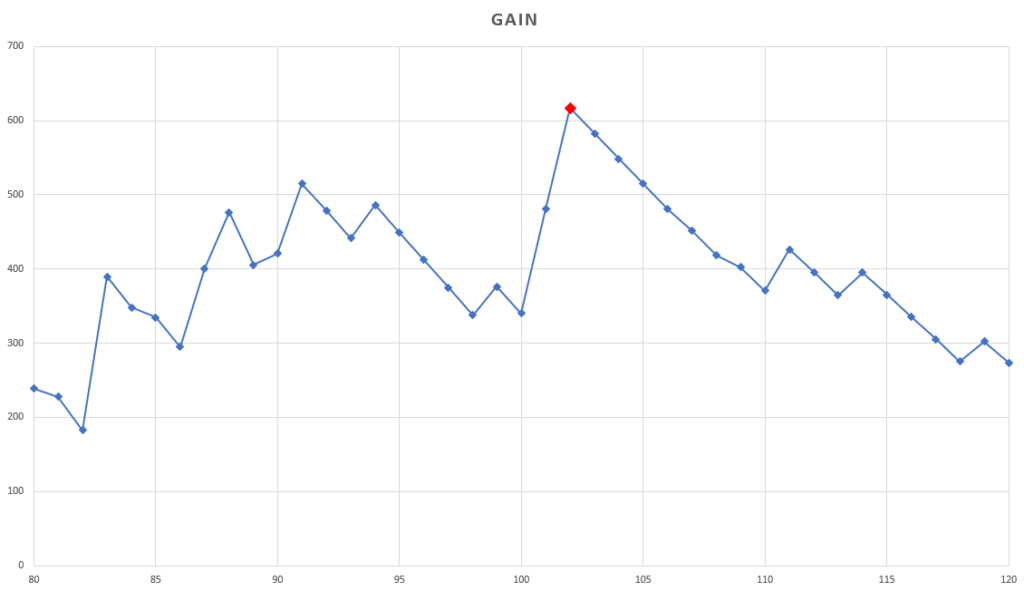
The following chart represents the gain curve, and you can see that the best value is a kind of peak :

The value of the variable represented by a red square on the chart is ‘102’ and it generates a gain of 600€. However, its previous value (101 on the chart) would have given a gain of 500€.
That means with only a little variation of 1 point, the total performance of the strategy falls to 20%. The unitary stochastic modeling will help us to avoid this risk on our strategy.
The unitary stochastic modeling procedure
We will apply a little variation on the value of each variable one by one. A little variation of a variable shall not provoke a large variation of the performance.
Unitary test running
To perform this test, you must open the variable optimizer on Prorealtime and add the variable you want to test. But this time, we will define a range of values around the variable’s initial value. This range will begin from the first previous value to the first next value of the initial value. It is preferable to define an interval so that there are only three possible combinations of values. Thus, there are only three steps: the previous value, the initial value, and the next value.
In the following example, I want to verify whether the relative strength index period is over-fitted. The initial period is 14. Thus, the first value will be 13, the initial value will be 14, and the last value will be 15 :

Interpretation of the result
The initial value of the RSI, here 14 periods, would not have passed the unitary stochastic modeling test. Because its previous and next values provoke a loss in the performance of the system:

Stochastic modeling helps us to know if a chosen value is surrounded by losing values. Now, you must process this test on all the variables implicated in the decision-making. This is laborious work, but it is important because neither the Gradient Descent algorithm nor the Walk-Forward optimization can detect this particularity.
I advise you to duplicate your system to create a specific version dedicated to stochastic modeling.
Global Stochastic modeling test
Global Stochastic Modeling test goal
The global stochastic modeling test has a different goal than the unitary test. Its main purpose is to test the global degree of liberty of the whole automated trading system. If you want this test to make sense, you have to ensure that all your system’s values have passed the unitary stochastic modeling.
To perform this test, you have to apply little variations on all the system variables implicated in the decision-making thanks to the optimizer of the variables.
It could be reasonable to run several tests only on a specific part of your system. For example, you could run a global test on all the variables implicated in the entry opening and another on all the variables implicated in closing open entries. Because you can consider that opening an entry and closing an entry are two distinct activities.
Global test running
For this example, I will launch a test only on three variables to facilitate reading the result. To run a test, I have to open the optimizer of the variables as with the previous test. After that, I added three volatility variables based on different periods. The variables are « ecarTypeSmallMax », « ecarTypeMiddleMax » and « ecarTypeLargeMax » :

Initial values of the variables
The initial values of these three variables are the following :
- ecarTypeSmallMax : 7
- ecarTypeMiddleMax : 100
- ecarTypeLargeMax : 130
Tested combinations
These are all the combinations that the global test will test:
| Variable | Value -1 | Initial value | Value +1 |
|---|---|---|---|
| ecarTypeSmallMax | 6 | 7 | 8 |
| ecarTypeMiddleMax | 95 | 100 | 105 |
| ecarTypeLargeMax | 120 | 130 | 140 |
Result of the global stochastic modeling test
Here is the table containing the result of all the combinations created by the optimizer of the variables:
| % Gain | ecarType SmallMax | ecarType MiddleMax | ecarType LargeMax |
| +7,36% | 7 | 95 | 130 |
| +7,36% | 7 | 95 | 140 |
| +7,36% | 7 | 100 | 130 |
| +7,36% | 7 | 105 | 140 |
| +7,36% | 7 | 105 | 130 |
| +7,36% | 7 | 100 | 140 |
| +6,14% | 6 | 105 | 130 |
| +6,14% | 6 | 95 | 140 |
| +6,14% | 6 | 100 | 140 |
| +6,14% | 6 | 105 | 140 |
| +6,14% | 6 | 100 | 130 |
| +6,14% | 6 | 95 | 130 |
| +5,98% | 7 | 105 | 120 |
| +5,98% | 7 | 95 | 120 |
| +5,98% | 7 | 100 | 120 |
| +4,88% | 6 | 100 | 120 |
| +4,88% | 6 | 95 | 120 |
| +4,88% | 6 | 105 | 120 |
| +4,69% | 8 | 100 | 140 |
| +4,69% | 8 | 105 | 140 |
| +4,69% | 8 | 95 | 130 |
| +4,69% | 8 | 100 | 130 |
| +4,69% | 8 | 105 | 130 |
| +4,69% | 8 | 95 | 140 |
| +3,31% | 8 | 105 | 120 |
| +3,31% | 8 | 95 | 120 |
| +3,31% | 8 | 100 | 120 |
Interpretation of the result
You can see that all the combinations are winning. Thus, you can consider the test validated. To be validated, the test needs most combinations to perform positively. It would be good if more than 80% of the combinations were winning.
If the majority of the combinations are losing, your system is over-optimized. The risk is that your automated trading system will not tolerate a future market change. However, you probably have remarked that some combinations perform significantly lower than the initial result (3.31% against 7.36%).
It would be better to consider that the test is validated only if most of the combination gives a performance that is not significantly different from the initial performance. In this case, there are only three combinations that are not passed the test.
Generalization of the stochastic modeling
To facilitate your understanding of stochastic modeling, I told you that a little variation of the value of a variable implicated in the decision-making must not provoke a large variation in the system’s performance.
In reality, the system’s performance is not alone as a measurable metric. It is recommended to analyze all the system properties, such as drawdown, the volatility of performance, time in the market, etc.
Thus, we can generalize the stochastic modeling in the below way:
(THAT IS ALSO MY POINT OF VIEW)
A little variation of internal and external properties of a system shall not cause a large variation of its global behavior.
The limitations of the stochastic modeling
Each mathematical and machine learning model has limitations, and stochastic modeling does not escape the rule. The main limitation often comes from the decision threshold. A decision threshold is a value from which we consider whether the test has succeeded or failed. Stochastic modeling needs several metrics that could provoke decision-making problems. The most important thresholds are included in the definition of the model.
The first comes from the definition of a “little variation“. This definition is too approximative to be directly used in a decision-making process. A « little variation » could also be 0.1% than 5%. To resolve this problem, I often chose the next lowermost unit variation from the initial value.
For example, I will choose 1 point of variation for a value between 10 and 100, 10 points for a value between 100 and 1000, etc. I am sorry cause I do not have a consistent model for this weakness.
You will have the same difficulty defining what a “large variation is”. You will have to define an adapted acceptance threshold for your strategy.
The third limitation concerns the percentage of combinations having a result significantly different from the initial result for the same reasons.
This threshold problem concerns most mathematical and machine learning models, making it challenging to use them in reality. These models can only aid decision-making, and you should ensure that the obtained result is exploitable.
Stochastic modeling summary
- This is a stress test that allows us to validate the robustness of a system.
- This test can detect if a strategy is partially or totally over-optimized.
- The test verifies that the system has a sufficient degree of liberty to accept a change in the environment.
- This test can be generalized to all the properties of a system.
- The validity of the result depends on the chosen decision-making thresholds.
Resources about Stochastic modeling
You will find out some other explanations of stochastic modeling by following links :
Investopedia
https://www.investopedia.com/terms/s/stochastic-modeling.asp
Corporate Finance Institute
https://corporatefinanceinstitute.com/resources/knowledge/other/stochastic-modeling/
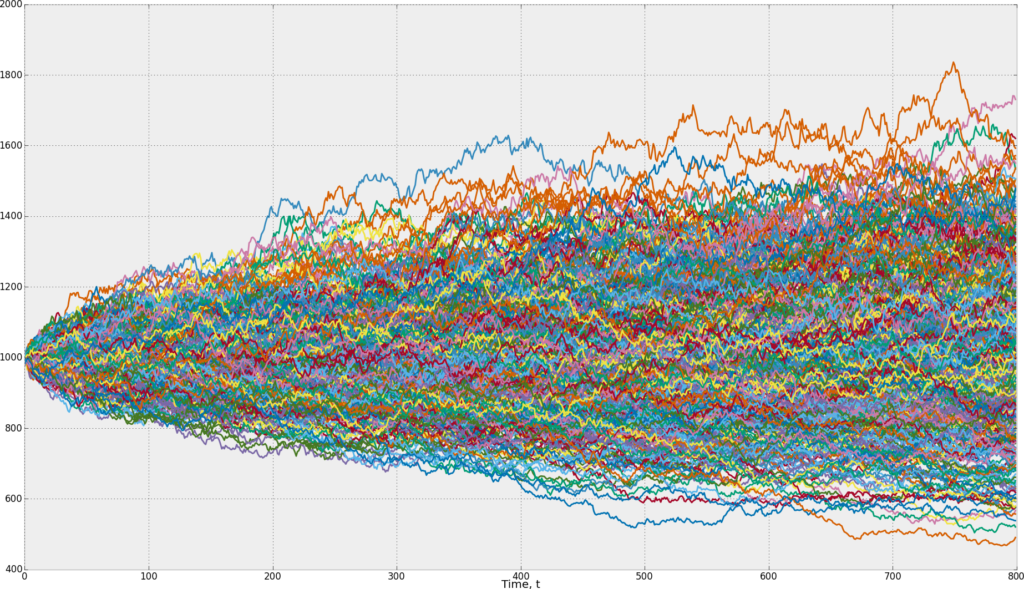
NivedRajeev, CC BY-SA 4.0 https://creativecommons.org/licenses/by-sa/4.0, via Wikimedia Commons
Range Breakout Indicator for Prorealtime

The Range Breaker will help you trade the Range Breakouts on Prorealtime. It displays the ranges, breakout signals, and target prices on your chart.


