Benefit from the bullish acceleration
The stock you have scrutinized for months has just broken a high. You had hesitated, expecting an entry point, and now it’s too late. But is it too late to buy? The highest breakout is certainly the simplest and result-driven signal you should know. It will help you benefit from the bullish acceleration.
In this post, I will discuss the highest breakout strategy. I will present the code for an indicator and its backtests, enabling the automation of this strategy on Prorealtime. You will learn how to set up the highest breakout strategy for stocks, ETFs, and indexes.
What is the highest breakout?
The highest breakout occurs when the price closes above its highest point. The highest breakout strategy involves buying the market when the price breaks its previous high. This strategy is simple, but there are some subtleties. It is necessary to distinguish between the historical highest and the last highest.
Historical highest
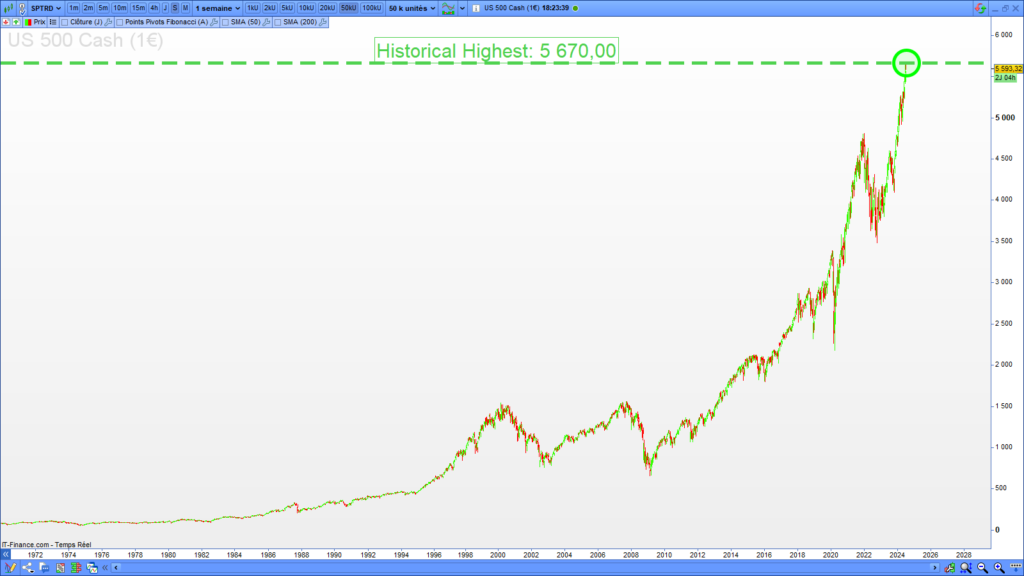
The historical high represents the highest price an asset has achieved since its initial public offering. A historical high breakout is rare in a cyclical asset but frequent in a growth stock.
The following picture shows the historical high of the S&P 500 since its creation:
Latest highest
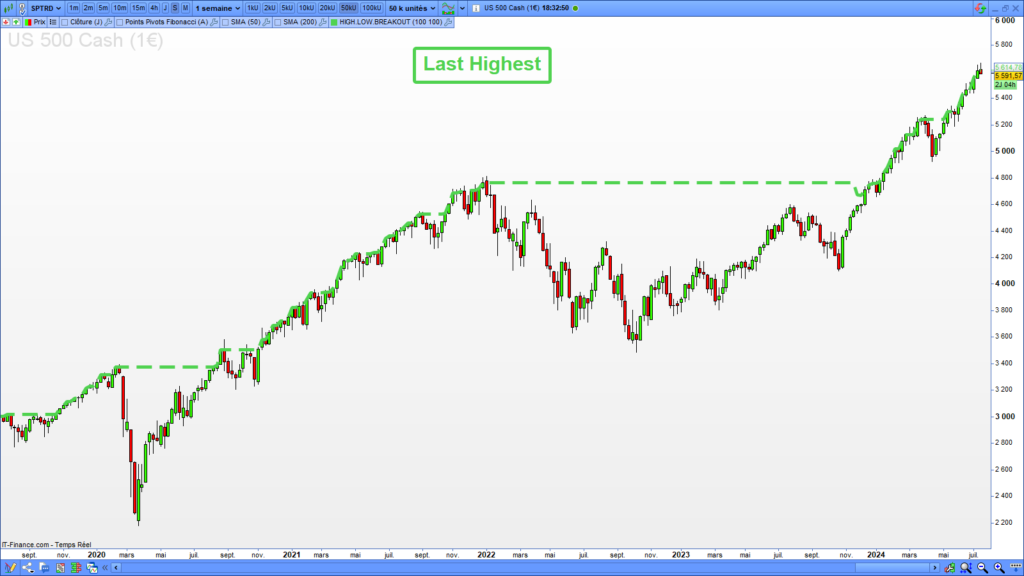
The latest highest corresponds to the highest price in a period, which can be a hundred candles or 52 weeks.
The following picture shows the latest high of the S&P 500 on 100 candles:
What is the “highest” to choose in a breakout strategy?
You will use the latest high to build the highest breakout strategy. You will need to determine the calculation period to detect the highest breakout. Habitually, the best periods are 50, 100, and 200 candles.
Highest breakout indicator
I will present you with an indicator that detects the highest breakouts on any asset in any time unit. It will return a buying signal when the price breaks up the highest of a determined period.
Code of the highest breakout detection
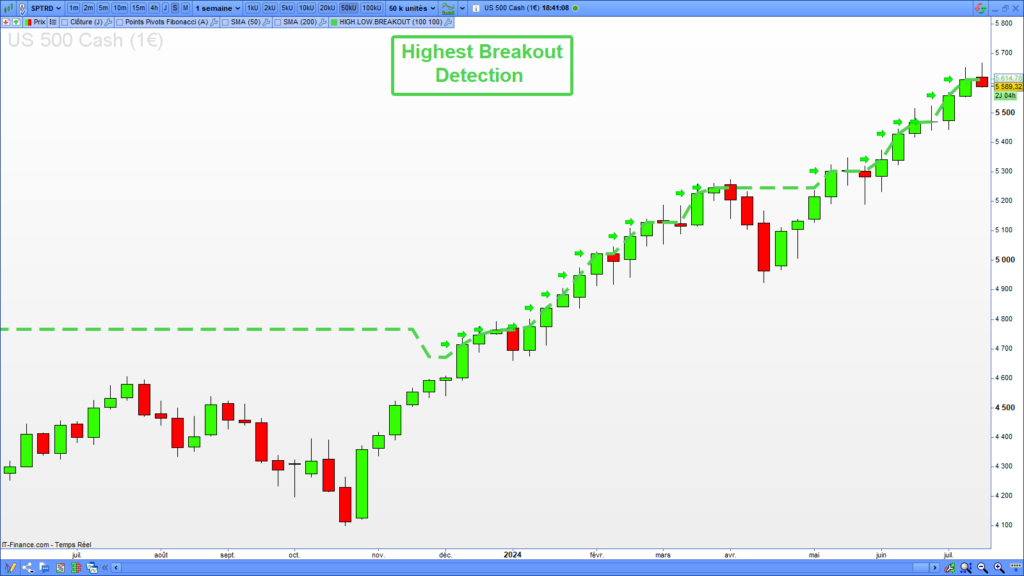
You can run the source code of this indicator on the Prorealtime platform. It will display a green arrow when the price breaks up the highest of a 100-candle period:
// Highest breakout calculation periode
HighBreakoutLength = 100

// Highest breakout detection
isHighBreakout = close > highest[HighBreakoutLength][1]

// Highest breakout drawing
IF isHighBreakout THEN
  DRAWARROW(barindex-1, close) COLOURED(0, 255, 0, 255)
ENDIF

RETURN highest[HighBreakoutLength] as "Highest", lowest[LowBreakoutLength] as "Lowest"
Example of the highest breakout detections
Here are examples of 100-candle highest breakouts on the S&P 500 in the weekly timeframe:
Backtest of the highest breakout strategy
Now, I will backtest the highest breakout strategy using the ProOrder interface provided by the Prorealtime platform. I will implement the indicator in a backtest to automate the buying and selling orders.
Code of the highest breakout backtest
The following code will open a long entry each time the price breaks up to the highest level over a period of 50 candles. The system will open positions for a value of 10000€, place a stop order at 15%, and a target at 20%:
// * Highest Breakout Strategy
// Risk Management
capital = 10000
numberOfContracts = ROUND(capital/close, 2)
stoplossPercent = 15
targetPercent = 20

// Highest Breakout Signal
highestPeriod = 50
HighestBreakout = close > highest[highestPeriod][1]

IF NOT LongOnMarket AND HighestBreakout THEN
BUY numberOfContracts CONTRACTS AT MARKET
  SET STOP %LOSS stoplossPercent
  SET TARGET %PROFIT targetPercent
ENDIF
Result of the highest breakout backtest
Here is the result of the highest breakout backtest run on the Nasdaq in the 4-hour timeframe. This strategy made 12,877€ with a success rate of 65%. The drawdown is relatively low compared to the runup.
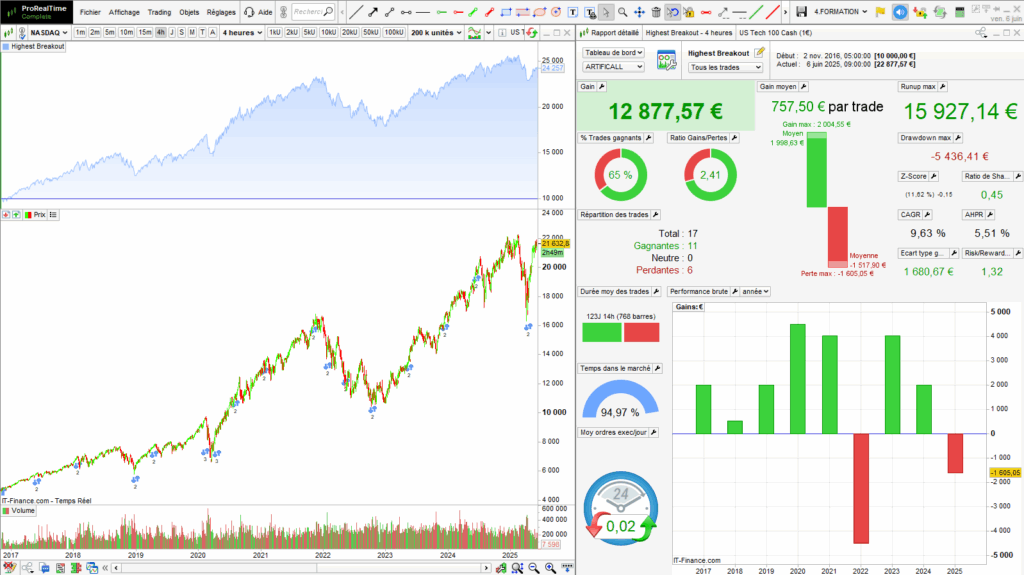
Detailed report
You can download the detailed report to obtain more information about the position price, size, and the transaction date:
Optimization of the highest breakout strategy
The highest breakout strategy performs well, but it can be further improved. Several methods can enhance trading strategies. In the case of a breakout strategy, the volume increases.
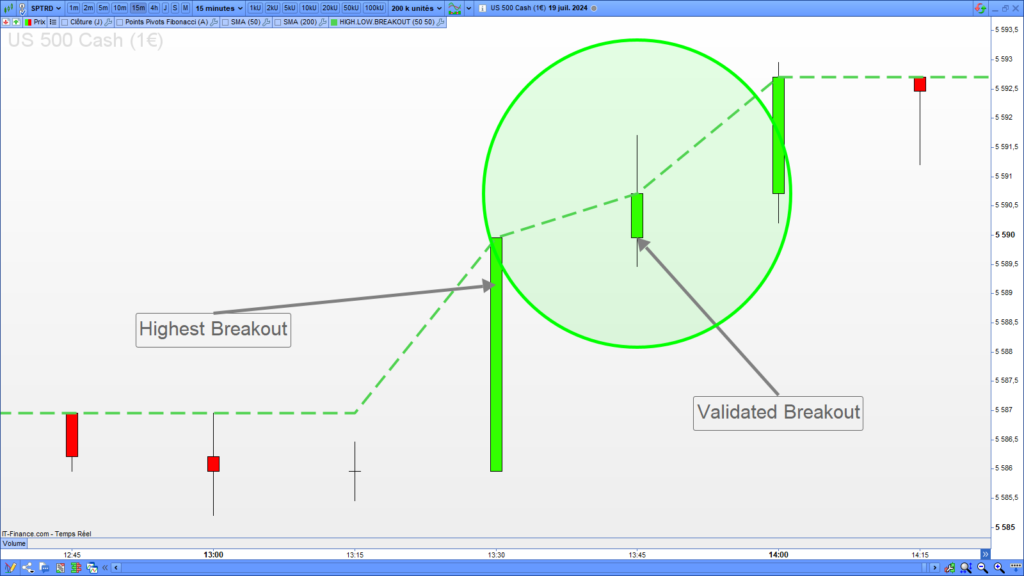
Breakout validation
Validating the breakout of a high, range, or another pattern is an excellent way to eliminate false signals. A breakout is validated when the candle following the breakout closes in the same direction. A bullish breakout is validated if the next candle closes above the breaking candle. In this case, the buying signal is confirmed.
The following picture shows the validated highest breakout:
The following source code checks the highest breakout validation:
// Validated Highest Breakout Signal
highestPeriod = 50
HighestBreakout = close[1] > highest[highestPeriod][2] AND close > close[1]
Trend filter
It is essential to follow the trend to improve your trading performance. Buying a bull market or selling a bear market will significantly increase your success rate. Implementing a trend filter can eliminate long entry openings in a bear market.
The following picture shows a linear regression line reflecting the trend:
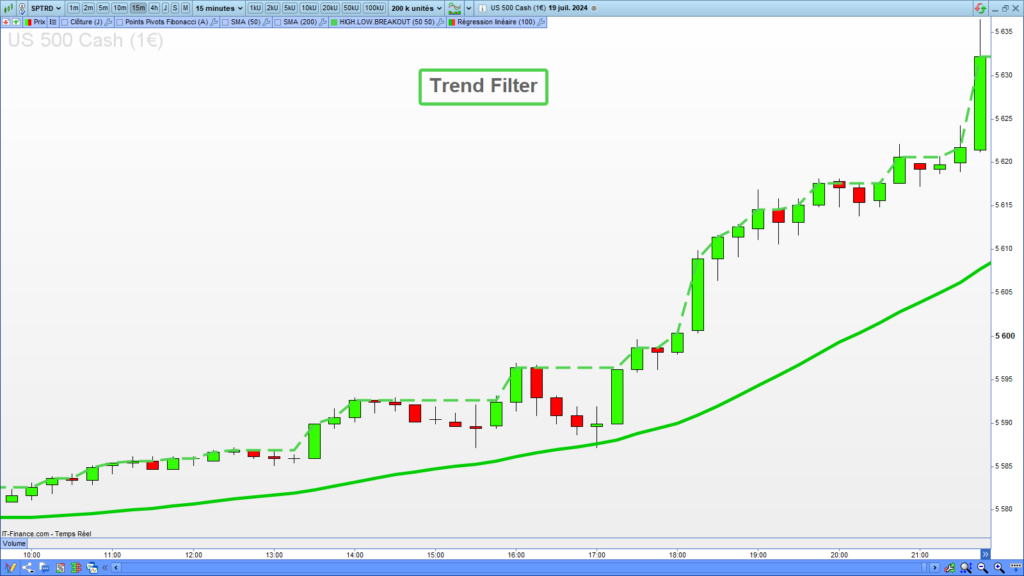
The following source code will check the trend on 100 candles, which is bullish:
// Trend filter
trend = LinearRegressionSlope[100](close) > 0
Volume increase
The increase in volume during a breakout expresses a consensus about the signal’s validity. Substantial volumes associated with a bullish breakout suggest that many traders believe the price will rise. Ensuring the volume increases during a breakout is an excellent way to validate the signal.
The following picture shows an increase in volume occurring with the highest breakout:
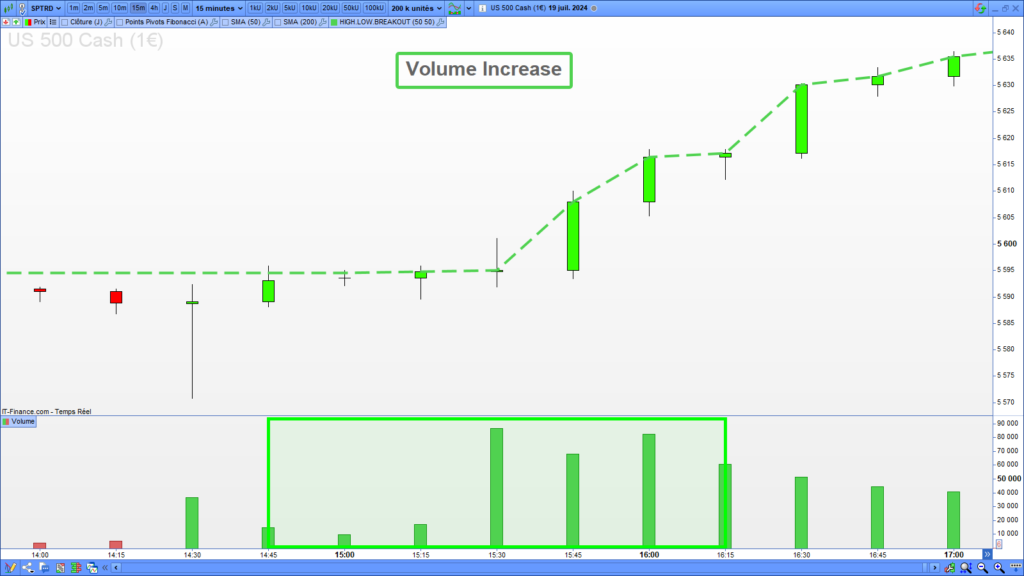
The following source code will check the volume increases on the last ten candles:
// Volume filter
volumeIncreases = LinearRegressionSlope[10](Volume) > 0
Code of the improved highest breakout strategy
The following source code implements the three enhancing filters I presented. The strategy will open long entries after a validated highest breakout in an uptrend with strong volumes:
// * Highest Breakout Strategy with a Trend and Volume Filter
// Risk Management
capital = 10000
numberOfContracts = ROUND(capital/close, 2)
stoplossPercent = 15
targetPercent =  20

// Validated Highest Breakout Signal
highestPeriod = 50
HighestBreakout = close[1] > highest[highestPeriod][2] AND close > close[1]

// Trend filter
trend = LinearRegressionSlope[100](close) > 0

// Volume filter
volumeIncreases = LinearRegressionSlope[10](Volume) > 0

Filters = trend and volumeIncreases

IF NOT LongOnMarket AND HighestBreakout AND Filters THEN
BUY numberOfContracts CONTRACTS AT MARKET
  SET STOP %LOSS stoplossPercent
  SET TARGET %PROFIT targetPercent
ENDIF
Result of the optimized highest breakout backtest
Here is the result of the improved highest breakout strategy, run on the Nasdaq in the 4-hour timeframe. This strategy made 15,473€ with a success rate of 77%, which is greater than the previous backtest. Besides, the drawdown is significantly lower than the previous backtest.
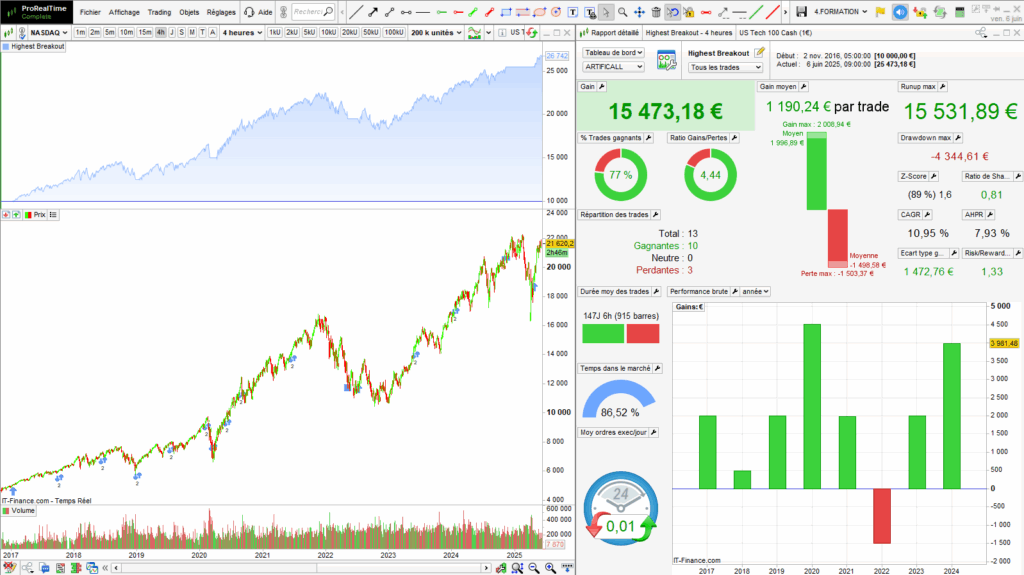
To obtain the previous result, I executed the code of the optimized highest breakout strategy I provided above. The strategy opens entry for an amount of 10,000$ without reinvesting the gains. It does not accumulate positions. It places a stoploss at 15% and a target at 20%. I ran these backtests from 2017 to 2024.
You can copy-paste the previous code into the ProBuilder interface of the Prorealtime platform. You will obtain more information about entries, including the execution price, closing price, and date.
Detailed report
You can download the detailed report to obtain more information about the position price, size, and the transaction date:
Highest breakout strategy summary
1. The highest breakout strategy is undoubtedly the simplest to set up. It can be run on any asset at any time unit.
2. The most favorable calculation periods are 50, 100, and 200 candles.
3. You can improve the strategy’s performance by validating the signal and applying a trend and volume filter.
4. The advantage of this strategy is that it will send many buying signals in bull markets and few in bear markets.
5. I consider the highest breakout a good trading strategy for junior and confirmed traders.
Range Breakout Indicator for Prorealtime
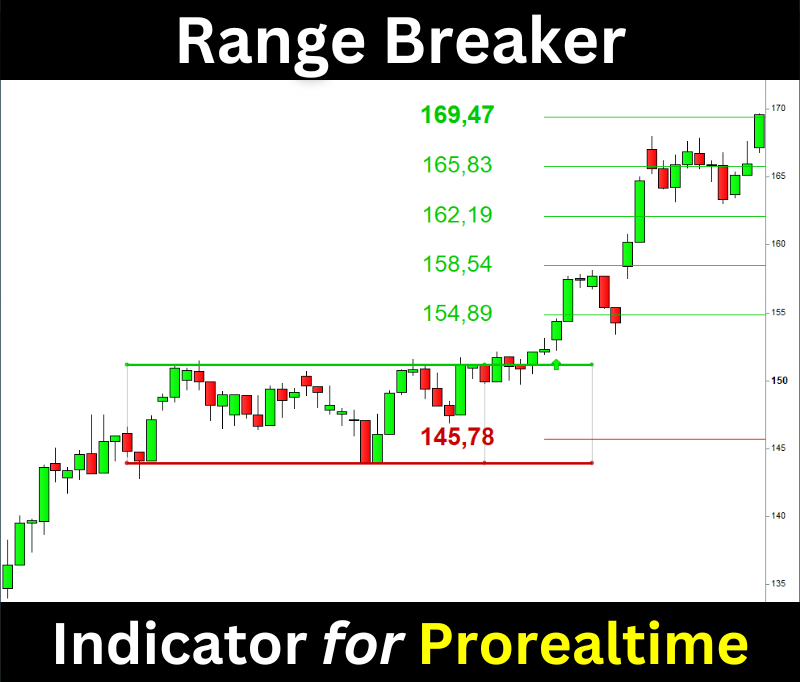
The Range Breaker will help you trade the Range Breakouts on Prorealtime. It displays the ranges, breakout signals, and target prices on your chart.