Benefit from the bullish reversal
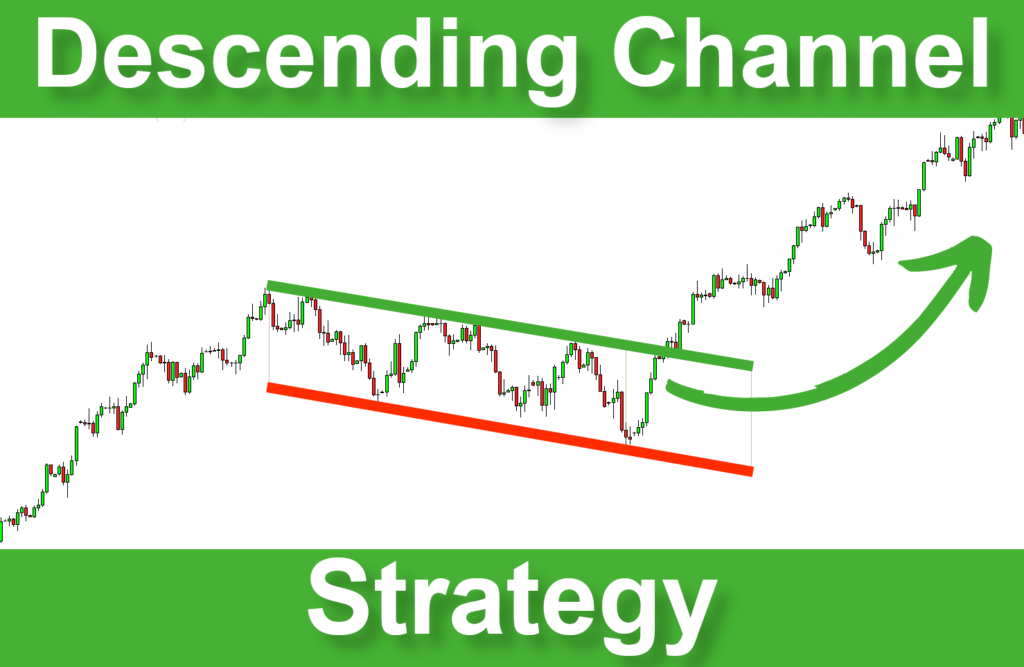
In the world of technical analysis, chart patterns play a crucial role in identifying potential trading opportunities. The Descending Channel is one of the most effective patterns I have practiced. This figure is a powerful tool for anticipating market reversals and capitalizing on price movements.
In this post, I will explore the Descending Channel Breakout Strategy, explaining how it works and how to use it to improve your trading performance.
What is a Descending Channel?
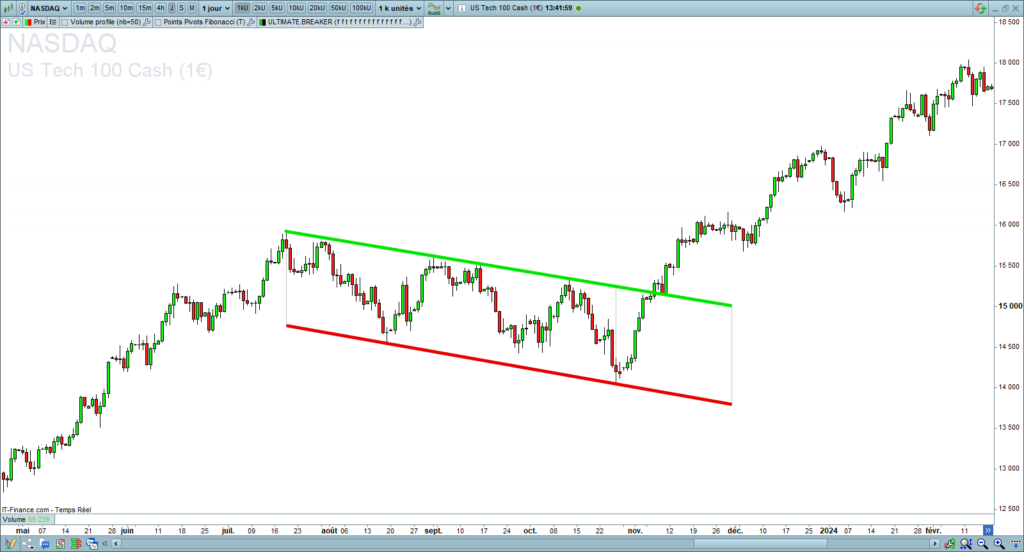
A descending channel is a chart pattern formed by two parallel trendlines that slope downward. The upper trendline connects a series of lower highs, while the lower trendline connects a series of lower lows. This pattern typically indicates a bearish trend as prices move down within the channel’s boundaries.
Here is a screenshot of a descending channel:
Descending Channel breakout
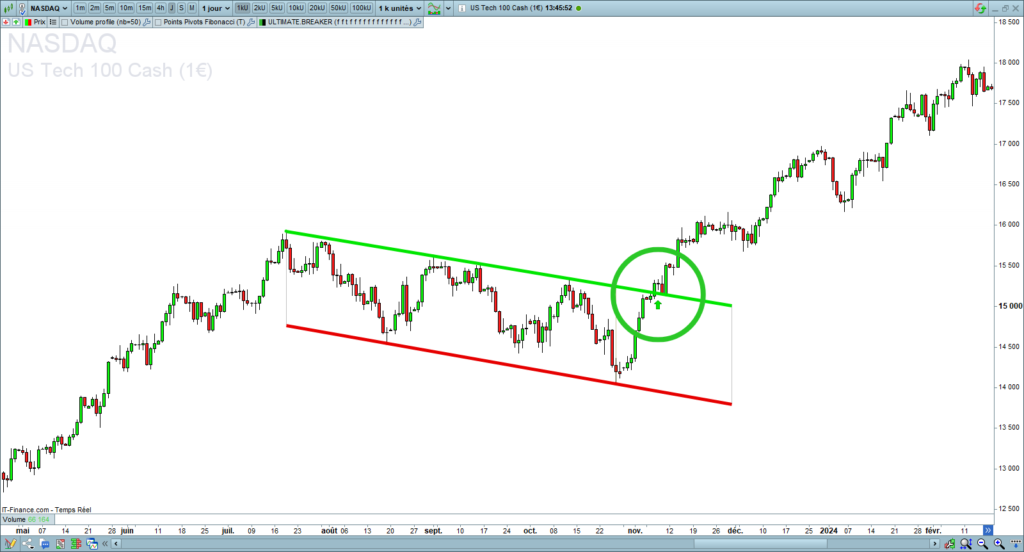
The price may break up the channel, signaling a potential trend reversal. The Descending Channel Breakout Strategy focuses on capturing profits when such a breakout occurs. The breakup of the descending channel’s top line allows you to open a long entry.
Here is a screenshot of a descending channel breakout:
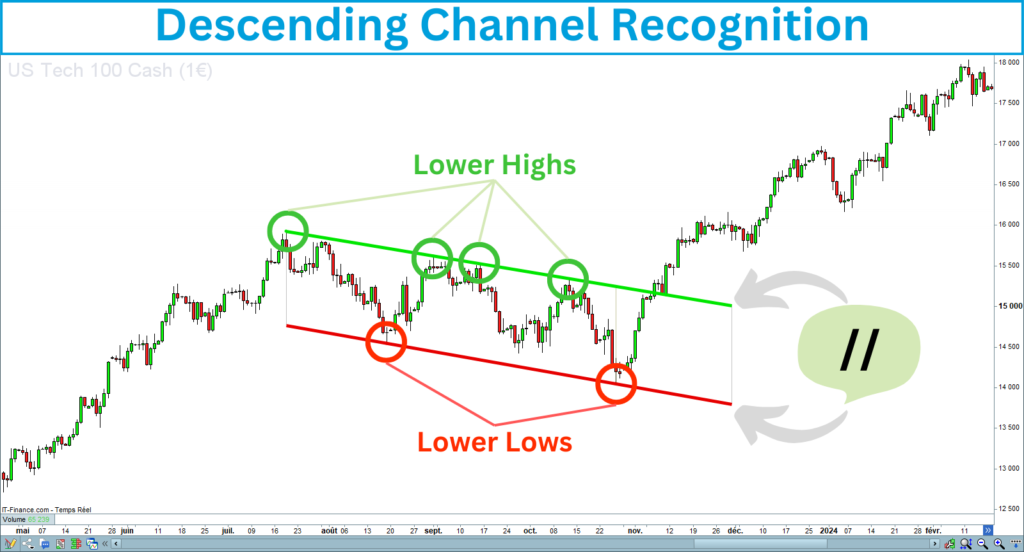
How to Identify a Descending Channel?
Descending channel properties
Before diving into the strategy, it’s essential to correctly identify a descending channel on the chart. Here are the key characteristics:
The following chart shows a descending channel meeting the previous criteria:
Channel inclination
As its name suggests, the descending channel is a descending figure, inducing a bearish bias. Opening a long entry in a bear market is very risky. That is why you need to review some details before opening the entry.
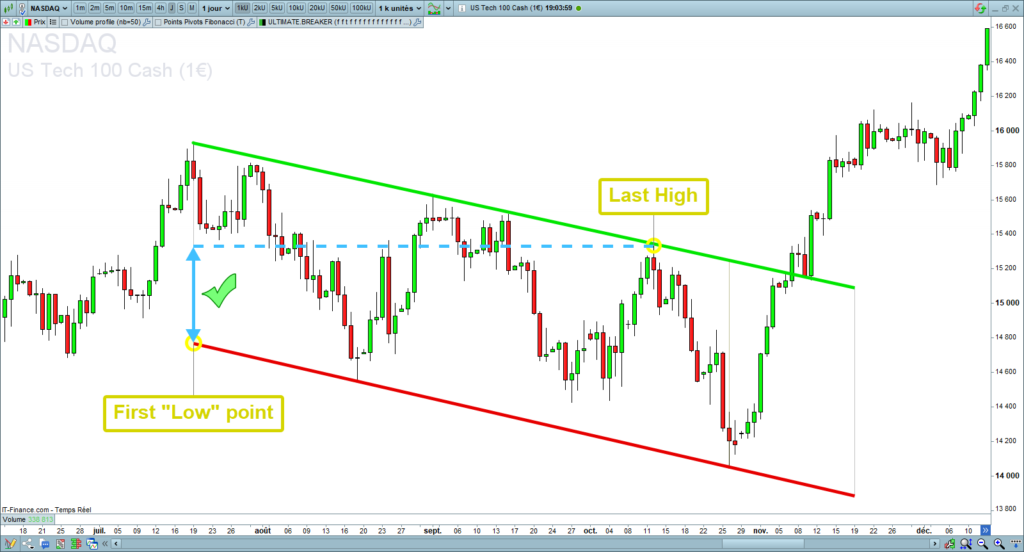
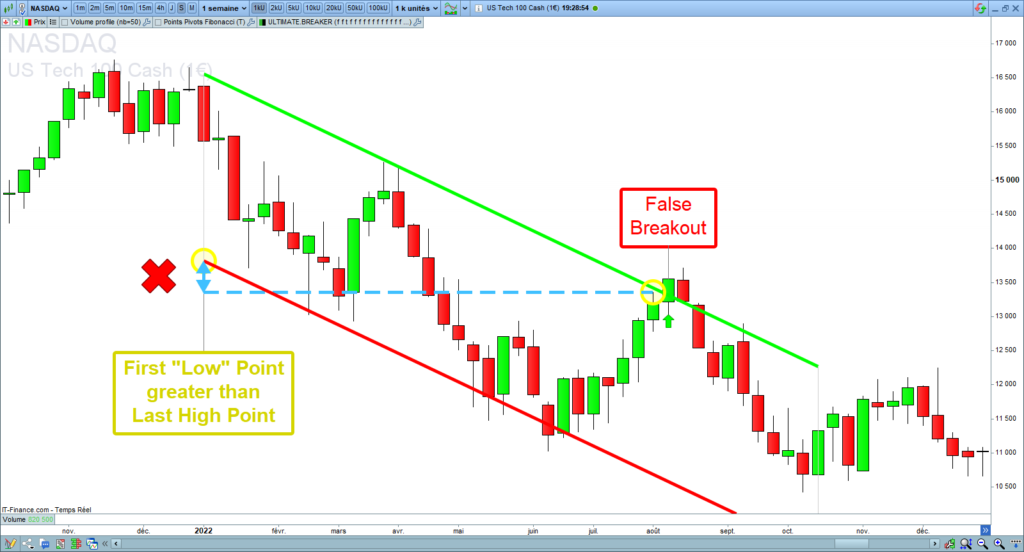
The channel line’s slope should not be too steep. A good way to verify the channel inclination is to compare the last high with the first low. Verifying that the last highest is greater than the first lowest is crucial. The following screenshots illustrate this comparison you must control:
Correct descending channel
The last high is greater than the first low point of the descending channel, meaning the channel is not too descending:
Incorrect descending channel
The last high is lower than the first low point of the descending channel, meaning the channel is too steeply descending:
Long-term uptrend
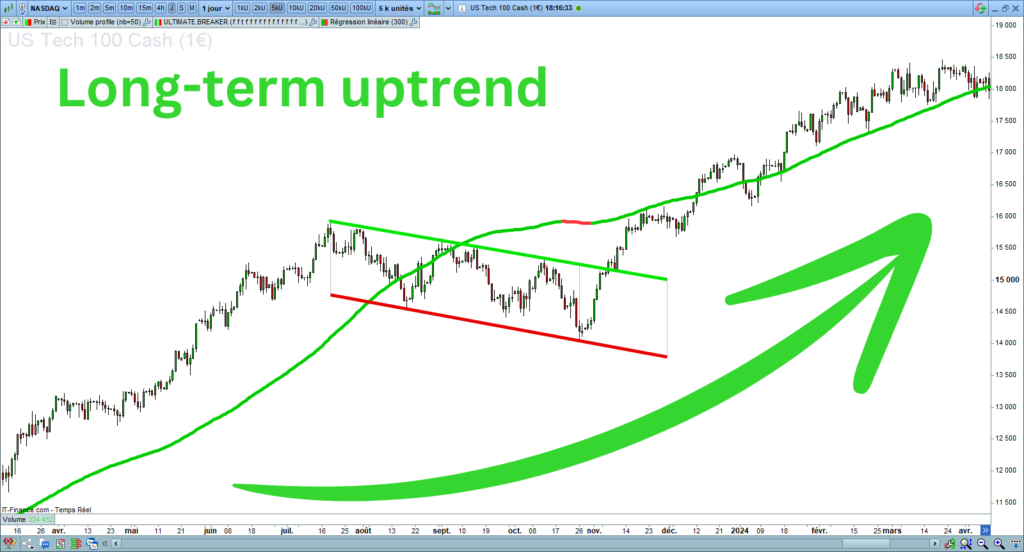
It is imperative to check the long-term uptrend before opening a long entry. You can verify whether the slope of a trend indicator is positive. Numerous trend indicators, such as moving averages or linear regressions, enable the measurement of market trends.
The most important is the periodicity of the trend calculation. You should determine the trend period between two and three times the figure length. For example, if you watch a 100-candle descending channel, you must evaluate the trend on 200 or 300 candles.
The following chart shows the descending channel that occurred in a long-term uptrend. The line represents a linear regression calculated on 300 periods:
The Descending Channel Breakout Strategy
Now that you know how to recognize the descending channel pattern, let’s break down the strategy step by step.
The seven steps of the descending channel strategy
1. Identify the Channel
Start by spotting a well-defined descending channel on your chart. The channel should be clear, and the price should move consistently between the two trendlines.
2. Wait for a Breakout
Patience is crucial in trading. You must never anticipate a signal. Monitor the price as it approaches either trendline. A breakout occurs when the price closes above the upper trendline of the descending channel. It is a bullish signal, indicating that the downward trend may be reversing.
3. Confirm the Breakout
Not all breakouts lead to a new trend. To avoid false breakouts, wait for confirmation before proceeding. The simplest way to confirm a breakout is to wait for the candle following the breakout to close above the descending channel uptrend line.
This could manifest as an increase in volume, a strong bullish candlestick pattern (such as a bullish engulfing or a hammer), or a retest of the broken trendline as new support.
4. Enter the Trade
Once you have confirmation, it’s time to enter the trade. Several schools of thought propose different approaches to opening an entry. Some use limit orders above the current price, others use stop orders below the current price, or trigger range orders. It is not the subject of this post.
I use two ways to enter a trade, depending on the security:
- Liquid Security: If I operate in a most-traded asset with high volumes, I directly place an order at the market price.
- Illiquid Security: If I operate in a thick market or an illiquid asset, I prefer to place a stop order under the latest price and gradually increase it until the order is executed.
5. Set a Stop-Loss
Setting a stop-loss order will help you limit potential losses if the breakout fails to materialize. The best stop-loss position depends on your trading style.
- If you place the stop-loss near your entry price, like below the breakout candle’s low, you will lose little money on each trade but risk having many of your positions stopped.
- If you place the stop-loss too low, you will have a high success rate but risk a big loss on each stopped position.
I proceeded to do many tests on the target position. Today, I consider the best stop-loss area below the descending channel’s downtrend line.
6. Define Your Target
The simplest way to evaluate where to place the target after a figure breakup is to consider the figure height. You can project upwards several times the figure height from the latest highest point of the figure. Regarding stop-loss, I conducted numerous tests on the target position and found that the most reliable target position is between three and four times the descending channel’s height.
Alternatively, you can use key resistance levels or Fibonacci extensions to determine your target. The more you operate in little time units, the more you will encounter resistance levels before reaching your initial target.
7. Manage the Trade
As the trade progresses, consider trailing your stop-loss to lock in profits as the price moves in your favor. It is better to wait until the price touches a key resistance level before placing your trailing stop order. Each time the price breaks above a key level, you can adjust your stop order to some points below it.
In this way, you secure your latent profits and keep the possibility of increasing your gains if the market continues to grow.
Example of a Descending Channel Breakout trade
The following example shows a magnificent descending channel that occurred on the Nasdaq in the daily time unit in 2023:
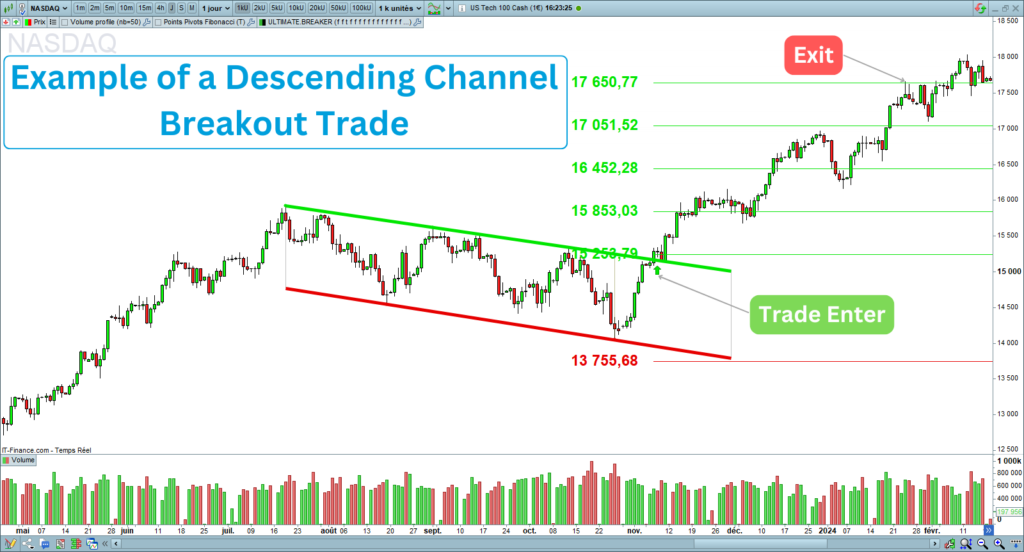
Here is why this descending channel breakout was perfect:
- The descending channel was not too bearish.
- The price consistently moved between the two trendlines.
- The price remained compressed between the two channel lines.
- Buyer volumes occurred before the breakout.
- The breakout has been confirmed.
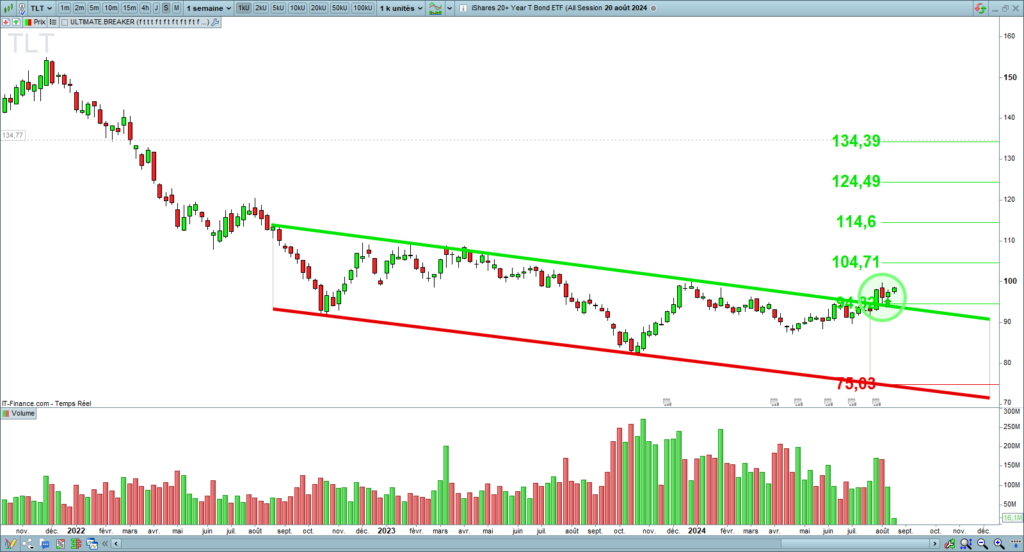
My last descending channel trade
I started building a position on the U.S. Treasury bond at the end of 2023, betting on the economy’s weakness. I strengthened my position after the confirmed breakup of a weekly descending channel on the TLT.
The channel is not too descending, substantial buyer volumes exist, and the breakout is validated:
Tips for Success with the Descending Channel Strategy
Here are some tips you should keep in mind before entering a trade on a descending channel breakout:
Descending Channel Strategy Summary
The Descending Channel Breakout Strategy is a powerful technique for traders seeking to capitalize on market reversals and trend resuming. It is one of my preferred trading strategies.
By identifying a descending channel and waiting for a confirmed breakout, you can enter trades with a higher probability of success. Remember to manage your risk, stay patient, and continuously refine your approach.
With practice and discipline, this strategy can become a valuable addition to your trading toolkit.
If you are interested in the descending channel strategy, I created an indicator that recognizes this pattern. It draws trend lines, detects breakouts, and displays the target and stop-loss.
The indicator is available on the marketplace of Prorealcode on this page:
https://market.prorealcode.com/product/ultimate-breaker
I wish you good trades 😊