In today’s fast-evolving technology landscape, The Trade Desk, Inc. (TTD) and ServiceTitan, Inc. (TTAN) stand out as innovative leaders in application software. Both companies serve distinct yet overlapping markets—digital advertising technology for TTD and field service management software for TTAN—highlighting unique growth and innovation strategies. This article will analyze their strengths to help you determine which is the more compelling investment opportunity in 2026.
Table of contents
Companies Overview
I will begin the comparison between The Trade Desk and ServiceTitan by providing an overview of these two companies and their main differences.
The Trade Desk Overview
The Trade Desk, Inc. operates a self-service cloud-based platform that enables buyers to create, manage, and optimize data-driven digital advertising campaigns across multiple ad formats and channels, including display, video, audio, native, and social. Founded in 2009 and headquartered in Ventura, California, The Trade Desk serves advertising agencies and service providers globally, positioning itself as a technology leader in the digital advertising industry.
ServiceTitan Overview
ServiceTitan, Inc. focuses on software solutions for field service management related to the installation, maintenance, and servicing of infrastructure in residential and commercial buildings. Founded in 2008 and based in Glendale, California, ServiceTitan caters to businesses requiring operational efficiency in their field service activities, operating primarily within the technology sector as a specialized application software provider.
Key similarities and differences
Both The Trade Desk and ServiceTitan operate in the technology sector, specifically in software application development. They are headquartered in California and serve business clients, but their core markets differ: The Trade Desk targets digital advertising with a data-driven platform, while ServiceTitan specializes in field service management software. Their business models reflect these distinctions, with The Trade Desk focusing on advertising campaign optimization and ServiceTitan on operational software for service companies.
Income Statement Comparison
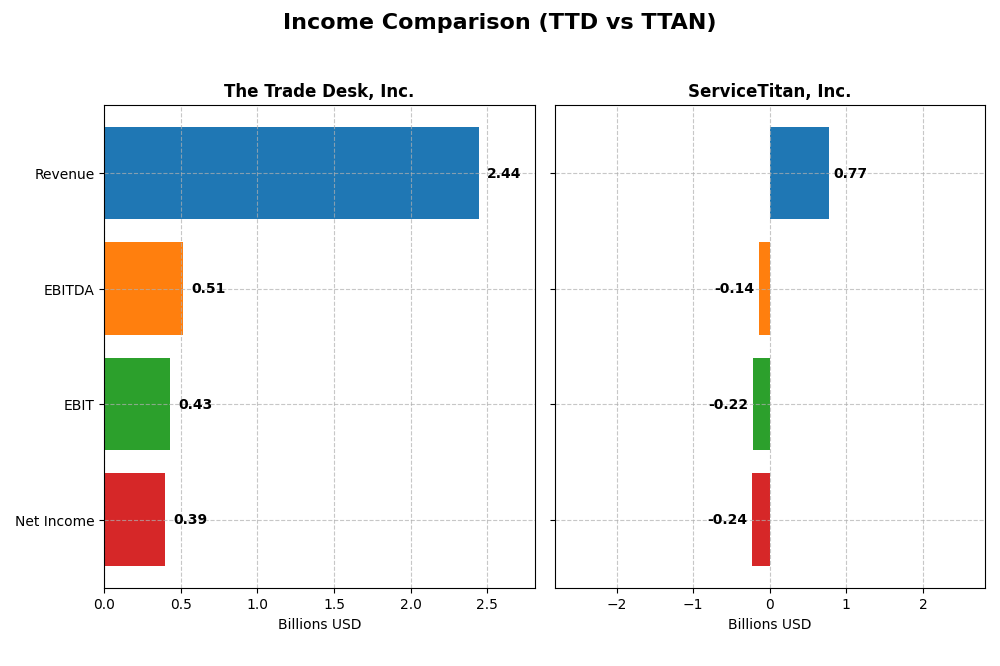
This table compares the most recent full fiscal year income statement metrics for The Trade Desk, Inc. and ServiceTitan, Inc., reflecting their financial performance side by side.
| Metric | The Trade Desk, Inc. (TTD) | ServiceTitan, Inc. (TTAN) |
|---|---|---|
| Market Cap | 17.3B | 8.5B |
| Revenue | 2.44B | 771.9M |
| EBITDA | 515M | -141M |
| EBIT | 427M | -221M |
| Net Income | 393M | -239M |
| EPS | 0.80 | -8.53 |
| Fiscal Year | 2024 | 2025 |
Income Statement Interpretations
The Trade Desk, Inc.
The Trade Desk, Inc. exhibited strong revenue growth from 2020 to 2024, with 2024 revenue reaching $2.44B, up 25.6% from 2023. Net income also rose significantly, hitting $393M in 2024. Margins remained robust, with a gross margin of 80.7% and a favorable net margin of 16.1%. The latest year showed marked improvements in profitability and EPS growth.
ServiceTitan, Inc.
ServiceTitan, Inc. recorded steady revenue increases, reaching $772M in 2025, a 25.6% rise from 2024. However, it continued to report net losses, with net income at -$239M in 2025. While gross margin was a favorable 64.9%, EBIT and net margins remained negative, reflecting ongoing challenges in profitability despite top-line growth.
Which one has the stronger fundamentals?
The Trade Desk demonstrates stronger fundamentals with consistent growth, positive and improving margins, and profitability. ServiceTitan shows promising revenue expansion but struggles with negative earnings and margins. The Trade Desk’s favorable income statement metrics contrast with ServiceTitan’s mixed results, indicating a more solid financial foundation for The Trade Desk.
Financial Ratios Comparison
Below is a comparison of key financial ratios for The Trade Desk, Inc. (TTD) and ServiceTitan, Inc. (TTAN) based on their most recent fiscal year data.
| Ratios | The Trade Desk, Inc. (TTD) | ServiceTitan, Inc. (TTAN) |
|---|---|---|
| ROE | 13.3% | -16.4% |
| ROIC | 10.0% | -14.1% |
| P/E | 146.8 | -18.1 |
| P/B | 19.6 | 3.0 |
| Current Ratio | 1.86 | 3.74 |
| Quick Ratio | 1.86 | 3.74 |
| D/E | 0.11 | 0.11 |
| Debt-to-Assets | 5.1% | 9.4% |
| Interest Coverage | 0 | -14.8 |
| Asset Turnover | 0.40 | 0.44 |
| Fixed Asset Turnover | 5.17 | 9.57 |
| Payout Ratio | 0 | 0 |
| Dividend Yield | 0% | 0% |
Interpretation of the Ratios
The Trade Desk, Inc.
The Trade Desk shows a predominantly favorable ratio profile with strong net margin at 16.08% and a solid return on invested capital of 10.02%. However, valuation multiples like PE at 146.77 and PB at 19.56 are high, indicating potential overvaluation risks. The company does not pay dividends, likely focusing on growth and reinvestment.
ServiceTitan, Inc.
ServiceTitan faces multiple unfavorable ratios, including a negative net margin of -30.98% and negative returns on equity and invested capital, reflecting operational losses. Its current ratio is very high but flagged unfavorable, possibly indicating inefficiency. Like The Trade Desk, it pays no dividends, likely due to reinvestment and growth priorities.
Which one has the best ratios?
The Trade Desk has the more favorable overall ratio structure, with a majority of positive financial metrics and healthier profitability indicators. ServiceTitan’s ratios suggest challenges with profitability and cash flow, leading to a slightly unfavorable ratio evaluation despite some strong individual metrics.
Strategic Positioning
This section compares the strategic positioning of The Trade Desk and ServiceTitan, including market position, key segments, and exposure to technological disruption:
The Trade Desk
- Operates a competitive digital advertising platform globally, facing high industry competition.
- Focuses on self-service cloud-based advertising with various ad formats and channels.
- Positioned in a technology-driven market with ongoing digital ad innovations and data reliance.
ServiceTitan
- Provides software for field service management, targeting residential and commercial sectors.
- Revenue driven by platform and subscription services for field service activities.
- Operates in a technology niche supporting infrastructure and system maintenance services.
The Trade Desk vs ServiceTitan Positioning
The Trade Desk offers a diversified global advertising platform, while ServiceTitan concentrates on field service software. The Trade Desk’s broad ad formats contrast with ServiceTitan’s focused subscription and platform revenue, reflecting different market scopes and operational focuses.
Which has the best competitive advantage?
Both companies are currently shedding value, with The Trade Desk showing slightly unfavorable profitability and ServiceTitan an unfavorable status. Neither demonstrates a strong economic moat based on recent ROIC compared to WACC evaluations.
Stock Comparison
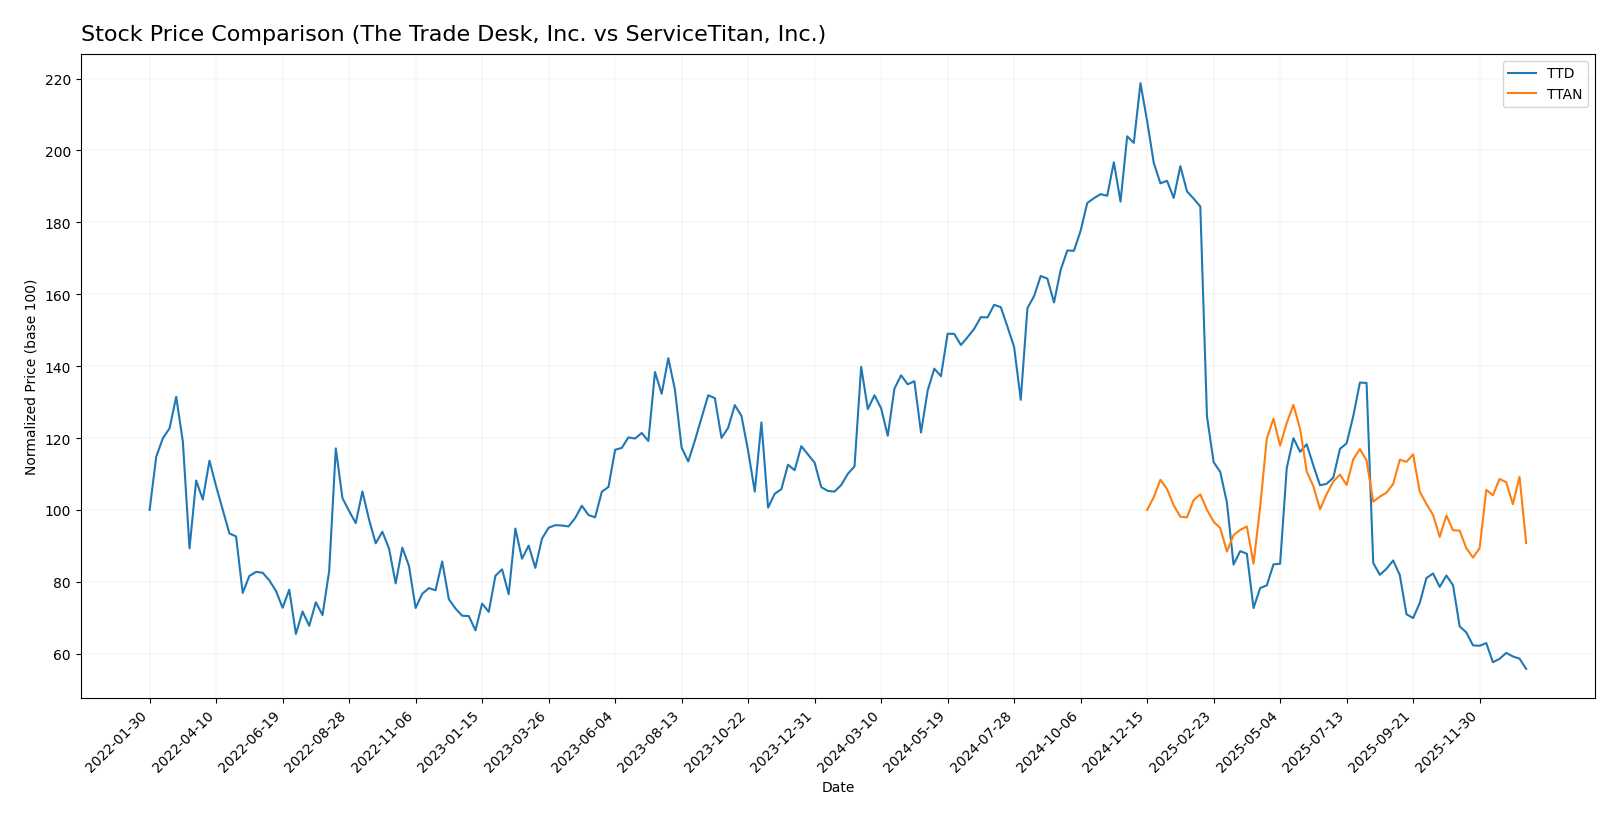
The past year saw both The Trade Desk, Inc. and ServiceTitan, Inc. experience notable price declines with distinct trading dynamics and trend accelerations shaping their stock performances.
Trend Analysis
The Trade Desk, Inc. exhibited a bearish trend over the past 12 months, with a price decline of 56.43%, decelerating and marked by high volatility at a 28.36 std deviation, hitting a high of 139.11 and a low of 35.48.
ServiceTitan, Inc. also followed a bearish trend with a 9.22% drop over the same period, but with accelerating downward momentum and moderate volatility at 9.86 std deviation, reaching a high of 129.26 and a low of 85.07.
Comparing the two, ServiceTitan, Inc. delivered a higher relative market performance, experiencing a smaller percentage loss than The Trade Desk, Inc. over the analyzed year.
Target Prices
Analysts present a clear consensus on target prices for The Trade Desk, Inc. and ServiceTitan, Inc., indicating potential upside from current levels.
| Company | Target High | Target Low | Consensus |
|---|---|---|---|
| The Trade Desk, Inc. | 98 | 39 | 56.73 |
| ServiceTitan, Inc. | 145 | 117 | 132.44 |
The Trade Desk’s consensus target price (56.73) notably exceeds its current price of 35.48, suggesting room for growth. ServiceTitan’s target consensus (132.44) is significantly above its current price of 90.78, reflecting strong analyst optimism.
Analyst Opinions Comparison
This section compares analysts’ ratings and financial scores for The Trade Desk, Inc. and ServiceTitan, Inc.:
Rating Comparison
The Trade Desk, Inc. Rating
- Rating: B, indicating a very favorable overall evaluation.
- Discounted Cash Flow Score: 4, a favorable valuation score.
- ROE Score: 4, showing efficient profit generation from equity.
- ROA Score: 4, demonstrating effective asset utilization.
- Debt To Equity Score: 3, a moderate financial risk level.
- Overall Score: 3, representing a moderate overall standing.
ServiceTitan, Inc. Rating
- Rating: C-, also described as very favorable overall.
- Discounted Cash Flow Score: 1, indicating very unfavorable valuation.
- ROE Score: 1, reflecting very unfavorable profitability.
- ROA Score: 1, indicating very unfavorable asset use.
- Debt To Equity Score: 3, also moderate financial risk.
- Overall Score: 1, signifying very unfavorable overall standing.
Which one is the best rated?
Based strictly on the provided data, The Trade Desk, Inc. holds a stronger position with higher scores in discounted cash flow, ROE, ROA, and overall score. ServiceTitan, Inc. scores notably lower except for a similar debt-to-equity score.
Scores Comparison
Here is a comparison of the financial scores for The Trade Desk, Inc. and ServiceTitan, Inc.:
TTD Scores
- Altman Z-Score: 4.30, indicating financial safety in the safe zone.
- Piotroski Score: 5, reflecting average financial strength.
TTAN Scores
- Altman Z-Score: 15.74, indicating strong financial safety in the safe zone.
- Piotroski Score: 6, reflecting average financial strength.
Which company has the best scores?
ServiceTitan (TTAN) has a significantly higher Altman Z-Score than The Trade Desk (TTD), indicating stronger financial safety. Its Piotroski Score is also slightly higher, though both companies show average financial strength by this measure.
Grades Comparison
The following is a comparison of recent grades and ratings from recognized financial institutions for the two companies:
The Trade Desk, Inc. Grades
This table summarizes recent grades given by major financial firms for The Trade Desk, Inc.:
| Grading Company | Action | New Grade | Date |
|---|---|---|---|
| Morgan Stanley | Maintain | Equal Weight | 2026-01-13 |
| Wells Fargo | Maintain | Equal Weight | 2026-01-12 |
| Cantor Fitzgerald | Maintain | Neutral | 2026-01-08 |
| Wolfe Research | Maintain | Outperform | 2026-01-06 |
| Guggenheim | Maintain | Buy | 2026-01-05 |
| Jefferies | Maintain | Hold | 2025-12-11 |
| Wedbush | Maintain | Neutral | 2025-12-08 |
| DA Davidson | Maintain | Buy | 2025-11-10 |
| Truist Securities | Maintain | Buy | 2025-11-07 |
| Wells Fargo | Maintain | Equal Weight | 2025-11-07 |
The Trade Desk has a mixed set of grades ranging from Hold and Neutral to Buy and Outperform, with a consensus rating of Buy.
ServiceTitan, Inc. Grades
This table presents the latest grades from reputable firms for ServiceTitan, Inc.:
| Grading Company | Action | New Grade | Date |
|---|---|---|---|
| Piper Sandler | Maintain | Overweight | 2025-12-05 |
| BMO Capital | Maintain | Outperform | 2025-12-05 |
| TD Cowen | Maintain | Buy | 2025-12-05 |
| Morgan Stanley | Maintain | Equal Weight | 2025-12-05 |
| BMO Capital | Maintain | Outperform | 2025-11-20 |
| Wells Fargo | Maintain | Overweight | 2025-09-19 |
| Stifel | Maintain | Buy | 2025-09-19 |
| Piper Sandler | Maintain | Overweight | 2025-09-19 |
| Canaccord Genuity | Maintain | Buy | 2025-09-19 |
| Citigroup | Maintain | Neutral | 2025-09-09 |
ServiceTitan shows predominantly positive grades with multiple Buy, Outperform, and Overweight ratings, accompanied by an overall Buy consensus.
Which company has the best grades?
ServiceTitan, Inc. has received generally stronger grades, including several Outperform and Overweight recommendations, compared to The Trade Desk’s more mixed ratings. This suggests ServiceTitan may be viewed more favorably by analysts, potentially indicating stronger growth expectations or market positioning, which investors might consider in their risk assessments.
Strengths and Weaknesses
Below is a comparison of key strengths and weaknesses between The Trade Desk, Inc. (TTD) and ServiceTitan, Inc. (TTAN) based on their latest financial and operational data.
| Criterion | The Trade Desk, Inc. (TTD) | ServiceTitan, Inc. (TTAN) |
|---|---|---|
| Diversification | Moderate; focuses on digital advertising platforms | Moderate; revenue mainly from platform and subscription services |
| Profitability | Favorable net margin of 16.08%, positive ROIC (10.02%) but declining trend | Unfavorable net margin (-30.98%), negative ROIC (-14.11%), stable but value-destroying |
| Innovation | Strong in digital ad tech innovation but faces margin pressure | Growing innovation in SaaS for trades but profitability challenges remain |
| Global presence | Established global reach in advertising markets | Primarily North American focus with growth opportunities |
| Market Share | Significant in programmatic advertising but high valuation multiples (PE 146.77) may reflect optimism | Emerging player with growing platform revenue but negative earnings impact valuation |
The Trade Desk shows solid profitability and a favorable financial stance despite a slightly declining ROIC trend, indicating some caution on long-term competitive advantage. ServiceTitan still struggles with consistent profitability and value creation, though it demonstrates growth potential in SaaS platforms. Investors should weigh TTD’s higher valuation against its stable profitability and TTAN’s growth prospects against its current financial challenges.
Risk Analysis
Below is a comparative overview of key risks for The Trade Desk, Inc. (TTD) and ServiceTitan, Inc. (TTAN) based on the most recent data available for 2025-2026.
| Metric | The Trade Desk, Inc. (TTD) | ServiceTitan, Inc. (TTAN) |
|---|---|---|
| Market Risk | Moderate (Beta 1.11) | Low (Beta -0.85) |
| Debt Level | Low (Debt/Equity 0.11) | Low (Debt/Equity 0.11) |
| Regulatory Risk | Moderate (Tech sector focus) | Moderate (Field services) |
| Operational Risk | Moderate (Ad tech platform) | High (Negative margins, scaling challenges) |
| Environmental Risk | Low | Low |
| Geopolitical Risk | Moderate (Global ad markets) | Moderate (US-centric but exposed) |
The most impactful risks for TTD relate to market volatility and high valuation multiples, despite strong financial stability and low debt. TTAN faces higher operational risk due to significant losses and negative profitability metrics, posing a challenge to sustainable growth. Both companies have manageable debt levels and moderate exposure to regulatory and geopolitical factors.
Which Stock to Choose?
The Trade Desk, Inc. (TTD) shows a strong income evolution with 25.63% revenue growth in 2024 and favorable profitability ratios, including a 16.08% net margin and 10.02% ROIC. Its debt levels are low at 5.11% debt-to-assets, and the overall rating is very favorable (B), despite some unfavorable valuation multiples like high P/E and P/B ratios.
ServiceTitan, Inc. (TTAN) presents mixed financials with positive revenue growth of 25.64% but negative profitability, including a -30.98% net margin and -14.11% ROIC, indicating value destruction. Debt metrics remain manageable, and the rating is very favorable (C-), though with many unfavorable financial ratios and weaker income statement performance.
Investors with a tolerance for higher risk and a focus on growth might find TTD’s favorable income and ratio profile appealing, while those prioritizing financial stability could see TTAN’s recent improvements and manageable debt as potential, albeit less certain, opportunities given its unfavorable profitability and value metrics.
Disclaimer: Investment carries a risk of loss of initial capital. The past performance is not a reliable indicator of future results. Be sure to understand risks before making an investment decision.
Go Further
I encourage you to read the complete analyses of The Trade Desk, Inc. and ServiceTitan, Inc. to enhance your investment decisions: