Home > Analyses > Technology > The Trade Desk, Inc.
The Trade Desk reshapes how brands reach consumers by powering precision in digital advertising. Its cloud-based platform dominates data-driven campaigns across display, video, audio, and connected TV, enabling advertisers to optimize every impression. Known for relentless innovation and a robust ecosystem, it stands as a beacon in the ad tech space. Yet, as market dynamics evolve, I ask: does The Trade Desk’s current valuation reflect sustainable growth and competitive advantage?

Table of contents
Business Model & Company Overview
The Trade Desk, Inc., founded in 2009 and headquartered in Ventura, California, dominates the software application space for digital advertising. Its cloud-based platform forms a cohesive ecosystem that empowers buyers to create, manage, and optimize data-driven campaigns across display, video, audio, native, and social channels. This multi-format, multi-device approach fuels its core mission to streamline and enhance digital ad buying worldwide.
The company’s revenue engine blends software services with data-driven insights, serving advertising agencies and service providers globally across the Americas, Europe, and Asia. Its self-service model supports efficient campaign execution on computers, mobile devices, and connected TVs. The Trade Desk’s stronghold lies in its competitive advantage as a leader in programmatic advertising technology, shaping the future of digital marketing with a formidable economic moat.
Financial Performance & Fundamental Metrics
I analyze The Trade Desk, Inc.’s income statement, key financial ratios, and dividend payout policy to reveal its core profitability and capital allocation strength.
Income Statement
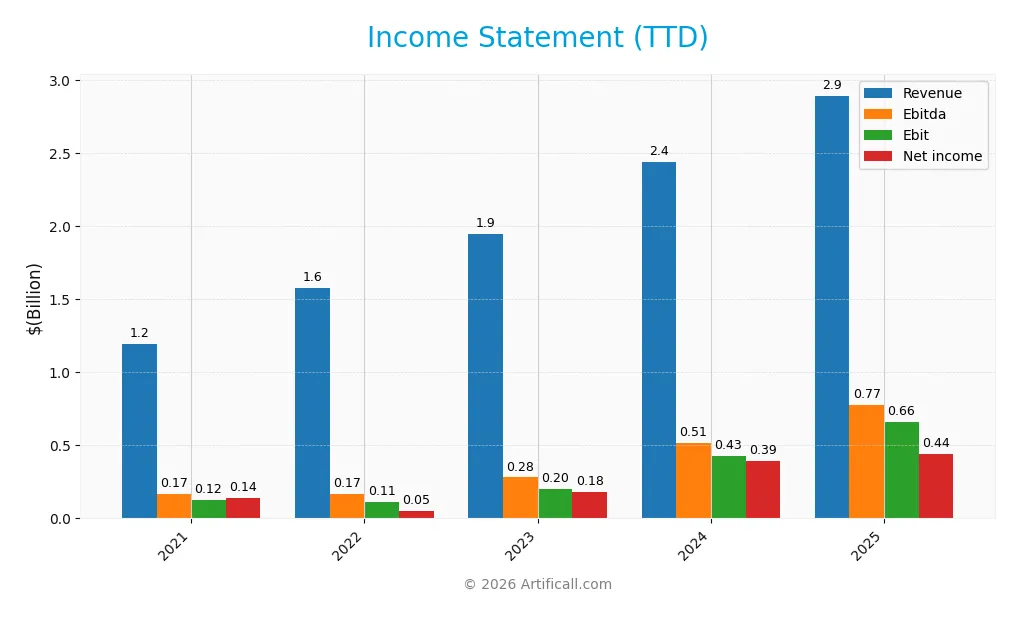
The table below presents The Trade Desk, Inc.’s key income statement figures for fiscal years 2021 through 2025, expressed in USD.
| 2021 | 2022 | 2023 | 2024 | 2025 | |
|---|---|---|---|---|---|
| Revenue | 1.20B | 1.58B | 1.95B | 2.44B | 2.90B |
| Cost of Revenue | 222M | 281M | 366M | 472M | 619M |
| Operating Expenses | 850M | 1.18B | 1.38B | 1.55B | 1.69B |
| Gross Profit | 975M | 1.30B | 1.58B | 1.97B | 2.28B |
| EBITDA | 167M | 168M | 281M | 515M | 775M |
| EBIT | 125M | 114M | 200M | 427M | 659M |
| Interest Expense | 1M | 0 | 0 | 0 | 0 |
| Net Income | 138M | 53M | 179M | 393M | 443M |
| EPS | 0.29 | 0.11 | 0.37 | 0.80 | 0.92 |
| Filing Date | 2022-02-16 | 2023-02-15 | 2024-02-15 | 2025-02-21 | 2026-02-27 |
Income Statement Evolution
From 2021 to 2025, The Trade Desk’s revenue soared 142%, reaching $2.9B in 2025. Net income outpaced revenue, surging 222% to $443M. Gross margins remained strong, averaging 79%, supporting efficient cost management. Operating expenses grew in line with revenue, maintaining stable EBIT margins near 23%, reflecting disciplined expense control amid rapid expansion.
Is the Income Statement Favorable?
In 2025, fundamentals appear generally favorable. Revenue grew 18.5% year-over-year, driven by a 15.4% gross profit increase. EBIT jumped 54%, signaling operational leverage. Net margin slightly declined by 4.8%, but remains healthy at 15.3%. Zero interest expense bolsters profitability. While net margin compression warrants monitoring, overall income metrics demonstrate solid growth and profitability trends.
Financial Ratios
The following table presents key financial ratios for The Trade Desk, Inc. from 2021 to 2025, illustrating profitability, valuation, liquidity, leverage, efficiency, and dividend metrics:
| Ratios | 2021 | 2022 | 2023 | 2024 | 2025 |
|---|---|---|---|---|---|
| Net Margin | 11.5% | 3.4% | 9.2% | 16.1% | 15.3% |
| ROE | 9.0% | 2.5% | 8.3% | 13.3% | 17.8% |
| ROIC | 6.9% | 2.0% | 5.5% | 10.0% | 13.4% |
| P/E | 317.2 | 408.9 | 196.8 | 146.8 | 41.1 |
| P/B | 28.6 | 10.3 | 16.3 | 19.6 | 7.3 |
| Current Ratio | 1.71 | 1.90 | 1.72 | 1.86 | 1.61 |
| Quick Ratio | 1.71 | 1.90 | 1.72 | 1.86 | 1.61 |
| D/E | 0.19 | 0.12 | 0.11 | 0.11 | 0.18 |
| Debt-to-Assets | 7.96% | 5.96% | 4.83% | 5.11% | 7.09% |
| Interest Coverage | 121.2 | 0 | 0 | 0 | 0 |
| Asset Turnover | 0.33 | 0.36 | 0.40 | 0.40 | 0.47 |
| Fixed Asset Turnover | 3.23 | 4.00 | 5.42 | 5.17 | 3.92 |
| Dividend Yield | 0% | 0% | 0% | 0% | 0% |
Evolution of Financial Ratios
Return on Equity improved steadily from 2.5% in 2022 to 17.8% in 2025, signaling enhanced profitability. The Current Ratio declined from 1.9 to 1.61 over the same period, indicating a slight reduction in liquidity but remaining above 1. Debt-to-Equity ratio remained stable near 0.18, reflecting consistent leverage management.
Are the Financial Ratios Fovorable?
In 2025, profitability ratios like ROE (17.8%) and net margin (15.3%) are favorable, outperforming typical sector benchmarks. Liquidity ratios (current and quick at 1.61) and leverage ratios (debt-to-equity 0.18) also rate as favorable. However, valuation metrics such as P/E (41.1) and P/B (7.33) are unfavorable. Asset turnover at 0.47 is low, and dividend yield is zero, marking some areas of concern despite a generally favorable ratio profile.
Shareholder Return Policy
The Trade Desk, Inc. does not pay dividends, reflecting its reinvestment strategy during growth phases. The company maintains positive free cash flow and operating cash flow, supporting internal funding and potential share buybacks.
This approach prioritizes long-term value creation by focusing capital on expansion and innovation. Absence of dividends aligns with growth objectives, but investors should monitor buyback activity and cash flow sustainability for shareholder returns.
Score analysis
The following radar chart illustrates key financial scores for The Trade Desk, Inc., highlighting areas of strength and weakness:
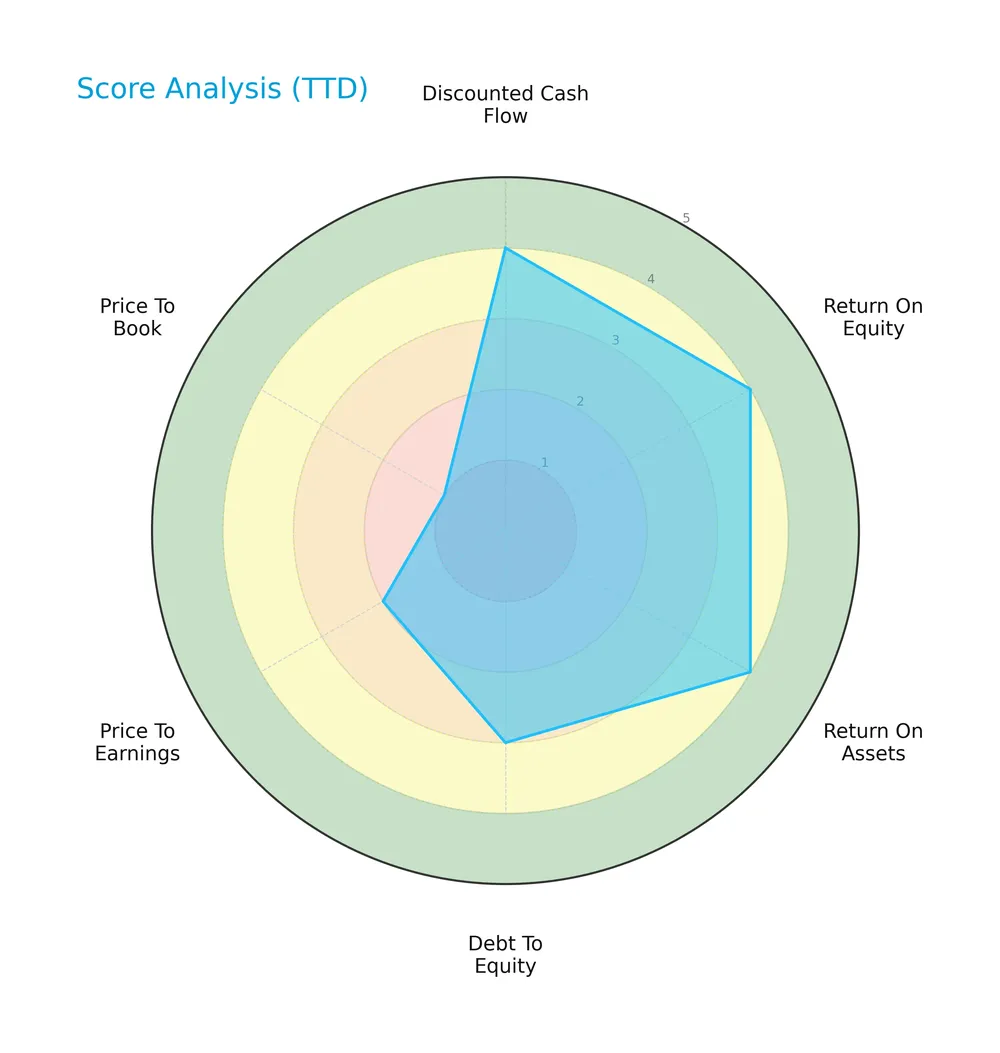
The Trade Desk scores favorably on discounted cash flow, return on equity, and return on assets, each at 4. Debt-to-equity is moderate at 3. Valuation metrics lag, with price-to-earnings at 2 and price-to-book at 1, indicating potential overvaluation concerns.
Analysis of the company’s bankruptcy risk
The Altman Z-Score places The Trade Desk in the grey zone, suggesting moderate bankruptcy risk and financial uncertainty:

Is the company in good financial health?
The Piotroski Score diagram reflects the company’s overall financial condition and operational efficiency:

With a Piotroski Score of 6, The Trade Desk demonstrates average financial health, showing reasonable profitability and stability but falling short of the strongest categories.
Competitive Landscape & Sector Positioning
This analysis covers The Trade Desk, Inc.’s sector positioning and competitive dynamics within the software application industry. I will examine its strategic positioning, revenue segments, key products, main competitors, and competitive advantages. Next, I will assess whether The Trade Desk holds a distinct competitive advantage over its peers.
Strategic Positioning
The Trade Desk, Inc. focuses heavily on the U.S. market, generating $2.48B of $2.90B total revenue in 2025. Its product portfolio spans diverse digital ad formats and channels but remains concentrated within the advertising technology sector.
Key Products & Brands
The Trade Desk offers a cloud-based platform and related services for digital advertising campaigns:
| Product | Description |
|---|---|
| Self-Service Cloud Platform | Enables buyers to create, manage, and optimize data-driven digital advertising campaigns across multiple formats. |
| Ad Formats Supported | Includes display, video, audio, native, and social advertising across devices such as computers, mobiles, and connected TV. |
| Data and Value-Added Services | Provides supplementary data and services to enhance advertising effectiveness and targeting precision. |
The Trade Desk’s product suite centers on a versatile advertising platform that supports diverse formats and devices, complemented by valuable data services for agencies and advertisers.
Main Competitors
There are 33 competitors in this sector; the table below lists the top 10 leaders by market capitalization:
| Competitor | Market Cap. |
|---|---|
| Salesforce, Inc. | 242B |
| Shopify Inc. | 210B |
| AppLovin Corporation | 209B |
| Intuit Inc. | 175B |
| Uber Technologies, Inc. | 172B |
| ServiceNow, Inc. | 153B |
| Cadence Design Systems, Inc. | 85B |
| Snowflake Inc. | 73B |
| Autodesk, Inc. | 61B |
| Workday, Inc. | 55B |
The Trade Desk, Inc. ranks 18th among 33 competitors. Its market cap is only 4.8% of the leader, Salesforce. TTD is below both the average market cap of the top 10 (143B) and the sector median (18.7B). The company holds a +61% gap over its closest competitor above, indicating a significant scale difference.
Does TTD have a competitive advantage?
The Trade Desk, Inc. presents a clear competitive advantage, evidenced by a very favorable moat evaluation and a ROIC exceeding its WACC by nearly 5%, signaling strong value creation. Its growing ROIC trend confirms efficient capital use and increasing profitability over 2021-2025.
Looking ahead, TTD benefits from its cloud-based platform supporting diverse digital ad formats across devices, positioning it well for expansion in new markets. Continued innovation and data-driven services offer opportunities to deepen client relationships and capture further industry growth.
Comparisons with competitors
Check out how we compare the company to its competitors:
SWOT Analysis
This SWOT analysis distills The Trade Desk’s core strategic factors to guide investment decisions.
Strengths
- Strong gross margin at 78.6%
- Robust EBIT margin of 22.7%
- Growing ROIC well above WACC
- Low debt and strong liquidity ratios
Weaknesses
- High valuation multiples: PE at 41.1, PB at 7.33
- Asset turnover below industry average
- No dividend yield limits income investors
Opportunities
- Expansion in connected TV and programmatic advertising
- Increasing global digital ad spend
- Leveraging data analytics for client retention
Threats
- Intense competition in ad tech
- Regulatory risks on data privacy
- Economic downturn reducing ad budgets
The Trade Desk demonstrates a durable competitive advantage with strong profitability and growth. However, high valuation and execution risks require cautious position sizing. Strategic focus on innovation and global expansion will be critical to sustain momentum.
Stock Price Action Analysis
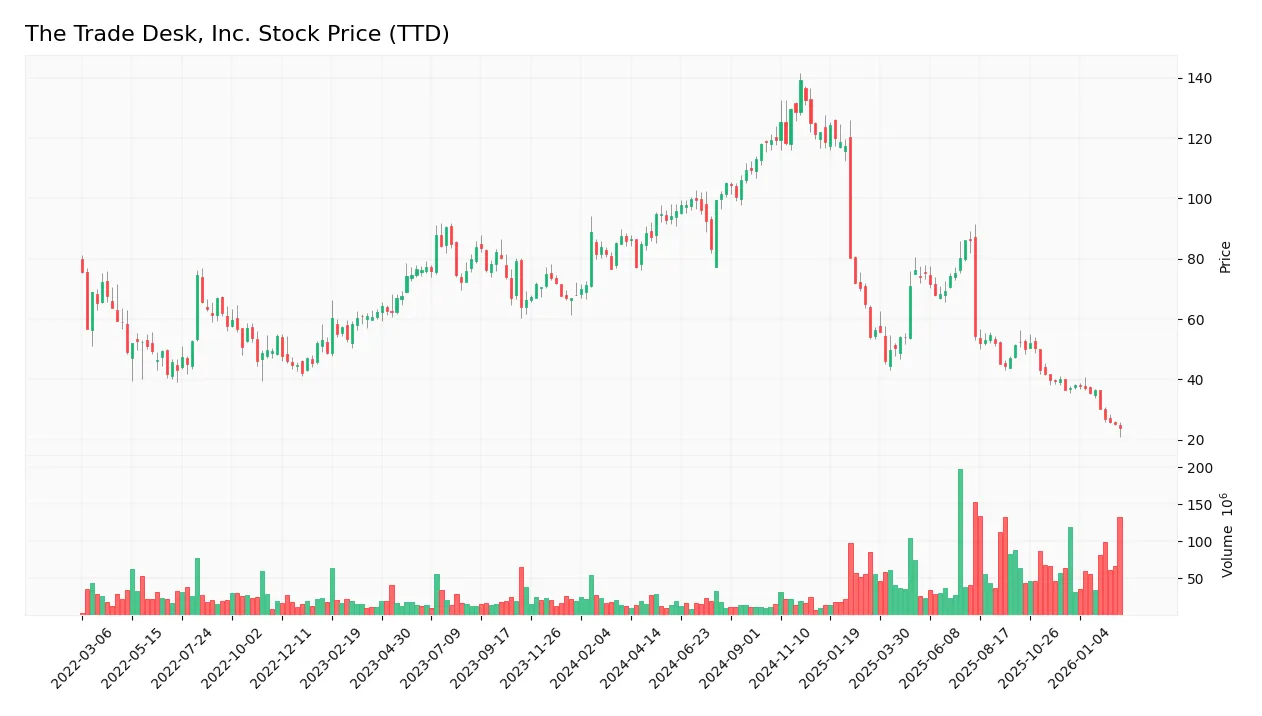
The weekly stock chart below depicts The Trade Desk, Inc.’s price movement over the past 12 months, revealing key support and resistance levels:
Trend Analysis
Over the past 12 months, TTD’s stock price fell sharply by 72.25%, confirming a bearish trend. The decline decelerated despite high volatility (30.99 std deviation). The stock peaked at 139.11 and bottomed at 23.82, showing no signs of reversal or acceleration.
Volume Analysis
In the last three months, trading volume increased but remained seller-dominant, with buyers accounting for only 22.03%. This rising volume amid selling pressure suggests weakening investor confidence and persistent market participation skewed toward exits.
Target Prices
Analysts set a broad target range for The Trade Desk, reflecting varied outlooks on its growth trajectory.
| Target Low | Target High | Consensus |
|---|---|---|
| 22 | 80 | 46.65 |
The wide spread between low and high targets signals uncertainty but consensus pins the stock near $47, suggesting moderate confidence in its recovery potential.
Analyst & Consumer Opinions
This section examines the latest analyst ratings and consumer feedback regarding The Trade Desk, Inc. (TTD).

Don’t Let Luck Decide Your Entry Point
Optimize your entry points with our advanced ProRealTime indicators. You’ll get efficient buy signals with precise price targets for maximum performance. Start outperforming now!
Stock Grades
The latest grades for The Trade Desk, Inc. from leading financial firms are presented below:
| Grading Company | Action | New Grade | Date |
|---|---|---|---|
| Morgan Stanley | Maintain | Equal Weight | 2026-02-26 |
| DA Davidson | Maintain | Buy | 2026-02-26 |
| BMO Capital | Maintain | Outperform | 2026-02-26 |
| Oppenheimer | Maintain | Outperform | 2026-02-26 |
| Scotiabank | Maintain | Sector Perform | 2026-02-26 |
| Rosenblatt | Maintain | Buy | 2026-02-26 |
| Truist Securities | Maintain | Buy | 2026-02-26 |
| UBS | Maintain | Buy | 2026-02-26 |
| Wells Fargo | Maintain | Equal Weight | 2026-02-26 |
| Needham | Maintain | Buy | 2026-02-26 |
The consensus leans toward a Buy rating, with multiple firms maintaining positive stances. Notably, no downgrades occurred, reflecting steady confidence across major analysts.
Consumer Opinions
The Trade Desk, Inc. enjoys a loyal user base praising its innovative platform, though some customers express concerns over pricing and complexity.
| Positive Reviews | Negative Reviews |
|---|---|
| “Powerful data-driven advertising tools.” | “Steep learning curve for new users.” |
| “Excellent customer support and updates.” | “Pricing feels high for smaller businesses.” |
| “Robust integration with multiple channels.” | “Dashboard can be overwhelming at times.” |
Overall, consumers appreciate The Trade Desk’s advanced capabilities and support. However, smaller clients struggle with cost and usability, indicating room for simplification and pricing flexibility.
Risk Analysis
Below is a summary table highlighting key risks facing The Trade Desk, Inc. as of 2026:
| Category | Description | Probability | Impact |
|---|---|---|---|
| Valuation Risk | High P/E (41.1) and P/B (7.33) ratios suggest the stock is expensive relative to earnings. | High | High |
| Market Volatility | Beta of 1.09 indicates sensitivity to broader market swings, raising stock price volatility. | Medium | Medium |
| Financial Health | Altman Z-score near 2.96 places the company in a grey zone, signaling moderate bankruptcy risk. | Medium | High |
| Competitive Pressure | Rapid innovation in ad tech could erode market share and margins if not sustained. | Medium | High |
| Dividend Policy | No dividend yield limits income generation for investors seeking regular cash flow. | High | Low |
The most pressing risks stem from lofty valuation multiples and the grey-zone Altman Z-score, which together heighten downside risk if growth disappoints. Market volatility remains a constant factor given the sector’s cyclicality. The Trade Desk must sustain innovation to justify its premium price.
Should You Buy The Trade Desk, Inc.?
The Trade Desk, Inc. appears to be generating strong value creation with a durable competitive moat supported by growing ROIC above WACC. Despite manageable leverage and a moderate Altman Z-score, its B+ rating suggests a very favorable yet cautiously optimistic profile.
Strength & Efficiency Pillars
The Trade Desk, Inc. exhibits robust operational efficiency, with a net margin of 15.31% and a return on equity of 17.84%, signaling solid profitability. Importantly, its return on invested capital (ROIC) stands at 13.38%, comfortably above its weighted average cost of capital (WACC) at 8.43%, confirming the company as a clear value creator. Gross margin remains high at 78.63%, while EBIT margin of 22.74% underscores effective cost control. These metrics reflect a business maintaining a sustainable competitive advantage with growing profitability.
Weaknesses and Drawbacks
The company resides in the Altman Z-Score grey zone at 2.96, indicating moderate bankruptcy risk that cannot be ignored. Its valuation appears stretched, with a high P/E ratio of 41.1 and an elevated price-to-book ratio of 7.33, suggesting the market prices in significant growth expectations. Although leverage is low (debt-to-equity at 0.18), recent market pressure is evident, with seller dominance at 77.97% in the latest period, creating short-term headwinds. Asset turnover of 0.47 flags efficiency concerns compared to peers.
Our Final Verdict about The Trade Desk, Inc.
Despite The Trade Desk’s value-creating fundamentals and favorable profitability, the moderate solvency risk indicated by its Altman Z-Score warrants caution. The bearish stock trend and strong recent seller dominance suggest the share price may face continued pressure. Thus, while the company’s long-term profile might appear attractive for growth-oriented investors, current market dynamics and financial risk suggest a wait-and-see approach could be prudent. The investment case remains speculative and better suited for those with higher risk tolerance.
Disclaimer: This content is for informational purposes only and does not constitute financial, investment, or other professional advice. Investing in financial markets involves a significant risk of loss, and past performance is not indicative of future results.
Additional Resources
- The Trade Desk plunges as soft Q1 outlook overshadows earnings beat – Seeking Alpha (Feb 25, 2026)
- Trade Desk Faces Challenges as Analyst Lower Price Targets – StocksToTrade (Feb 26, 2026)
- Ad buyers sent $13.4B through The Trade Desk in 2025 as revenue grew – Stock Titan (Feb 25, 2026)
- Decoding The Trade Desk Inc (TTD): A Strategic SWOT Insight – GuruFocus (Feb 28, 2026)
- The Trade Desk Stock Crumbles After Q4 – Benzinga (Feb 25, 2026)
For more information about The Trade Desk, Inc., please visit the official website: thetradedesk.com