Home > Analyses > Technology > ServiceTitan, Inc.
ServiceTitan transforms how field service businesses operate, streamlining installations and maintenance for homes and commercial buildings. The company stands out with its cutting-edge software platform, which integrates scheduling, dispatch, and customer management into one seamless solution. Known for innovation and reliability, ServiceTitan has reshaped an essential but traditionally fragmented industry. As it navigates post-IPO growth, I ask: do its fundamentals support the lofty market expectations investors currently price in?
Table of contents
Business Model & Company Overview
ServiceTitan, Inc., founded in 2008 and headquartered in Glendale, CA, commands a leading position in software applications for field service industries. It integrates tools that streamline installation, maintenance, and servicing of residential and commercial infrastructure. This cohesive ecosystem empowers technicians and managers alike, driving efficiency and customer satisfaction across its platform.
The company’s revenue engine balances robust software subscriptions with recurring service fees, fueling steady cash flow. ServiceTitan extends its footprint across the Americas, Europe, and Asia, tapping into diverse markets with tailored solutions. Its competitive advantage lies in embedding itself deeply within critical service workflows, creating significant barriers to entry and shaping the future of field service management.
Financial Performance & Fundamental Metrics
I analyze ServiceTitan, Inc.’s income statement, key financial ratios, and dividend payout policy to reveal its core financial health and operational efficiency.
Income Statement
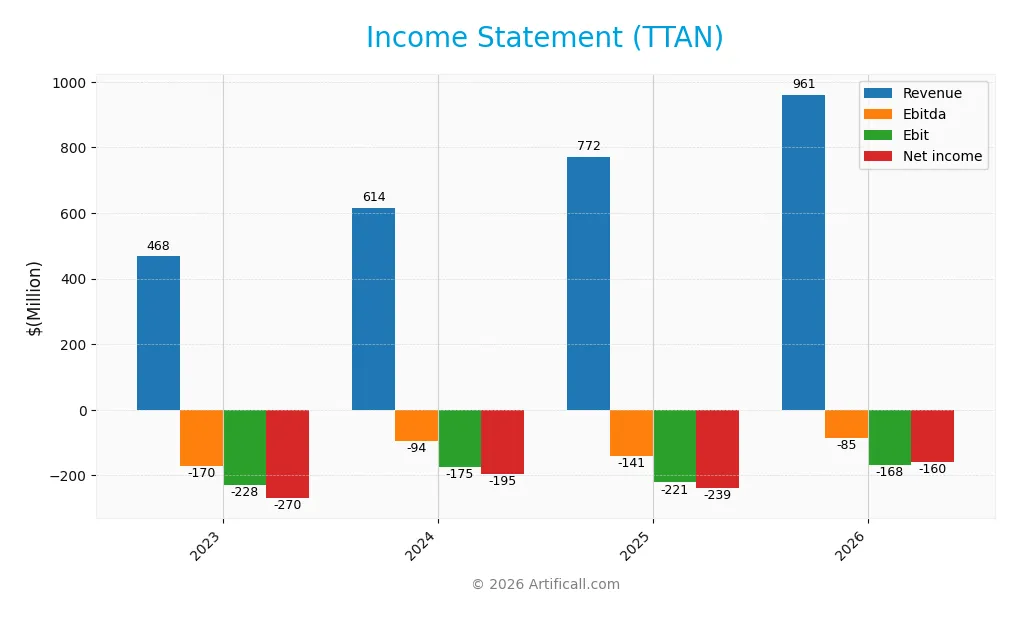
This table presents ServiceTitan, Inc.’s key income statement figures for fiscal years 2023 through 2026, illustrating revenue, profitability, and earnings per share trends.
| 2023 | 2024 | 2025 | 2026 | |
|---|---|---|---|---|
| Revenue | 468M | 614M | 772M | 961M |
| Cost of Revenue | 202M | 238M | 271M | 309M |
| Operating Expenses | 488M | 559M | 731M | 820M |
| Gross Profit | 266M | 377M | 501M | 652M |
| EBITDA | -170M | -94M | -141M | -85M |
| EBIT | -228M | -175M | -221M | -168M |
| Interest Expense | 55M | 16M | 16M | 7M |
| Net Income | -270M | -195M | -239M | -160M |
| EPS | -3.44 | -2.93 | -8.53 | -1.73 |
| Filing Date | 2023-01-31 | 2024-01-31 | 2025-04-02 | 2026-03-25 |
Income Statement Evolution
ServiceTitan’s revenue doubled from $468M in 2023 to $961M in 2026, reflecting robust growth. Gross profit expanded steadily, lifting gross margins to a favorable 67.85%. Operating expenses rose in line with revenue, keeping cost control stable. Despite improved top-line growth, net income remained negative, though losses narrowed, signaling margin improvement.
Is the Income Statement Favorable?
In 2026, fundamentals show strength with 24.5% revenue growth and a 30.16% increase in gross profit. EBITDA and EBIT losses shrank by about 24%, indicating operational leverage gains. Interest expense stayed low at 0.75% of revenue, supporting financial stability. Overall, 85.7% of income metrics are favorable, confirming generally positive income statement trends despite ongoing net losses.
Financial Ratios
The table below summarizes key financial ratios for ServiceTitan, Inc. (TTAN) over the last four fiscal years:
| Ratios | 2023 | 2024 | 2025 | 2026 |
|---|---|---|---|---|
| Net Margin | -57.62% | -31.76% | -30.98% | -16.63% |
| ROE | -22.19% | -16.95% | -16.44% | -0.01% |
| ROIC | -14.36% | -13.01% | -14.11% | -0.01% |
| P/E | -30.86 | -42.63 | -18.12 | -46.12 |
| P/B | 6.85 | 7.22 | 2.98 | 0.005 |
| Current Ratio | 2.06 | 1.99 | 3.74 | 3.49 |
| Quick Ratio | 2.06 | 1.99 | 3.74 | 3.49 |
| D/E | 0.21 | 0.21 | 0.11 | 0.03 |
| Debt-to-Assets | 15.82% | 16.21% | 9.35% | 2.94% |
| Interest Coverage | -4.07 | -11.13 | -14.82 | -23.25 |
| Asset Turnover | 0.29 | 0.40 | 0.44 | 0.001 |
| Fixed Asset Turnover | 3.27 | 4.37 | 9.57 | 0.02 |
| Dividend Yield | 0% | 0% | 0% | 0% |
Evolution of Financial Ratios
Return on Equity (ROE) remained negative and near zero in 2026, signaling weak profitability. The Current Ratio slightly decreased from 3.74 in 2025 to 3.49, indicating marginally reduced liquidity but still above 1. Debt-to-Equity Ratio improved significantly, falling from 0.11 in 2025 to 0.03 in 2026, reflecting lower financial leverage and reduced debt burden.
Are the Financial Ratios Fovorable?
In 2026, profitability ratios like net margin (-16.63%) and ROE (-0.01%) were unfavorable, highlighting operational challenges. Liquidity showed mixed signals: a high current ratio (3.49) was deemed unfavorable, while a matching quick ratio was favorable. Leverage ratios, including debt-to-equity (0.03) and debt-to-assets (2.94%), were favorable, signaling conservative debt use. Asset turnover remained very low, contributing to an overall unfavorable financial profile.
Shareholder Return Policy
ServiceTitan, Inc. (TTAN) does not pay dividends, reflecting its ongoing net losses and reinvestment focus. The absence of dividends aligns with its high-growth phase and prioritization of expanding operations over shareholder payouts. The company does not report share buybacks.
This policy supports long-term value creation through reinvestment but carries risks if profitability remains elusive. Sustained losses suggest cautious monitoring is necessary to assess if this capital allocation strategy will eventually translate into shareholder returns.
Score analysis
The following radar chart illustrates key valuation and financial performance scores for ServiceTitan, Inc.:
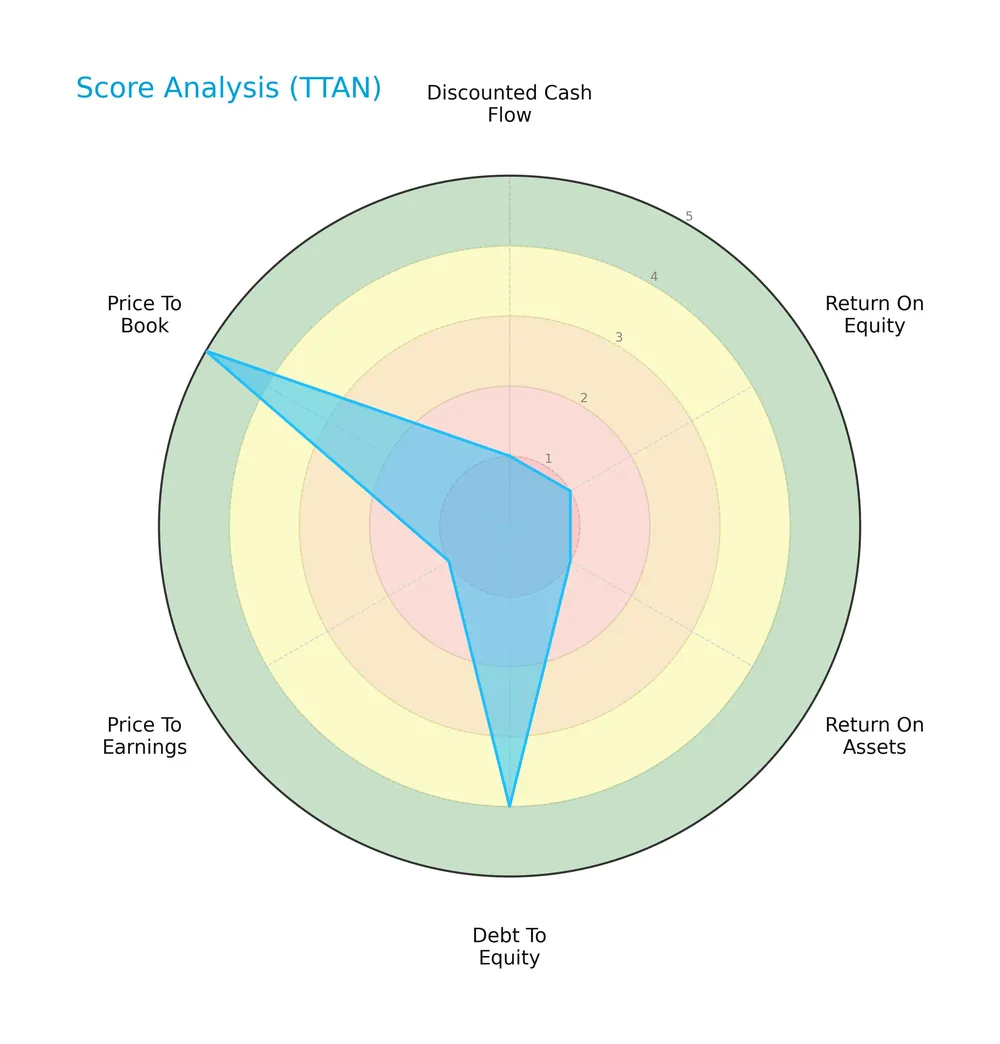
ServiceTitan scores very low on discounted cash flow, ROE, ROA, and P/E, signaling weak profitability and valuation metrics. Its debt-to-equity score is favorable, reflecting moderate leverage. The price-to-book score is very favorable, indicating strong market valuation relative to book value.
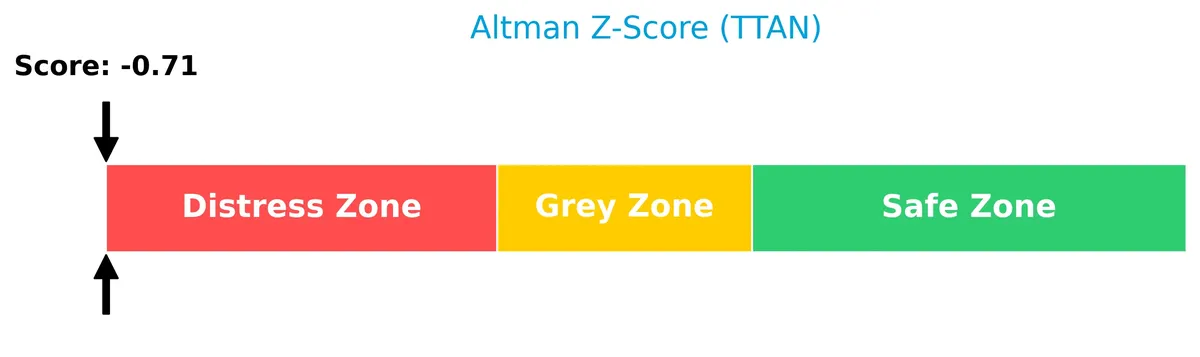
Analysis of the company’s bankruptcy risk
ServiceTitan’s Altman Z-Score places it in the distress zone, signaling a high risk of financial distress and potential bankruptcy:
Is the company in good financial health?
The Piotroski Score diagram offers insight into ServiceTitan’s financial health status:
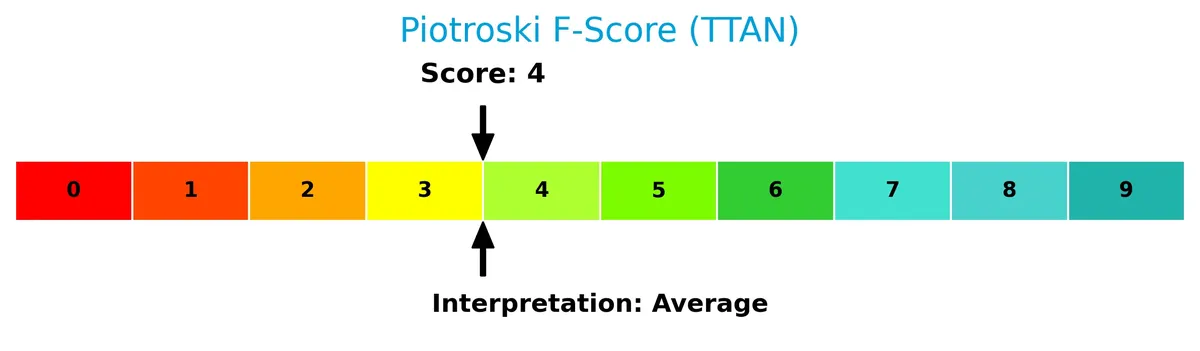
With a Piotroski Score of 4, ServiceTitan displays average financial health, reflecting mixed signals on profitability, leverage, and operational efficiency.
Competitive Landscape & Sector Positioning
This analysis examines ServiceTitan, Inc.’s position in the software application sector. It covers strategic positioning, revenue segments, key products, and main competitors. I will determine whether ServiceTitan holds a competitive advantage over its peers.
Strategic Positioning
ServiceTitan concentrates on software for field service management, generating 712M USD in subscription and 213M USD in usage revenue in 2026. Its product portfolio centers on scalable SaaS offerings, with limited diversification across service types or geographies, focusing primarily on the US market.
Revenue by Segment
This pie chart presents ServiceTitan’s revenue breakdown by segment for the fiscal year 2026, highlighting key sources of income and their relative weight in the business.
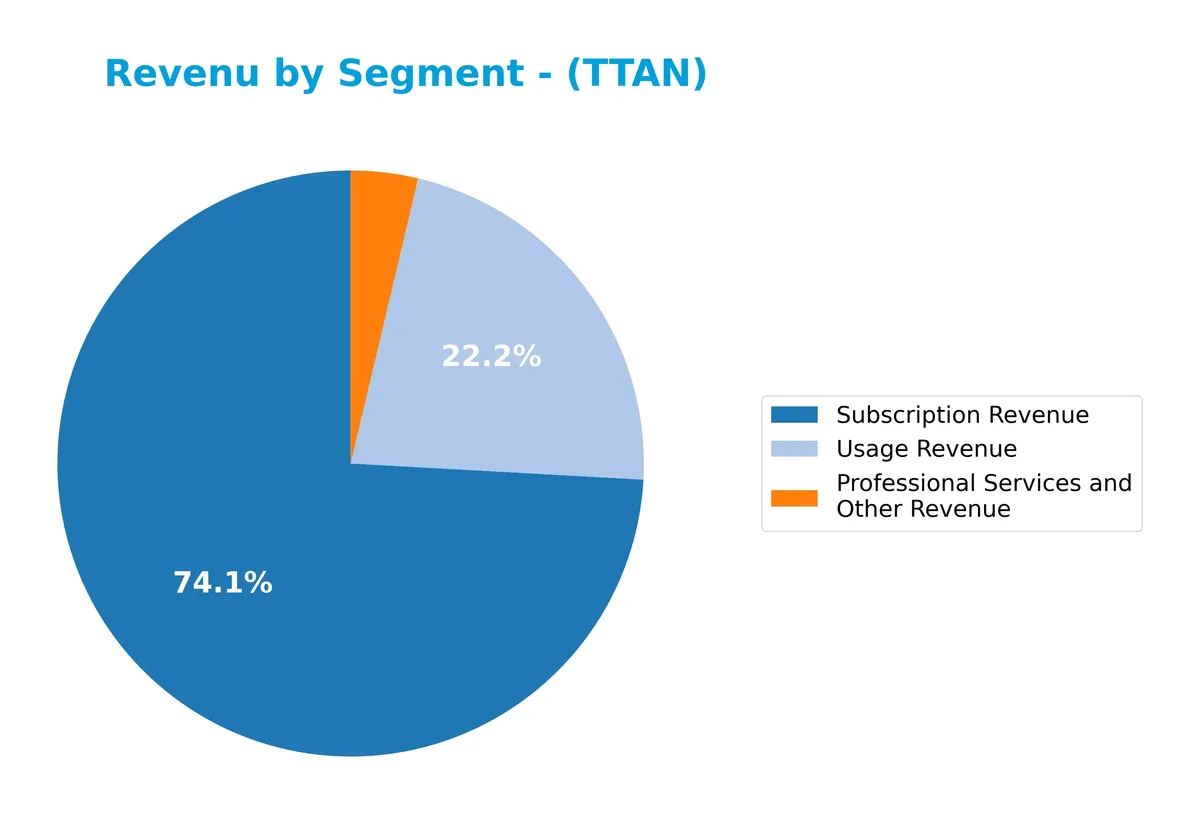
In 2026, Subscription Revenue leads decisively at 712M, reflecting strong recurring income. Usage Revenue contributes 213M, showing significant customer engagement. Professional Services and Other Revenue, at 35.5M, remains a minor part. Compared to 2025, the rise in Subscription Revenue indicates accelerating customer commitment, while the introduction of Usage Revenue diversifies the revenue base, reducing concentration risk.
Key Products & Brands
ServiceTitan’s revenue primarily derives from subscription, usage, and professional services segments, reflecting its software application offerings:
| Product | Description |
|---|---|
| Subscription Revenue | Recurring fees for access to ServiceTitan’s software platform, supporting field service operations. |
| Usage Revenue | Charges based on the extent of platform utilization, reflecting customer engagement levels. |
| Professional Services and Other Revenue | Revenue from consulting, implementation, and support services for platform users. |
ServiceTitan’s product suite centers on a software platform that facilitates field service management for residential and commercial infrastructure. Subscription revenue dominates, complemented by usage fees and professional services, highlighting a diversified approach to monetization.
Main Competitors
ServiceTitan, Inc. faces competition from 33 companies in its sector; below is a list of the top 10 leaders by market capitalization:
| Competitor | Market Cap. |
|---|---|
| Salesforce, Inc. | 242B |
| Shopify Inc. | 210B |
| AppLovin Corporation | 209B |
| Intuit Inc. | 175B |
| Uber Technologies, Inc. | 172B |
| ServiceNow, Inc. | 153B |
| Cadence Design Systems, Inc. | 84B |
| Snowflake Inc. | 73B |
| Autodesk, Inc. | 61B |
| Workday, Inc. | 55B |
ServiceTitan ranks 24th among 33 competitors, with a market cap at 2.37% of the leader, Salesforce. It sits well below both the top 10 average market cap of $144B and the sector median of $18.8B. The company maintains a 77.8% market cap gap to its nearest larger competitor, highlighting a significant scale difference.
Comparisons with competitors
Check out how we compare the company to its competitors:
Does ServiceTitan have a competitive advantage?
ServiceTitan currently lacks a strong competitive advantage, as its ROIC falls below WACC, indicating value destruction despite operational improvements. The company’s negative net margin and EBIT margin reflect ongoing challenges in profitability.
Looking ahead, ServiceTitan shows promise with robust revenue growth and expanding gross profits. Continued innovation in software applications for field services and market expansion could enhance its competitive position over time.
SWOT Analysis
This SWOT analysis distills ServiceTitan’s core strategic factors to guide investment decisions.
Strengths
- Strong revenue growth at 24.5% annually
- High gross margin at 67.85%
- Low debt levels with 2.94% debt-to-assets
Weaknesses
- Negative net margin at -16.63%
- Negative ROIC indicating value destruction
- Distress zone Altman Z-Score signals financial risk
Opportunities
- Expanding field service software market
- Growing profitability trend suggests operational improvement
- Potential to leverage technology for efficiency gains
Threats
- Intense competition in SaaS applications
- Market volatility impacting stock price
- Pressure on margins from increased operating expenses
ServiceTitan shows robust growth and margin strength but suffers from profitability and financial stability issues. The company must focus on operational efficiencies and risk mitigation to capitalize on its market opportunities.
Stock Price Action Analysis
The weekly stock chart below illustrates ServiceTitan, Inc. (TTAN) price movements over the past 12 months:
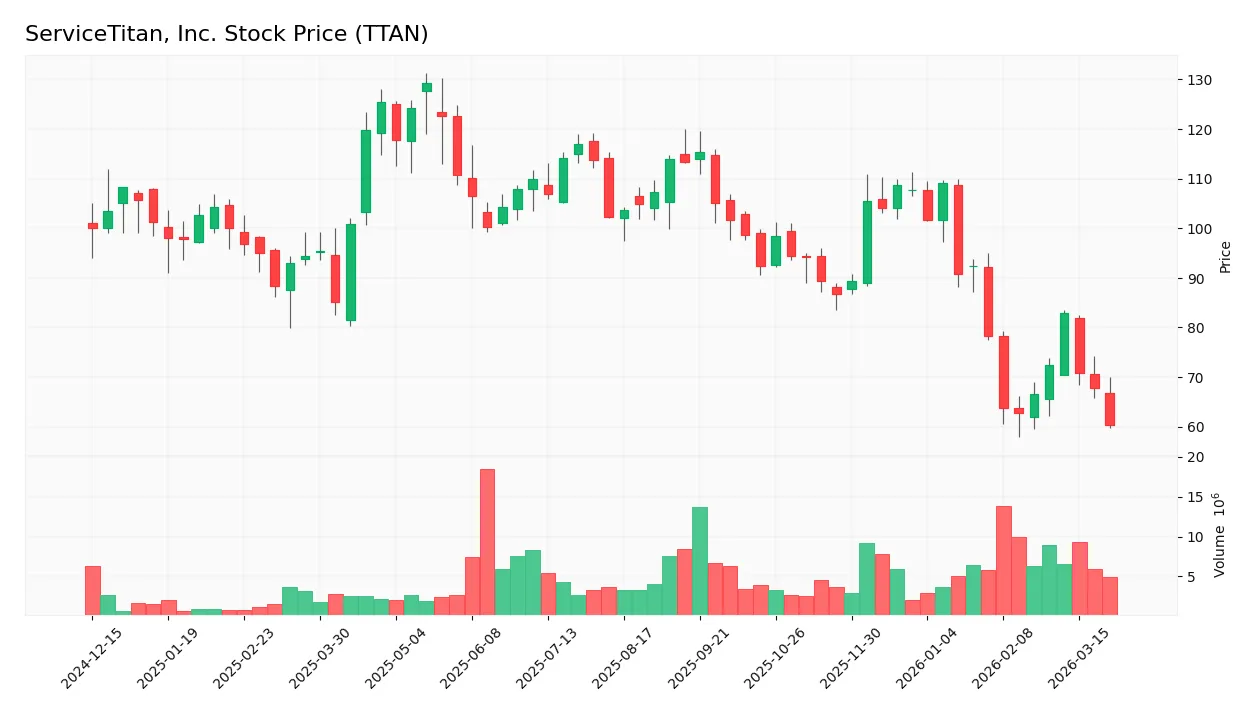
Trend Analysis
Over the past 12 months, TTAN’s stock price declined sharply by 39.61%, marking a clear bearish trend. The price fell from a high of 129.26 to a low of 60.39. Volatility remains elevated with a 15.09 standard deviation. The downtrend shows deceleration, indicating a slowing pace of decline.
Volume Analysis
Trading volume for TTAN has been increasing, totaling 314M shares in the last year. Sellers dominate with 56% of volume, rising further to 63% in the recent three months. This seller-driven activity signals weak investor confidence and cautious market participation.
Target Prices
Analysts set a solid target consensus for ServiceTitan, Inc., reflecting confidence in the stock’s potential.
| Target Low | Target High | Consensus |
|---|---|---|
| 117 | 131 | 124.71 |
The target range suggests moderate upside from current levels. The consensus at 124.71 signals steady growth expectations among analysts.

Don’t Let Luck Decide Your Entry Point
Optimize your entry points with our advanced ProRealTime indicators. You’ll get efficient buy signals with precise price targets for maximum performance. Start outperforming now!
Analyst & Consumer Opinions
This section reviews analyst ratings and consumer feedback to provide a balanced view of ServiceTitan, Inc.’s market standing.
Stock Grades
The latest grades from leading financial institutions for ServiceTitan, Inc. reveal a consistent consensus on the stock’s outlook:
| Grading Company | Action | New Grade | Date |
|---|---|---|---|
| Goldman Sachs | Maintain | Neutral | 2026-03-16 |
| TD Cowen | Maintain | Buy | 2026-03-13 |
| BMO Capital | Maintain | Outperform | 2026-03-13 |
| Citigroup | Maintain | Neutral | 2026-03-13 |
| Wells Fargo | Maintain | Overweight | 2026-03-13 |
| BTIG | Maintain | Buy | 2026-03-13 |
| Truist Securities | Maintain | Buy | 2026-03-13 |
| Keybanc | Maintain | Overweight | 2026-03-13 |
| Needham | Maintain | Buy | 2026-03-13 |
| Morgan Stanley | Maintain | Overweight | 2026-03-13 |
Overall, the grades lean strongly positive, with a majority of buy and outperform ratings. Neutral stances by Goldman Sachs and Citigroup provide some balance, indicating cautious optimism.
Consumer Opinions
ServiceTitan, Inc. inspires a mix of enthusiasm and caution among its user base, reflecting its growing presence in service management software.
| Positive Reviews | Negative Reviews |
|---|---|
| Intuitive interface accelerates daily tasks | Occasional glitches disrupt workflow |
| Excellent customer support responsiveness | Steep learning curve for new users |
| Robust integration with third-party tools | Pricing can be high for small businesses |
| Frequent updates enhance functionality | Mobile app needs stability improvements |
Overall, users praise ServiceTitan’s powerful features and customer service. However, some struggle with usability and cost, signaling areas for improvement as the company scales.
Risk Analysis
Below is a detailed table highlighting key risks ServiceTitan, Inc. faces in 2026:
| Category | Description | Probability | Impact |
|---|---|---|---|
| Financial Health | Negative net margin (-16.63%) and ROE (-0.01%) signal ongoing losses. | High | High |
| Bankruptcy Risk | Altman Z-Score of -0.71 places company in distress zone, risk of default. | Medium | Very High |
| Liquidity | Current ratio 3.49 appears strong but flagged unfavorable due to asset turnover. | Medium | Medium |
| Profitability | Weak asset turnover and fixed asset turnover both near zero. | High | High |
| Debt Management | Low debt-to-equity (0.03) and debt-to-assets (2.94%) indicate low leverage. | Low | Low |
| Market Volatility | Beta of -0.72 suggests inverse market moves, increasing unpredictability. | Medium | Medium |
| Dividend Policy | No dividend yield, reducing income appeal to investors. | High | Low |
The most concerning risks are the poor profitability metrics and the distress-zone Altman Z-Score. These highlight financial instability despite low leverage. Negative margins and zero asset turnover suggest operational inefficiencies. Investors must weigh these headwinds against the favorable valuation metrics carefully.
Should You Buy ServiceTitan, Inc.?
ServiceTitan appears to be in financial distress with an unfavorable profitability profile despite improving ROIC. Its leverage profile seems manageable, yet the competitive moat is slightly unfavorable. The overall rating of C+ suggests a cautious analytical interpretation.
Strength & Efficiency Pillars
ServiceTitan, Inc. exhibits strong operational efficiency with a gross margin of 67.85% and favorable interest expense at 0.75%. The company’s revenue growth of 24.5% over the past year and a 105.45% increase over the overall period highlight robust top-line expansion. Despite this, its return on invested capital (ROIC) of -0.01% trails the weighted average cost of capital (WACC) at 4.15%, indicating the company currently destroys value rather than creates it.
Weaknesses and Drawbacks
ServiceTitan is in financial distress, evidenced by an Altman Z-Score of -0.71, placing it firmly in the distress zone with high bankruptcy risk. The net margin is deeply negative at -16.63%, and return on equity is nearly zero (-0.01%), signaling poor profitability. Additionally, a negative interest coverage ratio (-23.25) raises solvency concerns despite low debt-to-equity of 0.03. Market sentiment is bearish, with sellers dominating 63.26% of recent volume, intensifying short-term pressure.
Our Final Verdict about ServiceTitan, Inc.
Despite operational strengths and impressive revenue growth, ServiceTitan’s distress-level solvency risk makes the investment highly speculative. The company’s persistent negative profitability and weak financial health overshadow its top-line momentum. Investors seeking conservative exposure may find this profile too risky, as the balance sheet’s fragility could undermine future performance despite improving operational trends.
Disclaimer: This content is for informational purposes only and does not constitute financial, investment, or other professional advice. Investing in financial markets involves a significant risk of loss, and past performance is not indicative of future results.
Additional Resources
- Vanguard amends 13G/A after realignment for ServiceTitan (TTAN) – Stock Titan (Mar 27, 2026)
- ServiceTitan, Inc. (TTAN) price target cut at Truist after strong Q4 performance – MSN (Mar 26, 2026)
- ServiceTitan Inc (TTAN) Shares Down 3.29% on Mar 25 – GuruFocus (Mar 26, 2026)
- ServiceTitan Inc. (TTAN) Reports Next Week: Wall Street Expects Earnings Growth – Yahoo Finance (Mar 05, 2026)
- ServiceTitan stumbles amid mixed Q4 results, 2027 guidance (TTAN:NASDAQ) – Seeking Alpha (Mar 12, 2026)
For more information about ServiceTitan, Inc., please visit the official website: servicetitan.com