Home > Comparison > Technology > NOW vs PATH
The strategic rivalry between ServiceNow, Inc. and UiPath Inc. shapes the evolution of enterprise automation within the technology sector. ServiceNow, a market leader in application software, offers a comprehensive cloud workflow platform, while UiPath specializes in infrastructure software with a focus on robotic process automation. This analysis contrasts their business models and growth trajectories to identify which company presents a superior risk-adjusted investment opportunity for diversified portfolios in 2026.
Table of contents
Companies Overview
ServiceNow and UiPath dominate the enterprise automation space with distinct strengths and market approaches.
ServiceNow, Inc.: Enterprise Cloud Workflow Leader
ServiceNow leads in enterprise cloud computing, generating revenue primarily through its Now platform. This platform automates workflows across IT service management, security operations, and customer service. In 2026, ServiceNow emphasizes expanding AI-driven automation and strategic partnerships, notably with Celonis, to streamline process identification and optimization for global enterprises.
UiPath Inc.: Robotic Process Automation Pioneer
UiPath focuses on robotic process automation (RPA), offering an integrated platform that blends AI with low-code tools to automate workflows. It drives revenue by selling software licenses and professional services. In 2026, UiPath prioritizes enhancing centralized automation governance and expanding its low-code development capabilities to increase adoption across banking, healthcare, and government sectors.
Strategic Collision: Similarities & Divergences
ServiceNow and UiPath both pursue enterprise automation but differ in approach. ServiceNow builds a comprehensive cloud-based workflow ecosystem, while UiPath emphasizes modular RPA with AI-powered process discovery. Their primary battleground lies in automating business processes across IT and operations. Investors face distinct profiles: ServiceNow offers scale and integration, UiPath presents growth in specialized automation infrastructure.
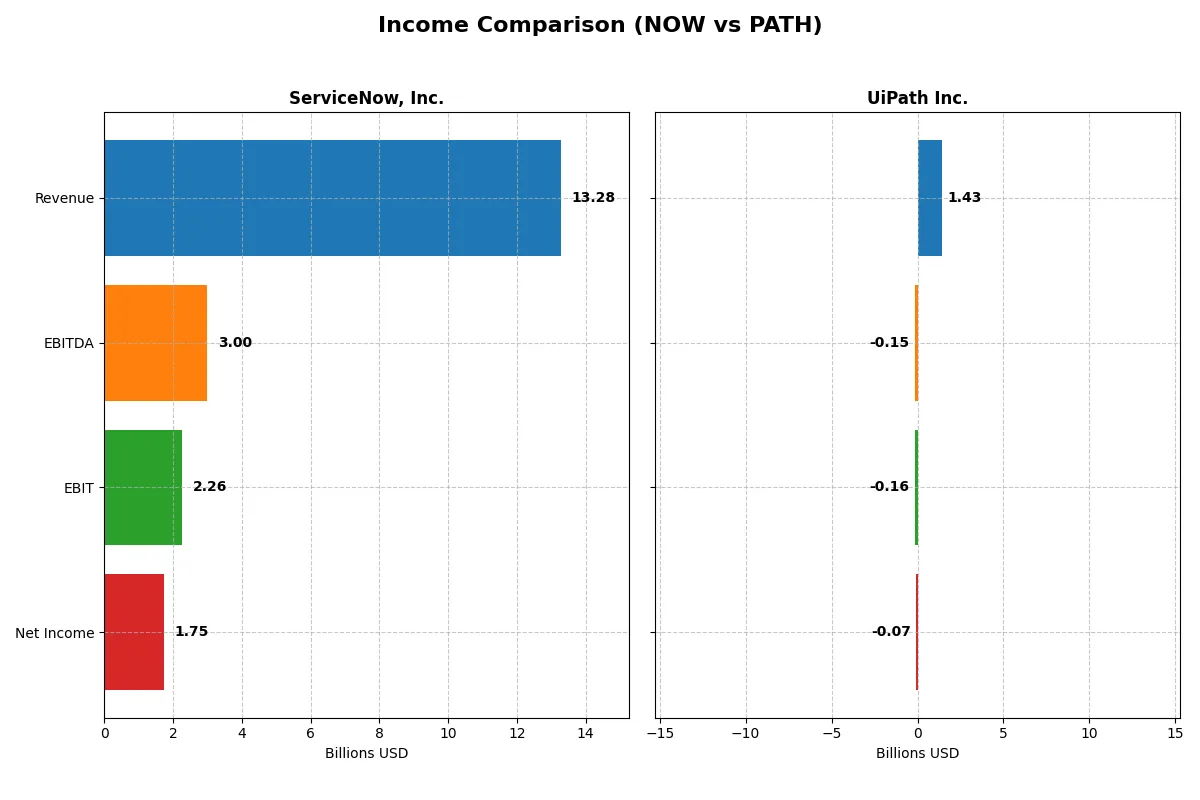
Income Statement Comparison
This data dissects the core profitability and scalability of both corporate engines to reveal who dominates the bottom line:
| Metric | ServiceNow, Inc. (NOW) | UiPath Inc. (PATH) |
|---|---|---|
| Revenue | 13.3B | 1.43B |
| Cost of Revenue | 3.0B | 247M |
| Operating Expenses | 8.47B | 1.35B |
| Gross Profit | 10.3B | 1.18B |
| EBITDA | 3.0B | -145M |
| EBIT | 2.26B | -163M |
| Interest Expense | 0 | 0 |
| Net Income | 1.75B | -74M |
| EPS | 1.69 | -0.13 |
| Fiscal Year | 2025 | 2025 |
Income Statement Analysis: The Bottom-Line Duel
This income statement comparison exposes the true efficiency and profitability momentum of each company’s operational engine in 2025.
ServiceNow, Inc. Analysis
ServiceNow posts robust revenue growth from $5.9B in 2021 to $13.3B in 2025, with net income surging from $230M to $1.75B. Gross margins hold firm at 77.5%, and net margin sits at a strong 13.2%. The 2025 jump in EBIT by 28% signals accelerating operational efficiency and disciplined cost control.
UiPath Inc. Analysis
UiPath’s revenue climbs steadily from $608M in 2021 to $1.43B in early 2025, but it remains unprofitable with net losses narrowing to $74M. Despite a high gross margin of 82.7%, the negative EBIT margin of -11.4% highlights ongoing challenges scaling expenses. Recent margin improvements suggest some operational stabilization but no profitability yet.
Profitability Strength vs. Growth Struggles
ServiceNow clearly dominates with strong, consistent profitability and expanding margins, reflecting a mature, scalable business model. UiPath shows solid top-line growth but continues to burn cash and struggle with negative margins. For investors prioritizing sustainable earnings, ServiceNow’s profile offers a more attractive risk-reward balance.
Financial Ratios Comparison
These vital ratios act as a diagnostic tool to expose the underlying fiscal health, valuation premiums, and capital efficiency of the companies compared below:
| Ratios | ServiceNow, Inc. (NOW) | UiPath Inc. (PATH) |
|---|---|---|
| ROE | 13.5% | -4.0% |
| ROIC | 9.0% | -7.4% |
| P/E | 90.9 | -108.0 |
| P/B | 12.3 | 4.3 |
| Current Ratio | 0.95 | 2.93 |
| Quick Ratio | 0.95 | 2.93 |
| D/E | 0.25 | 0.04 |
| Debt-to-Assets | 12.3% | 2.7% |
| Interest Coverage | 0 | 0 |
| Asset Turnover | 0.51 | 0.50 |
| Fixed Asset Turnover | 4.29 | 14.41 |
| Payout ratio | 0 | 0 |
| Dividend yield | 0 | 0 |
| Fiscal Year | 2025 | 2025 |
Efficiency & Valuation Duel: The Vital Signs
Financial ratios act as a company’s DNA, revealing hidden risks and operational excellence behind surface-level performance.
ServiceNow, Inc.
ServiceNow delivers a solid 13.48% ROE and a favorable 13.16% net margin, reflecting efficient profitability. However, its valuation is stretched, with a P/E of 90.88 and a P/B of 12.25, indicating expensive stock pricing. The company returns no dividends, focusing instead on reinvestment in R&D at 22.3% of revenue, signaling growth orientation.
UiPath Inc.
UiPath shows negative ROE (-3.99%) and net margin (-5.15%), highlighting ongoing profitability challenges. Its P/E is negative but considered favorable due to losses, while P/B at 4.31 signals moderate valuation. The firm maintains a strong liquidity position (current ratio 2.93) and reinvests heavily in R&D (26.6% of revenue), emphasizing product development over shareholder payouts.
Premium Valuation vs. Operational Struggles
ServiceNow commands a premium valuation with steady profitability, while UiPath struggles with losses but boasts strong liquidity. ServiceNow balances risk and reward for growth-focused investors; UiPath suits those accepting volatility for potential turnaround gains.
Which one offers the Superior Shareholder Reward?
I observe that neither ServiceNow nor UiPath pays dividends, focusing instead on reinvestment and buybacks. ServiceNow’s free cash flow per share stands at 4.41 in 2025, funding a robust buyback program that enhances shareholder value sustainably. UiPath, with negative net margins and lower free cash flow (0.55 per share), shows minimal buyback intensity. ServiceNow’s disciplined capital allocation and stronger cash flow underpin a more reliable and superior total return profile in 2026.
Comparative Score Analysis: The Strategic Profile
The radar chart reveals the fundamental DNA and trade-offs of ServiceNow, Inc. and UiPath Inc., highlighting their strategic strengths and vulnerabilities:
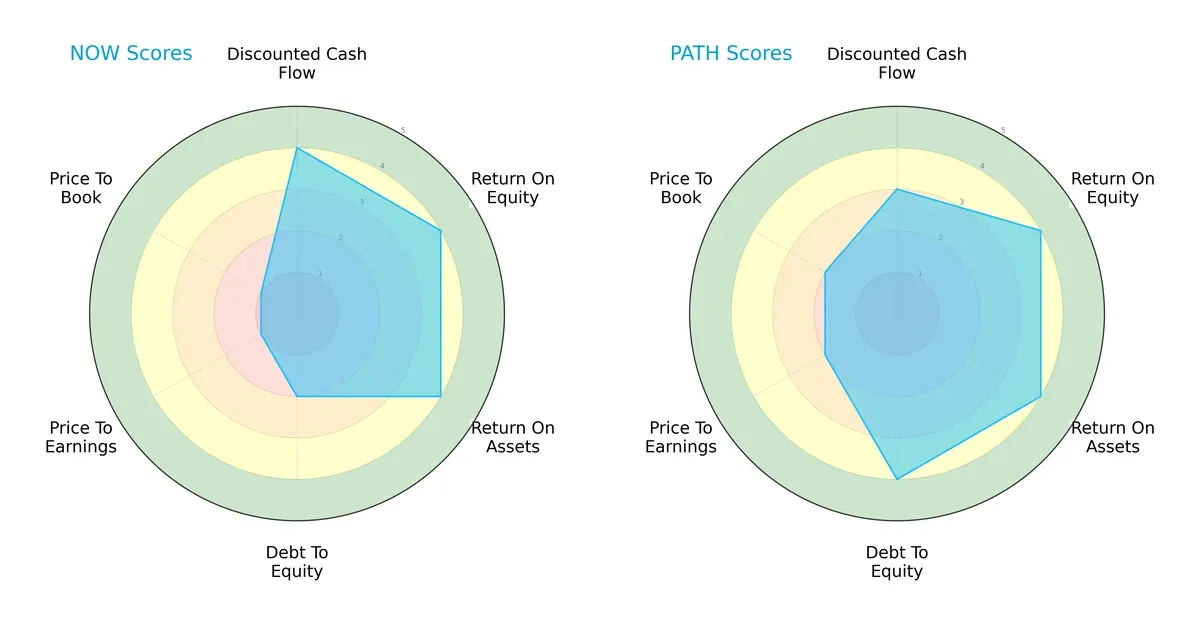
ServiceNow shows strength in discounted cash flow and profitability metrics but struggles with valuation scores, indicating possible overvaluation. UiPath presents a more balanced financial profile with stronger debt management and moderately better valuation scores. ServiceNow relies heavily on operational efficiency, while UiPath maintains steadier financial leverage control.
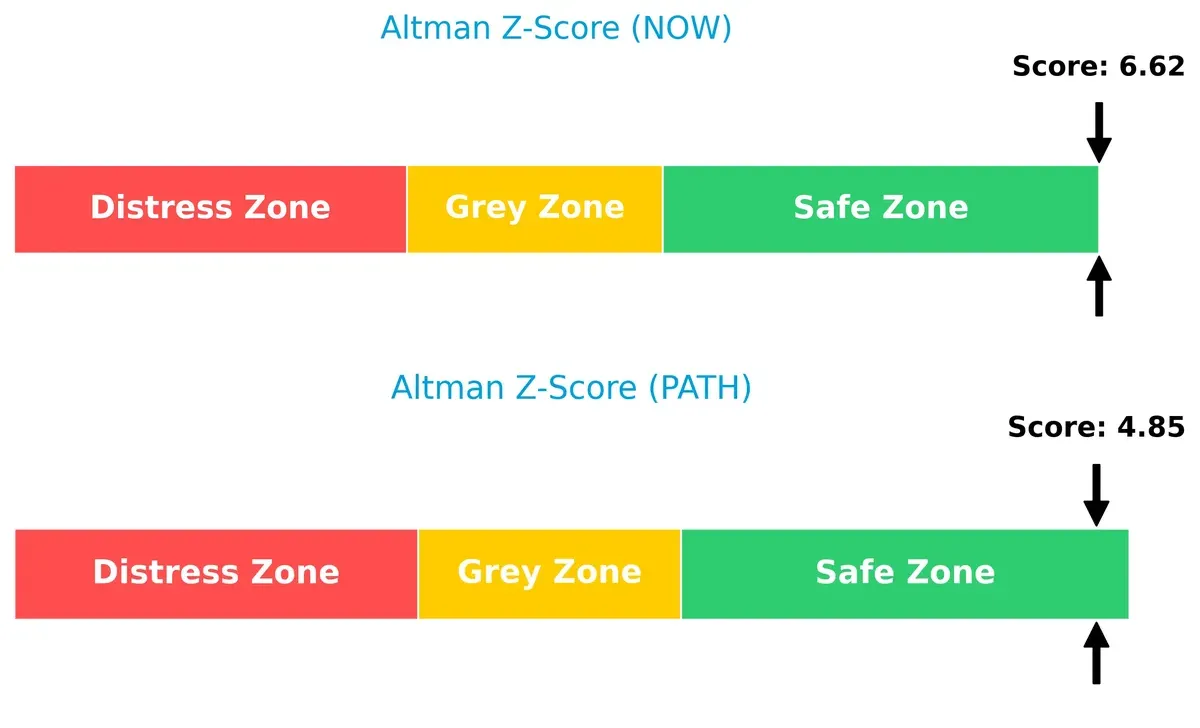
Bankruptcy Risk: Solvency Showdown
ServiceNow’s Altman Z-Score of 6.62 versus UiPath’s 4.85 places both companies firmly in the safe zone, though ServiceNow’s higher score suggests a stronger buffer against insolvency risks in this economic cycle:
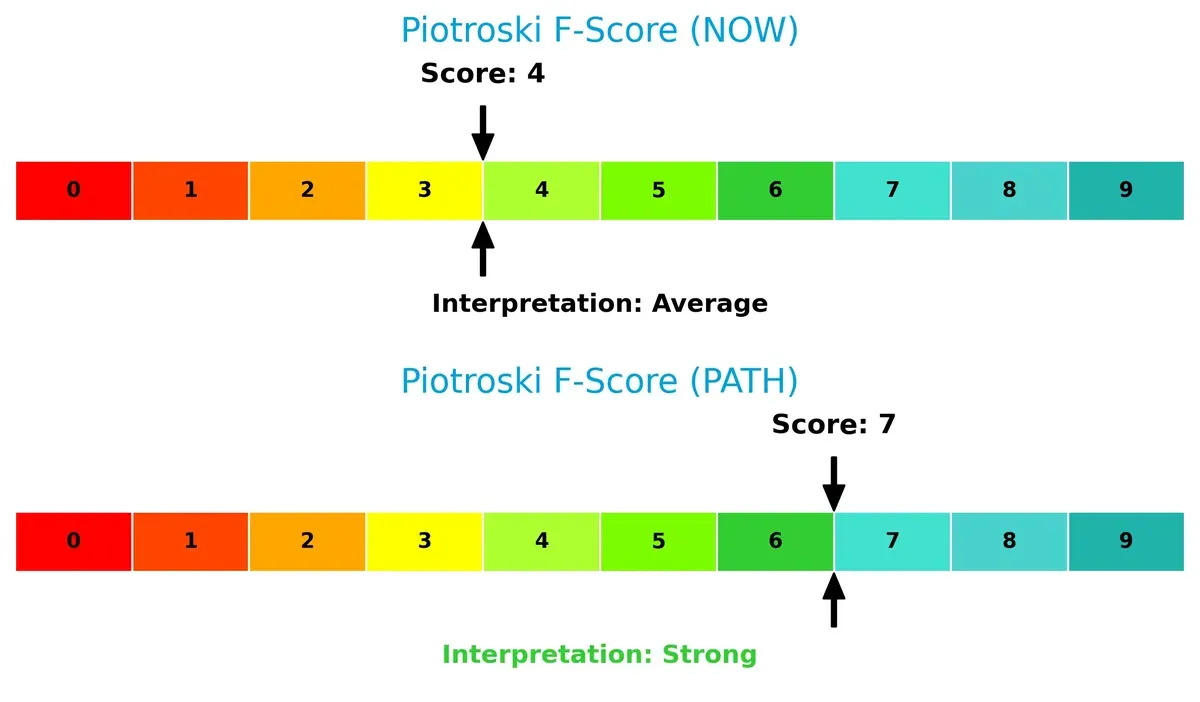
Financial Health: Quality of Operations
UiPath’s Piotroski F-Score of 7 indicates strong financial health, outperforming ServiceNow’s average score of 4, which signals potential red flags in internal metrics and operational efficiency:
How are the two companies positioned?
This section dissects the operational DNA of ServiceNow and UiPath by comparing their revenue distribution and internal dynamics. The goal is to confront their economic moats and identify which model delivers the most resilient, sustainable competitive advantage today.
Revenue Segmentation: The Strategic Mix
This visual comparison dissects how ServiceNow and UiPath diversify their income streams and where their primary sector bets lie:
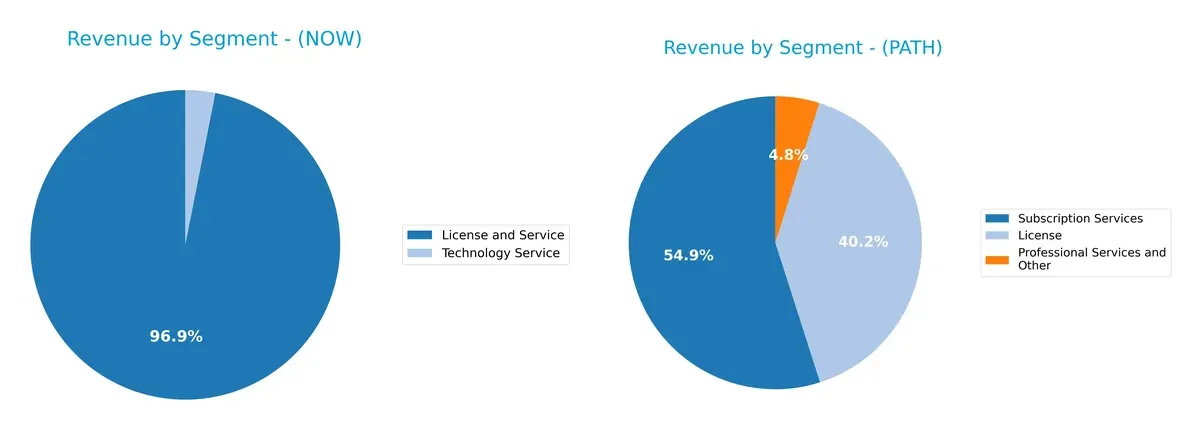
ServiceNow’s revenue dwarfs UiPath’s, anchored by a dominant $12.9B License and Service segment in 2025. UiPath shows a more balanced mix with $802M Subscription Services and $587M License revenue, signaling diversification. ServiceNow’s heavy reliance on licenses exposes it to concentration risk but leverages ecosystem lock-in. UiPath’s spread across licenses, subscriptions, and services supports resilience amid market shifts.
Strengths and Weaknesses Comparison
This table compares the strengths and weaknesses of ServiceNow, Inc. and UiPath Inc.:
ServiceNow Strengths
- Large, diversified revenue with $12.9B in License and Service
- Strong global presence led by $8.3B North America sales
- Favorable low debt-to-assets at 12.3%
- High fixed asset turnover at 4.29x
UiPath Strengths
- Favorable strong liquidity with current ratio of 2.93
- Very low debt-to-assets at 2.72% and low debt/equity of 0.04
- High fixed asset turnover at 14.41x
- Balanced geographic revenue across Americas, Asia Pacific, EMEA
ServiceNow Weaknesses
- Unfavorable valuation metrics: PE of 90.88 and PB of 12.25
- Current ratio below 1 at 0.95 signals liquidity risk
- Zero dividend yield
- Neutral to unfavorable returns: ROIC 8.98% close to WACC 8.31%
- Moderate net margin at 13.16%
UiPath Weaknesses
- Negative profitability with net margin -5.15% and ROE -3.99%
- Unfavorable interest coverage at zero
- Unfavorable asset turnover at 0.5x
- Unfavorable PB of 4.31 despite negative earnings
- Zero dividend yield
Overall, ServiceNow’s strengths lie in scale, global diversification, and conservative leverage, but valuation and liquidity metrics raise caution. UiPath shows strong liquidity and low leverage but struggles with profitability and asset efficiency. These contrasts highlight differing strategic focuses and operational challenges for each company.
The Moat Duel: Analyzing Competitive Defensibility
A structural moat protects long-term profits from competitive erosion. It is the only sustainable shield against market encroachment:
ServiceNow, Inc.: Workflow Automation with Switching Costs
ServiceNow’s primary moat stems from high switching costs embedded in its enterprise cloud platform. Its 17% EBIT margin confirms strong margin stability. Expansion into AI-driven workflow automation in 2026 could further cement this advantage.
UiPath Inc.: AI-Driven RPA with Network Effects
UiPath relies on network effects within its robotic process automation ecosystem, contrasting ServiceNow’s switching cost moat. Despite a negative EBIT margin, growing revenues and expanding AI capabilities hint at improving competitive positioning and market reach.
Moat Strength Showdown: Switching Costs vs. Network Effects
ServiceNow’s switching cost moat is wider, reflected in superior profitability and margin stability. UiPath’s network effect moat is promising but less mature. ServiceNow is better positioned to defend market share in 2026.
Which stock offers better returns?
Over the past 12 months, both ServiceNow, Inc. (NOW) and UiPath Inc. (PATH) experienced significant price declines, with distinct decelerating bearish trends and varying volatility levels.
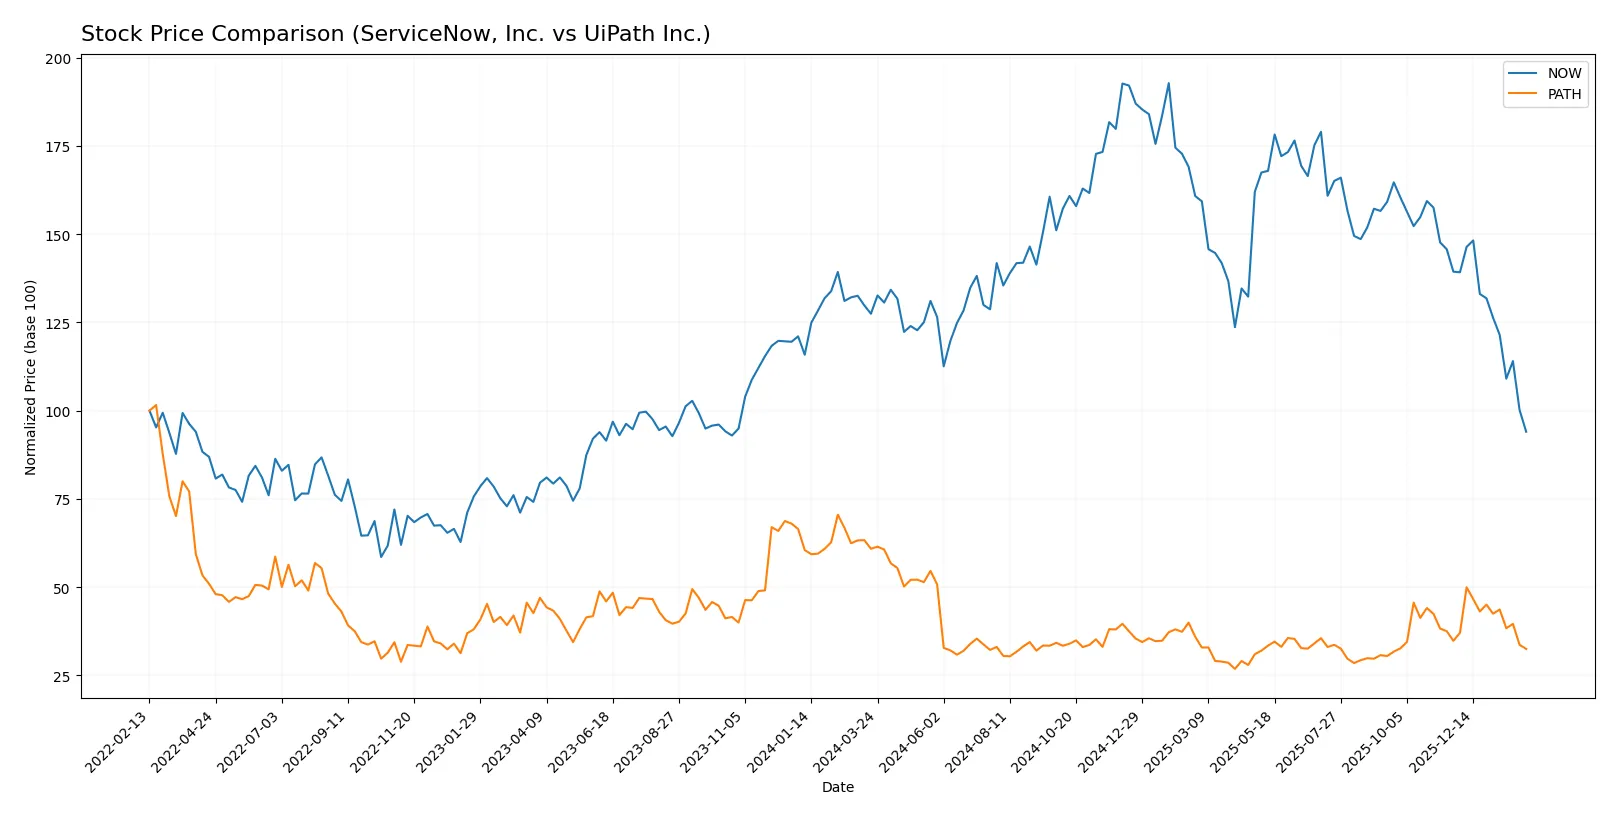
Trend Comparison
ServiceNow’s stock dropped 26.22% over the last year, showing a bearish trend with decelerating momentum and high volatility (std. dev. 25.07). The price ranged from $109.77 to $225.00.
UiPath’s stock fell 46.59% over the same period, also bearish and decelerating, but with much lower volatility (std. dev. 2.9). The price fluctuated between $10.04 and $22.97.
UiPath’s decline was more pronounced than ServiceNow’s, delivering the weakest market performance among the two stocks in the past year.
Target Prices
Analysts present a broad range of target prices for ServiceNow, Inc. and UiPath Inc., reflecting diverse views on growth potential.
| Company | Target Low | Target High | Consensus |
|---|---|---|---|
| ServiceNow, Inc. | 115 | 1315 | 440.64 |
| UiPath Inc. | 14 | 19 | 16.6 |
The consensus target for ServiceNow stands well above its current price of 110, suggesting significant upside. UiPath’s target consensus also exceeds its current price of 12.15, indicating moderate growth expectations.

Don’t Let Luck Decide Your Entry Point
Optimize your entry points with our advanced ProRealTime indicators. You’ll get efficient buy signals with precise price targets for maximum performance. Start outperforming now!
How do institutions grade them?
ServiceNow, Inc. Grades
The following table summarizes recent grades for ServiceNow, Inc. from major institutions.
| Grading Company | Action | New Grade | Date |
|---|---|---|---|
| Citigroup | Maintain | Buy | 2026-01-30 |
| Evercore ISI Group | Maintain | Outperform | 2026-01-29 |
| Macquarie | Maintain | Neutral | 2026-01-29 |
| BTIG | Maintain | Buy | 2026-01-29 |
| RBC Capital | Maintain | Outperform | 2026-01-29 |
| Keybanc | Maintain | Underweight | 2026-01-29 |
| Stifel | Maintain | Buy | 2026-01-29 |
| DA Davidson | Maintain | Buy | 2026-01-29 |
| Cantor Fitzgerald | Maintain | Overweight | 2026-01-29 |
| Needham | Maintain | Buy | 2026-01-29 |
UiPath Inc. Grades
Here are the latest institutional grades assigned to UiPath Inc.
| Grading Company | Action | New Grade | Date |
|---|---|---|---|
| Barclays | Maintain | Equal Weight | 2026-01-12 |
| RBC Capital | Maintain | Sector Perform | 2026-01-05 |
| RBC Capital | Maintain | Sector Perform | 2025-12-10 |
| Morgan Stanley | Maintain | Equal Weight | 2025-12-09 |
| DA Davidson | Maintain | Neutral | 2025-12-05 |
| Mizuho | Maintain | Neutral | 2025-12-04 |
| Evercore ISI Group | Maintain | In Line | 2025-12-04 |
| RBC Capital | Maintain | Sector Perform | 2025-12-04 |
| Barclays | Maintain | Equal Weight | 2025-12-04 |
| Wells Fargo | Maintain | Equal Weight | 2025-12-04 |
Which company has the best grades?
ServiceNow, Inc. consistently receives stronger grades, including multiple Buy and Outperform ratings. UiPath’s grades cluster around Neutral and Equal Weight. This difference signals higher institutional confidence in ServiceNow’s near-term prospects. Investors may interpret this as a sign of relative market favorability.
Risks specific to each company
The following categories identify the critical pressure points and systemic threats facing both firms in the 2026 market environment:
1. Market & Competition
ServiceNow, Inc.
- Dominates enterprise cloud workflow with strong partnerships but faces rising SaaS competition.
UiPath Inc.
- Operates in RPA with innovative AI but competes in a fragmented, fast-evolving automation market.
2. Capital Structure & Debt
ServiceNow, Inc.
- Maintains low debt-to-equity (0.25), signaling prudent leverage and strong balance sheet.
UiPath Inc.
- Extremely low debt (0.04 D/E), but interest coverage at zero flags potential liquidity risks.
3. Stock Volatility
ServiceNow, Inc.
- Beta near 1 (0.978) implies market-correlated volatility; recent price drop of nearly 7%.
UiPath Inc.
- Beta slightly higher (1.072), indicating marginally higher volatility; shares declined 3.1% recently.
4. Regulatory & Legal
ServiceNow, Inc.
- Faces typical data privacy and cybersecurity regulations impacting SaaS providers globally.
UiPath Inc.
- Subject to complex compliance in US, Romania, Japan; evolving AI regulations increase legal exposure.
5. Supply Chain & Operations
ServiceNow, Inc.
- Relies on cloud infrastructure partners; operational risk mitigated by scale and diversified sectors served.
UiPath Inc.
- Dependent on software development and cloud providers; smaller scale heightens operational vulnerability.
6. ESG & Climate Transition
ServiceNow, Inc.
- Increasing ESG focus expected; no dividend yield may reinvest in sustainable initiatives.
UiPath Inc.
- ESG profile evolving; no dividend yield but higher liquidity ratios support sustainability investments.
7. Geopolitical Exposure
ServiceNow, Inc.
- US-based with global customers; geopolitical tensions may affect multinational contracts.
UiPath Inc.
- Operations span US, Romania, Japan; geopolitical risks amplified by exposure to diverse regulatory environments.
Which company shows a better risk-adjusted profile?
ServiceNow’s key risk is stretched valuation and weak liquidity ratios. UiPath’s largest risk is unprofitable operations combined with zero interest coverage, signaling cash flow stress. Despite UiPath’s higher debt safety and liquidity, ServiceNow’s mature market position and safer credit profile give it a better risk-adjusted stance. However, ServiceNow’s expensive valuation remains a caution. Recent data shows ServiceNow’s current ratio below 1.0, a red flag contrasting with UiPath’s strong liquidity but troubling negative margins. I judge ServiceNow as the more balanced but costly risk, while UiPath carries operational and capital structure risks demanding careful monitoring.
Final Verdict: Which stock to choose?
ServiceNow’s superpower lies in its robust cash generation and improving profitability, signaling operational strength. Its point of vigilance is a stretched current ratio, indicating liquidity pressures. This stock suits investors targeting aggressive growth with tolerance for valuation premiums.
UiPath’s strategic moat is its expanding automation platform with recurring revenue potential. It offers a safer balance sheet profile compared to ServiceNow but struggles with consistent profitability. This makes it a fit for Growth at a Reasonable Price (GARP) investors seeking improving fundamentals.
If you prioritize strong cash flow and sustained profitability, ServiceNow outshines due to its growing operational returns despite valuation risks. However, if you seek a more conservative balance sheet with a focus on growth potential, UiPath offers better stability and a path to profitability, though currently less proven.
Disclaimer: Investment carries a risk of loss of initial capital. The past performance is not a reliable indicator of future results. Be sure to understand risks before making an investment decision.
Go Further
I encourage you to read the complete analyses of ServiceNow, Inc. and UiPath Inc. to enhance your investment decisions: