Quantum technology is rapidly transforming the landscape of computing and cybersecurity, attracting significant investor attention. IonQ, Inc. and Arqit Quantum Inc. are two prominent players in this space, with IonQ focusing on advanced quantum computing hardware and Arqit specializing in quantum-powered cybersecurity software. Both companies offer innovative solutions that overlap in the quantum technology sector. In this article, I will guide you through a detailed comparison to help determine which company presents the most compelling investment opportunity.

Table of contents
Companies Overview
I will begin the comparison between IonQ and Arqit Quantum by providing an overview of these two companies and their main differences.
IonQ Overview
IonQ, Inc. specializes in developing general-purpose quantum computing systems, offering access to quantum computers with 20 qubits. The company provides cloud-based quantum computing services through major platforms like AWS, Microsoft Azure, and Google Cloud, alongside its own cloud service. Founded in 2015 and headquartered in College Park, Maryland, IonQ operates in the computer hardware industry with a market capitalization of approximately 16.6B USD.
Arqit Quantum Overview
Arqit Quantum Inc. delivers cybersecurity services via satellite and terrestrial platforms, focusing on encryption solutions. Its QuantumCloud technology enables devices to create encryption keys through lightweight software agents. Based in London, UK, Arqit operates in the software infrastructure sector and has a market capitalization near 384M USD. It employs 82 people and trades on the NASDAQ Capital Market.
Key similarities and differences
Both IonQ and Arqit operate in the technology sector with a focus on quantum-related innovations, but IonQ is hardware-oriented, developing quantum computing systems, while Arqit emphasizes software-based cybersecurity solutions. IonQ’s business model centers on providing quantum computing access via cloud platforms, whereas Arqit focuses on secure communications through encryption software. IonQ is significantly larger in market cap and workforce compared to Arqit.
Income Statement Comparison
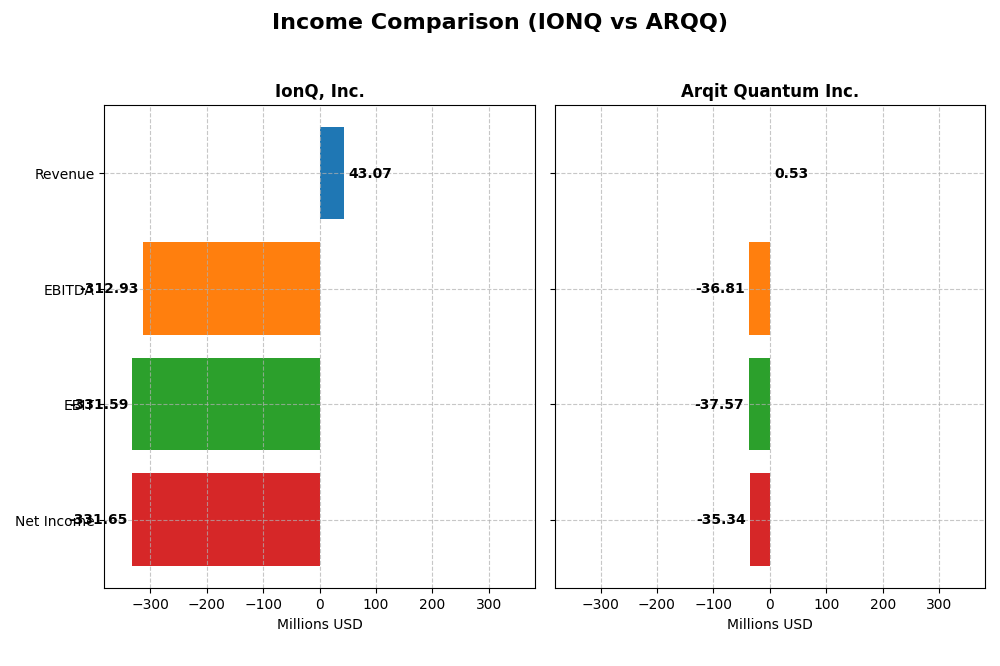
The table below compares the key income statement metrics for IonQ, Inc. and Arqit Quantum Inc. based on their most recent fiscal year data.
| Metric | IonQ, Inc. (2024) | Arqit Quantum Inc. (2025) |
|---|---|---|
| Market Cap | 16.6B | 384M |
| Revenue | 43M | 0.53M |
| EBITDA | -313M | -37M |
| EBIT | -332M | -38M |
| Net Income | -332M | -35M |
| EPS | -1.56 | -2.56 |
| Fiscal Year | 2024 | 2025 |
Income Statement Interpretations
IonQ, Inc.
IonQ’s revenue rose sharply from $0 in 2020 to $43M in 2024, but net income deteriorated from -$15M to -$332M over the same period. Gross margin remained low at 8.87%, indicating minimal profitability on sales, while net margin stayed deeply negative at -770%. Despite a 95% revenue increase in 2024, net losses widened and margins worsened, reflecting high expenses outpacing growth.
Arqit Quantum Inc.
Arqit’s revenue grew substantially from $47K in 2021 to $530K in 2025, with net income recovering from -$272M to -$35M. Gross margin remained negative at -43.4%, and net margin was also deeply negative at -6668%. However, the company showed favorable growth trends in revenue and net income in the latest year, with improving margins and EPS growth signaling operational progress despite ongoing losses.
Which one has the stronger fundamentals?
Arqit demonstrates stronger fundamentals with favorable overall growth in revenue, net income, and margins across the period, contrasting IonQ’s persistent losses and unfavorable margin trends. IonQ’s high operating expenses and widening net losses weigh against its revenue gains. Arqit’s improving financial metrics and positive long-term growth indicators suggest better income statement resilience despite both companies remaining unprofitable.
Financial Ratios Comparison
Below is a comparison of the most recent financial ratios for IonQ, Inc. and Arqit Quantum Inc. based on their latest full fiscal year data.
| Ratios | IonQ, Inc. (2024) | Arqit Quantum Inc. (2025) |
|---|---|---|
| ROE | -86.4% | -129.8% |
| ROIC | -48.2% | -127.5% |
| P/E | -26.8 | -15.1 |
| P/B | 23.2 | 19.6 |
| Current Ratio | 10.5 | 2.69 |
| Quick Ratio | 10.0 | 2.69 |
| D/E (Debt-to-Equity) | 0.046 | 0.026 |
| Debt-to-Assets | 3.5% | 1.7% |
| Interest Coverage | 0 | -803 |
| Asset Turnover | 0.085 | 0.012 |
| Fixed Asset Turnover | 0.69 | 0.74 |
| Payout ratio | 0 | 0 |
| Dividend yield | 0 | 0 |
Interpretation of the Ratios
IonQ, Inc.
IonQ’s financial ratios reveal several weaknesses, including deeply negative net margin (-770%) and return on equity (-86.4%), signaling ongoing losses and low profitability. The firm shows a high current ratio (10.5) but with unfavorable implications, and a high price-to-book ratio (23.18) raising valuation concerns. IonQ does not pay dividends, reflecting its reinvestment focus amid negative earnings and cash flows.
Arqit Quantum Inc.
Arqit Quantum also exhibits unfavorable profitability ratios, such as a net margin of -6668% and return on equity of -130%, indicating significant losses. The company maintains a solid liquidity position with current and quick ratios at 2.69, and low leverage ratios. Arqit does not pay dividends, consistent with its early-stage investment in R&D and growth initiatives amid negative returns.
Which one has the best ratios?
Both companies show predominantly unfavorable financial ratios, with IonQ having 71% unfavorable metrics versus Arqit’s 64%. Arqit displays slightly better liquidity and leverage ratios, while IonQ has a marginally more favorable price-to-earnings metric. Neither company currently generates profits or dividends, reflecting high risk profiles for investors.
Strategic Positioning
This section compares the strategic positioning of IonQ and Arqit Quantum, including market position, key segments, and exposure to technological disruption:
IonQ
- Leading quantum computing hardware company with high market cap and competitive pressure on NYSE.
- Develops general-purpose quantum computers with cloud access via major platforms like AWS, Microsoft, and Google.
- Positioned in a rapidly evolving quantum hardware sector with potential disruption but high technological risks.
Arqit Quantum
- Smaller market cap, focused on cybersecurity software infrastructure, listed on NASDAQ Capital Market.
- Provides quantum cybersecurity services via satellite and terrestrial platforms with lightweight software agents.
- Operates in quantum cybersecurity, an emerging tech space with growing demand but also evolving competitive landscape.
IonQ vs Arqit Quantum Positioning
IonQ has a diversified approach focusing on quantum hardware and cloud computing access, benefiting from multiple large cloud partnerships. Arqit concentrates on quantum cybersecurity software with a smaller team and market cap. IonQ’s scale offers broader market penetration, while Arqit’s specialization targets niche security applications.
Which has the best competitive advantage?
Both companies are currently shedding value with ROIC below WACC; however, IonQ faces declining profitability, while Arqit shows improving ROIC trends despite low profitability, indicating a slightly more favorable outlook on operational efficiency.
Stock Comparison
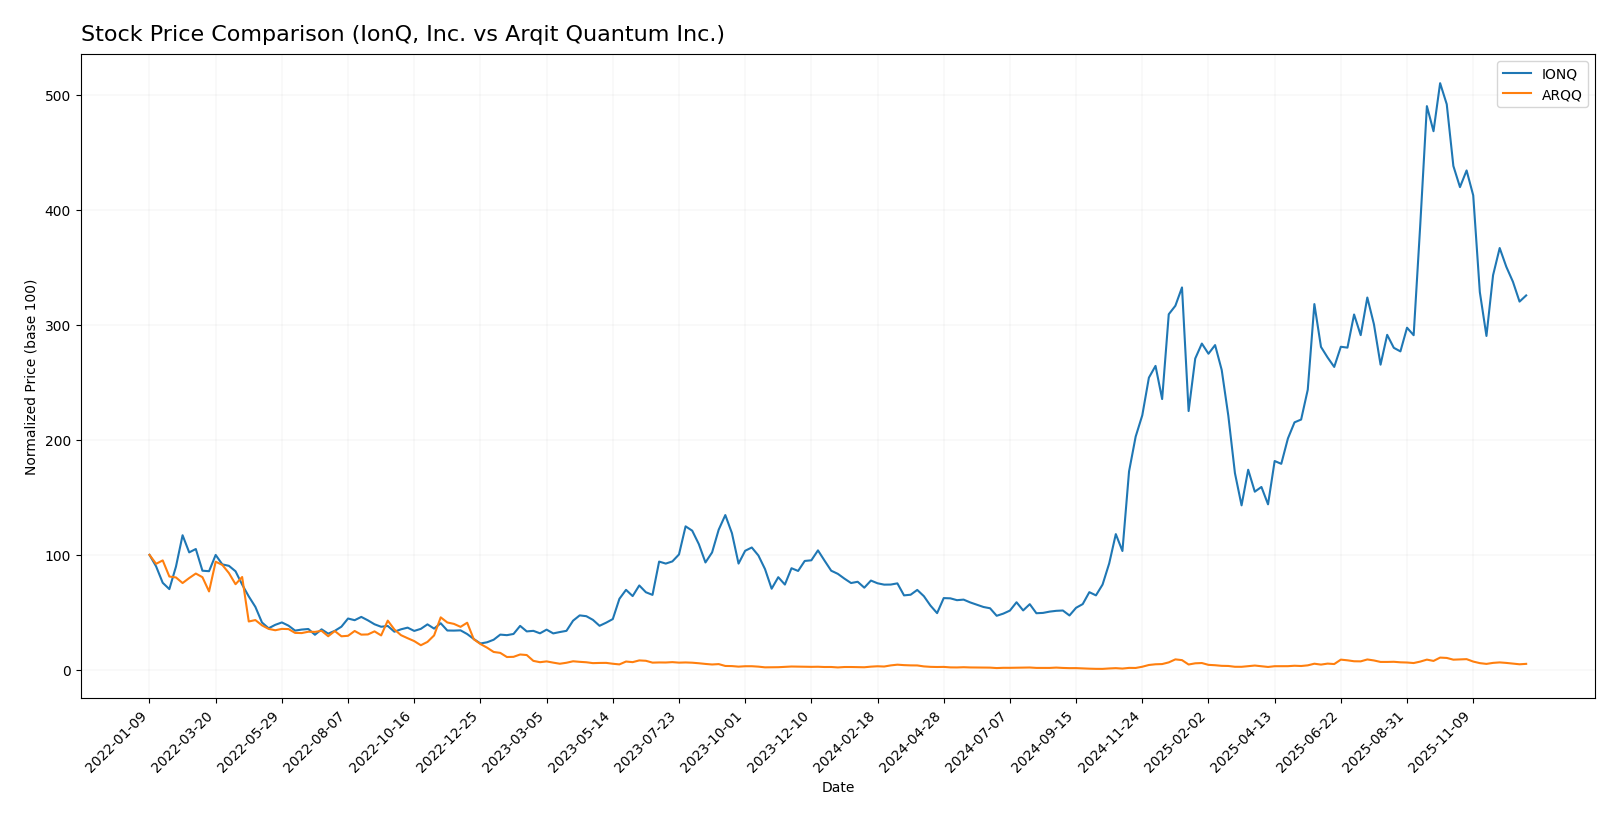
The past year showed strong bullish momentum for IonQ, Inc. and Arqit Quantum Inc., with IonQ exhibiting a notably higher percentage gain despite recent deceleration and both stocks experiencing seller dominance in the final quarter.
Trend Analysis
IonQ, Inc. stock price rose sharply by 319.09% over the past 12 months, marking a bullish trend with decelerating acceleration. The price ranged between 6.76 and 73.28, with recent weeks showing a negative slope of -1.48 and a 25.69% decline.
Arqit Quantum Inc. gained 85.21% over the same period, reflecting a bullish but decelerating trend. Its price fluctuated from 4.19 to 49.92, with a recent sharper drop of 40.85% and trend slope at -1.77, indicating increased downward pressure.
Comparatively, IonQ delivered the highest market performance with a 319.09% increase, outperforming Arqit’s 85.21% rise, despite both companies facing recent short-term declines and seller-dominant trading conditions.
Target Prices
The current analyst consensus for target prices indicates optimistic upside potential for both IonQ, Inc. and Arqit Quantum Inc.
| Company | Target High | Target Low | Consensus |
|---|---|---|---|
| IonQ, Inc. | 100 | 55 | 72.57 |
| Arqit Quantum Inc. | 60 | 60 | 60 |
Analysts expect IonQ’s stock to rise significantly from its current price of $46.77, with a consensus target of $72.57, while Arqit Quantum’s target price is well above its $24.54 market price, suggesting strong growth expectations.
Analyst Opinions Comparison
This section compares analysts’ ratings and grades for IonQ, Inc. and Arqit Quantum Inc.:
Rating Comparison
IONQ Rating
- Rated C- with an overall score of 1, indicating a very unfavorable financial standing.
- Discounted Cash Flow Score is 1, signaling very unfavorable valuation based on future cash flow.
- Return on Equity Score is 1, denoting very unfavorable efficiency in generating shareholder profit.
- Return on Assets Score is 1, indicating very unfavorable asset utilization.
- Debt To Equity Score is 4, reflecting favorable financial risk with low reliance on debt.
ARQQ Rating
- Rated C with an overall score of 2, reflecting a moderate financial standing.
- Discounted Cash Flow Score is 2, showing a moderate valuation based on future cash flow.
- Return on Equity Score is 1, also very unfavorable in generating shareholder profit.
- Return on Assets Score is 1, similarly very unfavorable in asset utilization.
- Debt To Equity Score is 4, also favorable, indicating low financial risk from debt levels.
Which one is the best rated?
Arqit Quantum Inc. holds a slightly better overall rating (C vs. C-) and superior scores in discounted cash flow and overall financial standing. Both show similar challenges in profitability metrics, but ARQQ benefits from a more moderate valuation outlook.
Scores Comparison
Here is a comparison of the Altman Z-Score and Piotroski Score for IonQ and Arqit Quantum:
IonQ Scores
- Altman Z-Score: 3.59, indicating a safe zone for bankruptcy risk.
- Piotroski Score: 2, classified as very weak financial strength.
Arqit Scores
- Altman Z-Score: -1.46, indicating distress zone with high bankruptcy risk.
- Piotroski Score: 2, also classified as very weak financial strength.
Which company has the best scores?
IonQ has a significantly stronger Altman Z-Score, placing it in a safe zone, whereas Arqit is in distress. Both companies share the same very weak Piotroski Score of 2. IonQ’s overall scores suggest better financial stability.
Grades Comparison
The grades assigned to IonQ, Inc. and Arqit Quantum Inc. by various grading companies are as follows:
IonQ, Inc. Grades
The table below shows recent grades for IonQ, Inc. from well-known grading companies:
| Grading Company | Action | New Grade | Date |
|---|---|---|---|
| Benchmark | Buy | Buy | 2024-08-12 |
| Goldman Sachs | Hold | Neutral | 2024-08-09 |
| Craig-Hallum | Buy | Buy | 2024-08-08 |
| Needham | Buy | Buy | 2024-05-16 |
| Needham | Buy | Buy | 2024-05-09 |
| Goldman Sachs | Hold | Neutral | 2024-02-29 |
| Needham | Buy | Buy | 2024-02-29 |
| Morgan Stanley | Hold | Equal Weight | 2023-10-30 |
| Needham | Buy | Buy | 2023-09-20 |
| Needham | Buy | Buy | 2023-09-19 |
The overall trend for IonQ, Inc. shows a majority of Buy ratings with some Hold/Neutral assessments, indicating a generally positive but cautious outlook.
Arqit Quantum Inc. Grades
The table below presents recent grades for Arqit Quantum Inc. exclusively from HC Wainwright & Co.:
| Grading Company | Action | New Grade | Date |
|---|---|---|---|
| HC Wainwright & Co. | Buy | Buy | 2025-10-13 |
| HC Wainwright & Co. | Buy | Buy | 2025-09-18 |
| HC Wainwright & Co. | Buy | Buy | 2024-12-31 |
| HC Wainwright & Co. | Buy | Buy | 2024-12-06 |
| HC Wainwright & Co. | Buy | Buy | 2024-07-11 |
| HC Wainwright & Co. | Buy | Buy | 2024-05-29 |
| HC Wainwright & Co. | Buy | Buy | 2024-05-15 |
| HC Wainwright & Co. | Buy | Buy | 2023-11-22 |
| HC Wainwright & Co. | Buy | Buy | 2023-09-27 |
| HC Wainwright & Co. | Buy | Buy | 2023-09-26 |
Arqit Quantum Inc. has consistently received Buy ratings from HC Wainwright & Co., reflecting a strong positive consensus from this single grading source.
Which company has the best grades?
Arqit Quantum Inc. has received uniformly positive Buy ratings from one grading company, whereas IonQ, Inc. has a mix of Buy and Neutral/Hold ratings from multiple firms. This consistency in Arqit’s grades may suggest stronger confidence from its grading source, potentially influencing investors’ perceptions of stability and growth prospects differently compared to IonQ.
Strengths and Weaknesses
Below is a comparative table highlighting the key strengths and weaknesses of IonQ, Inc. (IONQ) and Arqit Quantum Inc. (ARQQ) based on the latest financial and strategic data.
| Criterion | IonQ, Inc. (IONQ) | Arqit Quantum Inc. (ARQQ) |
|---|---|---|
| Diversification | Limited product segmentation; focus on quantum computing hardware | Limited product segmentation; focus on quantum encryption software |
| Profitability | Unfavorable: negative net margin (-770%) and declining ROIC; destroying value | Unfavorable: highly negative net margin (-6668%) but improving ROIC trend; slightly unfavorable value creation |
| Innovation | Strong emphasis on quantum hardware innovation but profitability challenges | Focus on quantum encryption innovation with improving ROIC but still unprofitable |
| Global presence | Moderate, with growing partnerships in quantum tech ecosystem | Emerging global reach, primarily in cybersecurity markets |
| Market Share | Niche leader in quantum computing hardware but small market size | Early-stage player in quantum encryption; market share limited but potential growth |
Key takeaways: Both IonQ and Arqit are pioneering quantum technologies with strong innovation. However, both companies face significant profitability challenges and are currently value destroyers. Arqit’s improving ROIC trend could signal a better path toward sustainable growth, while IonQ struggles with declining returns and high operational costs. Investors should weigh innovation potential against financial risks carefully.
Risk Analysis
Below is a comparative table of key risks for IonQ, Inc. and Arqit Quantum Inc. based on the most recent data from 2025 and 2024.
| Metric | IonQ, Inc. (IONQ) | Arqit Quantum Inc. (ARQQ) |
|---|---|---|
| Market Risk | High beta (2.617) indicates strong volatility | High beta (2.383) indicates strong volatility |
| Debt level | Low debt-to-equity (0.05), low debt-to-assets (3.49%) | Very low debt-to-equity (0.03), low debt-to-assets (1.68%) |
| Regulatory Risk | Moderate, US tech sector compliance required | Moderate, UK and international cybersecurity regulations apply |
| Operational Risk | High given negative net margin (-770%) and weak ROE (-86.4%) | Very high due to extreme negative net margin (-6668%) and ROE (-129.77%) |
| Environmental Risk | Low, technology hardware sector with limited environmental impact | Low, software infrastructure sector with minimal direct environmental impact |
| Geopolitical Risk | Moderate, US-based with cloud partnerships globally | Higher due to UK base and reliance on satellite tech with international reach |
The most impactful risks are operational and market risks for both companies, driven by their significant losses and high volatility. IonQ shows better financial stability and lower bankruptcy risk (Altman Z-Score 3.59, safe zone) than Arqit, which is in financial distress (Altman Z-Score -1.46). Investors should be cautious regarding Arqit’s financial health and operational challenges, while IonQ, despite losses, has a more stable footing but still carries high market risk.
Which Stock to Choose?
IonQ, Inc. shows a 95% revenue growth in 2024 but suffers from unfavorable profitability and financial ratios, including a negative ROE of -86.4% and a high EV/Sales of 205.7. Its debt levels are low, with a favorable debt-to-equity of 0.05, but the company has a very unfavorable global income statement and is rated C- with very unfavorable overall scores.
Arqit Quantum Inc. experienced strong revenue growth of 81% in 2025 and a favorable overall income statement with improving net margin growth. However, it faces unfavorable profitability ratios such as ROE at -130%, and its valuation ratios remain unfavorable. Debt metrics are favorable, debt-to-equity stands at 0.03, and it holds a C rating with moderate overall scores, though its Altman Z-Score signals financial distress.
Investors seeking growth might find Arqit’s improving income statement and growing ROIC more appealing, despite financial challenges, while risk-averse investors valuing low debt and strong balance sheets could view IonQ’s stable debt profile and very favorable rating as noteworthy, though both companies currently display unfavorable profitability and value destruction signals.
Disclaimer: Investment carries a risk of loss of initial capital. The past performance is not a reliable indicator of future results. Be sure to understand risks before making an investment decision.
Go Further
I encourage you to read the complete analyses of IonQ, Inc. and Arqit Quantum Inc. to enhance your investment decisions: