Home > Analyses > Technology > ServiceNow, Inc.
ServiceNow transforms how enterprises run their operations, embedding automation at the core of daily workflows. Its Now Platform leads the software application space by integrating AI, machine learning, and automation to streamline IT, HR, and customer service processes. Known for innovation and robust market influence, ServiceNow shapes the future of digital enterprise management. The key question now is whether its strong fundamentals continue to justify its premium valuation and growth outlook in a competitive tech landscape.

Table of contents
Business Model & Company Overview
ServiceNow, Inc., founded in 2004 and headquartered in Santa Clara, California, commands a dominant position in enterprise cloud computing. It delivers a comprehensive ecosystem through the Now platform, automating workflows with AI, machine learning, and robotic process automation. Its broad suite spans IT service management, security operations, and customer service, uniting complex enterprise functions into a seamless digital experience.
The company’s revenue engine blends subscription-based software with recurring cloud services, driving predictable cash flow across global markets in the Americas, Europe, and Asia. ServiceNow’s integration of hardware-light solutions emphasizes scalable innovation. Its robust platform and expansive client base create a powerful economic moat, positioning it as a key architect in the future of enterprise automation.
Financial Performance & Fundamental Metrics
I analyze ServiceNow, Inc.’s income statement, key financial ratios, and dividend payout policy to assess its profitability, efficiency, and shareholder returns.
Income Statement
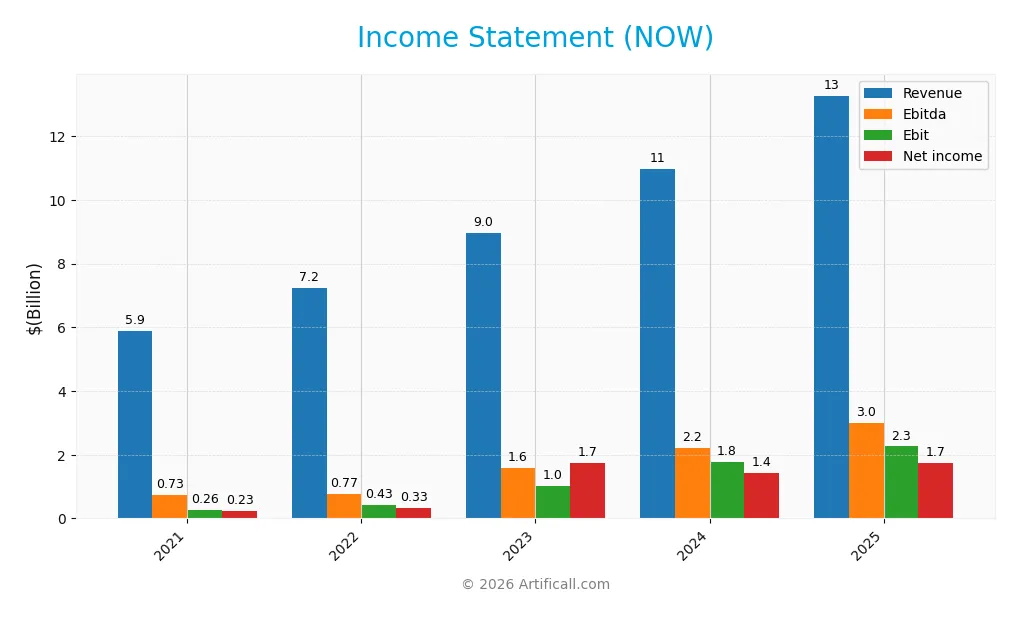
The table below presents ServiceNow, Inc.’s annual income statement highlights from 2021 to 2025, reflecting its revenue growth and profitability trends.
| 2021 | 2022 | 2023 | 2024 | 2025 | |
|---|---|---|---|---|---|
| Revenue | 5.9B | 7.2B | 9.0B | 11.0B | 13.3B |
| Cost of Revenue | 1.4B | 1.6B | 1.9B | 2.3B | 3.0B |
| Operating Expenses | 4.3B | 5.3B | 6.3B | 7.3B | 8.5B |
| Gross Profit | 4.5B | 5.7B | 7.1B | 8.7B | 10.3B |
| EBITDA | 729M | 768M | 1.6B | 2.2B | 3.0B |
| EBIT | 257M | 426M | 1.0B | 1.8B | 2.3B |
| Interest Expense | 28M | 27M | 24M | 23M | 0 |
| Net Income | 230M | 325M | 1.7B | 1.4B | 1.7B |
| EPS | 0.23 | 0.32 | 1.70 | 1.38 | 1.69 |
| Filing Date | 2022-02-03 | 2023-01-31 | 2024-01-25 | 2025-01-30 | 2026-01-29 |
Income Statement Evolution
ServiceNow’s revenue rose sharply from $5.9B in 2021 to $13.3B in 2025, a 125% increase. Net income surged even faster, growing 660% over the same period. Gross margin remained strong near 77.5%, while EBIT margin improved to 17%, reflecting efficient cost controls despite rapid expansion. Net margin growth was steady but modest.
Is the Income Statement Favorable?
The 2025 income statement shows robust fundamentals. Revenue growth accelerated 20.9% year-over-year, with gross profit up 18.4%. Operating expenses scaled proportionally, preserving margins. EBIT jumped 28.4%, driving a favorable EPS rise of 21.9%. Interest expense is zero, supporting net margin at 13.2%. Overall, the income metrics indicate a solid and favorable financial performance.
Financial Ratios
The table below presents key financial ratios for ServiceNow, Inc. over the last five fiscal years, providing insight into profitability, liquidity, leverage, and market valuation:
| Ratios | 2021 | 2022 | 2023 | 2024 | 2025 |
|---|---|---|---|---|---|
| Net Margin | 3.9% | 4.5% | 19.3% | 13.0% | 13.2% |
| ROE | 6.2% | 6.5% | 22.7% | 14.8% | 13.5% |
| ROIC | 3.9% | 3.9% | 7.5% | 9.1% | 9.0% |
| P/E | 559.1 | 240.6 | 83.3 | 153.1 | 90.9 |
| P/B | 34.8 | 15.5 | 18.9 | 22.7 | 12.3 |
| Current Ratio | 1.05 | 1.11 | 1.06 | 1.10 | 0.95 |
| Quick Ratio | 1.05 | 1.11 | 1.06 | 1.10 | 0.95 |
| D/E | 0.60 | 0.44 | 0.30 | 0.24 | 0.25 |
| Debt-to-Assets | 20.5% | 16.8% | 13.1% | 11.2% | 12.3% |
| Interest Coverage | 9.2x | 13.1x | 31.8x | 59.3x | 0.0 |
| Asset Turnover | 0.55 | 0.54 | 0.52 | 0.54 | 0.51 |
| Fixed Asset Turnover | 4.34 | 4.18 | 4.33 | 4.47 | 4.29 |
| Dividend Yield | 0.0% | 0.0% | 0.0% | 0.0% | 0.0% |
Evolution of Financial Ratios
From 2021 to 2025, ServiceNow’s Return on Equity (ROE) improved markedly, peaking above 22% in 2023 before moderating to 13.48% in 2025. The Current Ratio trended downward, falling below 1.0 by 2025, indicating tighter liquidity. Meanwhile, the Debt-to-Equity Ratio steadily declined from 0.60 to 0.25, reflecting reduced leverage and increased financial stability.
Are the Financial Ratios Fovorable?
In 2025, profitability shows strength with a favorable net margin of 13.16%, though ROE and ROIC remain neutral against a WACC of 8.21%. Liquidity ratios present mixed signals: the Current Ratio is unfavorable at 0.95, but the Quick Ratio is neutral. Leverage ratios, including Debt-to-Equity at 0.25 and Interest Coverage infinite, are favorable. Market valuation metrics, such as P/E at 90.88 and P/B at 12.25, are unfavorable, indicating rich pricing. Overall, ratios are slightly favorable with moderate caution warranted.
Shareholder Return Policy
ServiceNow, Inc. does not pay dividends, reflecting a reinvestment strategy aligned with its growth phase. The company maintains no dividend payout, prioritizing free cash flow reinvestment and operational expansion.
It engages in share buybacks to return capital, balancing growth with shareholder returns. This approach supports long-term value creation, assuming continued strong free cash flow and disciplined capital allocation.
Score analysis
Here is an overview of ServiceNow, Inc.’s key financial scores reflecting valuation, profitability, and leverage:
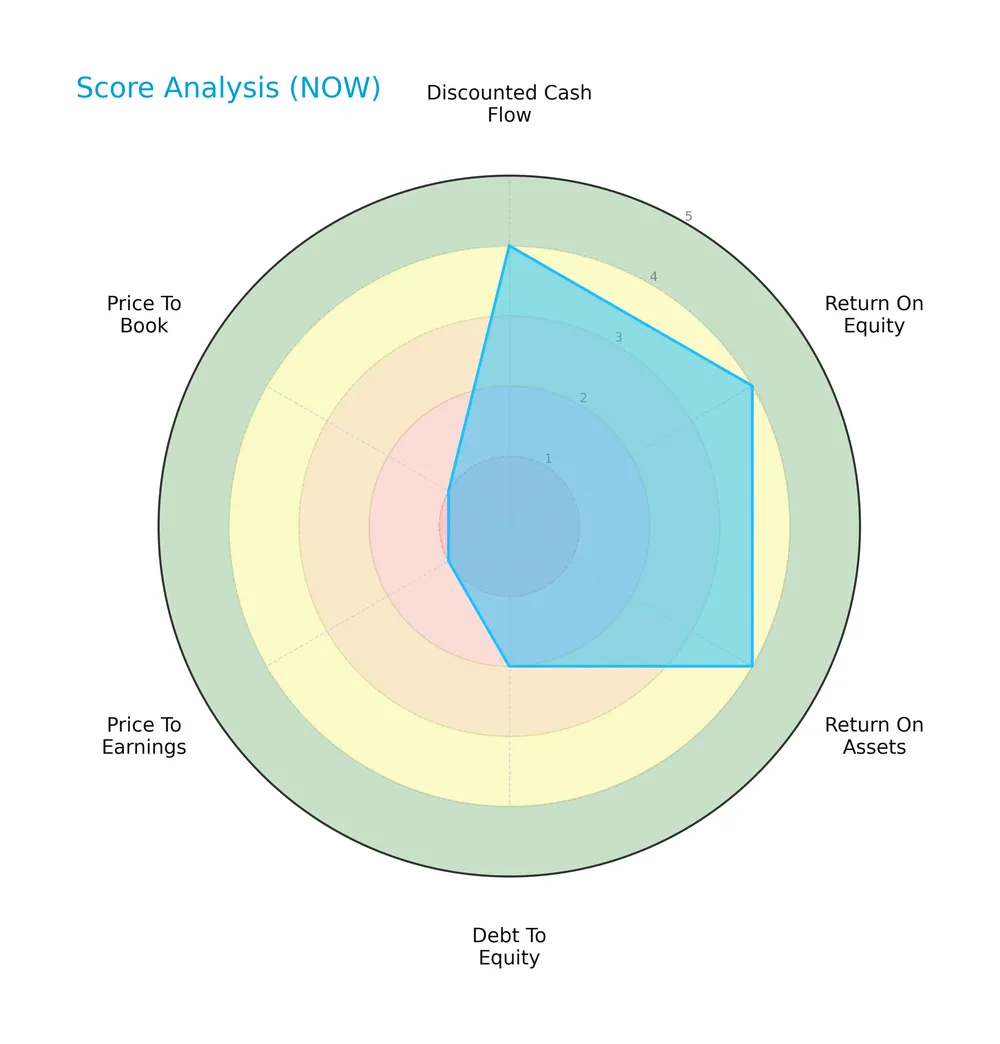
The company shows strong discounted cash flow, return on equity, and return on assets scores at 4 each, indicating solid profitability and cash generation. Debt to equity scores moderately at 2, suggesting manageable leverage. However, valuation metrics price to earnings and price to book score very low at 1, signaling expensive market pricing relative to earnings and book value.
Analysis of the company’s bankruptcy risk
ServiceNow’s Altman Z-Score positions it firmly in the safe zone, indicating a low bankruptcy risk and strong financial stability:

Is the company in good financial health?
The Piotroski Score diagram helps assess the company’s overall financial strength and quality of earnings:

With a Piotroski Score of 4, ServiceNow exhibits average financial health. This suggests moderate profitability, liquidity, and operational efficiency, but it does not demonstrate the robust strength seen in higher-scoring firms.
Competitive Landscape & Sector Positioning
This section analyzes ServiceNow, Inc.’s strategic positioning within the software application sector. It reviews revenue by segment, key products, and main competitors. I will assess whether ServiceNow holds a competitive advantage over its rivals.
Strategic Positioning
ServiceNow concentrates on enterprise cloud software, focusing on digital workflow and IT operations management products. Geographically, it maintains a strong presence in North America, with growing revenue contributions from EMEA and Asia Pacific, reflecting a balanced but North America-centric expansion.
Revenue by Segment
This pie chart illustrates ServiceNow, Inc.’s revenue composition for fiscal year 2025, highlighting contributions from License and Service and Technology Service segments.
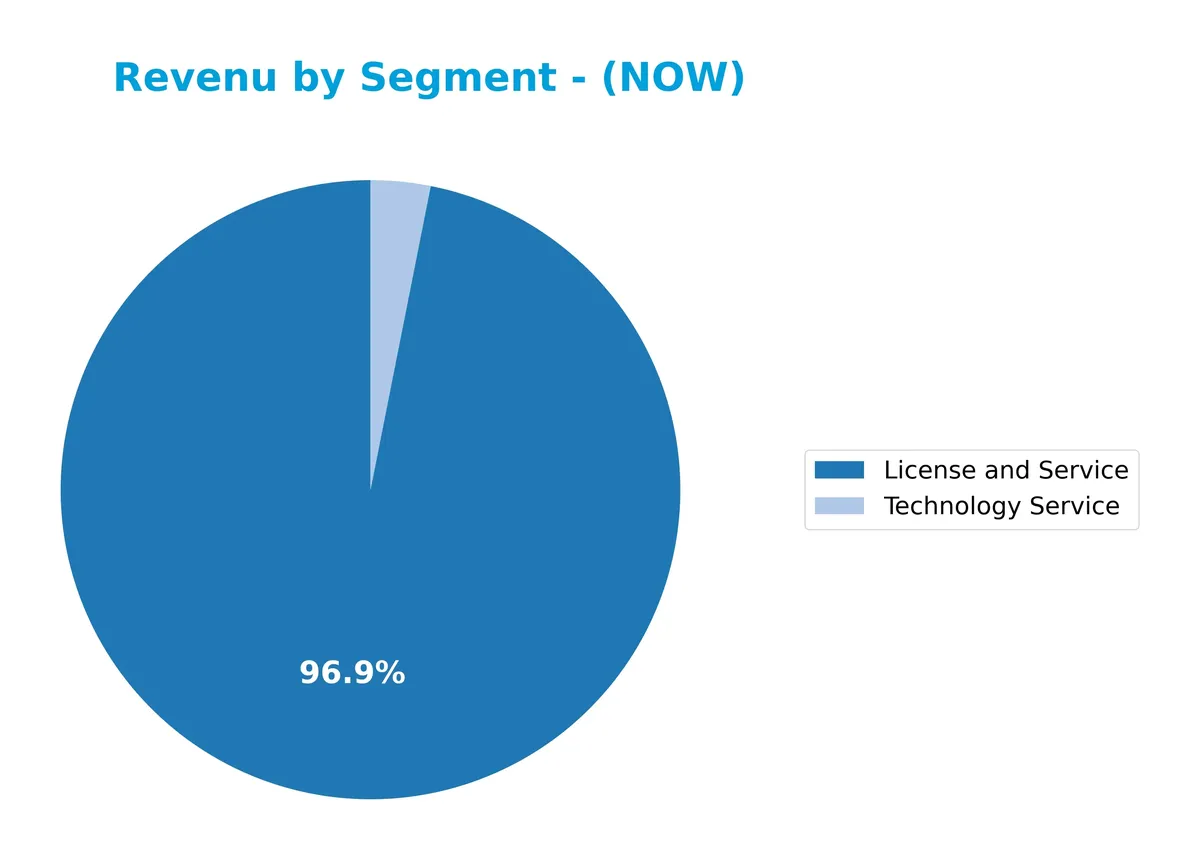
License and Service dominates ServiceNow’s revenue with $12.9B in 2025, reflecting strong growth from $9.4B in 2024’s combined Digital Workflow and ITOM products. Technology Service remains a minor contributor at $414M. The trend shows accelerating revenue concentration in License and Service, signaling robust demand for core software offerings and a potential risk if diversification stalls.
Key Products & Brands
The table below summarizes ServiceNow’s primary products and brands with their core functionalities:
| Product | Description |
|---|---|
| Now Platform | Enterprise cloud platform offering workflow automation, AI, machine learning, robotic process automation, and analytics. |
| IT Service Management (ITSM) | Suite for managing IT services across employees, customers, and partners. |
| IT Operations Management (ITOM) | Connects physical and cloud IT infrastructure for operational efficiency. |
| IT Asset Management (ITAM) | Automates the lifecycle of IT assets. |
| Security Operations | Integrates internal and third-party security workflows. |
| Governance, Risk, and Compliance | Products managing enterprise risk and resilience. |
| Customer Service Management | Solutions focused on enhancing customer service delivery. |
| Field Service Management | Applications managing field workforce and service operations. |
| App Engine & IntegrationHub | Tools to build custom applications and extend workflows across platforms. |
ServiceNow generates most revenue from License and Service sales, notably its Digital Workflow and ITOM products. Its broad suite addresses IT management, security, compliance, and customer service needs across diverse industries.
Main Competitors
There are 33 competitors in total; here are the top 10 leaders by market capitalization:
| Competitor | Market Cap. |
|---|---|
| Salesforce, Inc. | 242B |
| Shopify Inc. | 210B |
| AppLovin Corporation | 209B |
| Intuit Inc. | 175B |
| Uber Technologies, Inc. | 172B |
| ServiceNow, Inc. | 153B |
| Cadence Design Systems, Inc. | 84B |
| Snowflake Inc. | 73B |
| Autodesk, Inc. | 61B |
| Workday, Inc. | 55B |
ServiceNow ranks 6th among 33 competitors. Its market cap is 44% that of the leader, Salesforce. The company sits below the average top 10 market cap of 144B but remains above the sector median of 19B. It enjoys a 60% market cap premium over its closest rival above, highlighting a solid competitive buffer.
Comparisons with competitors
Check out how we compare the company to its competitors:
Does ServiceNow have a competitive advantage?
ServiceNow does not yet demonstrate a clear competitive advantage, as its ROIC remains below WACC, indicating value is being shed despite growing profitability. The company’s gross margin of 77.5% and net margin of 13.2% reflect operational efficiency but do not confirm a sustainable moat.
Looking ahead, ServiceNow’s expansion across North America, EMEA, and Asia Pacific shows steady revenue growth, supported by its Now platform and AI-driven workflow automation. New products and partnerships, such as with Celonis, offer opportunities to strengthen its market position in enterprise cloud solutions.
SWOT Analysis
This analysis highlights ServiceNow’s internal capabilities and external environment to guide strategic decisions.
Strengths
- Strong revenue growth with 125% increase over five years
- High gross margin at 77.5% indicating pricing power
- Low debt levels with favorable debt-to-assets ratio
Weaknesses
- Overvalued stock with P/E of 90.9 and P/B of 12.3
- Current ratio below 1 signals liquidity risk
- ROIC below WACC suggests value erosion
Opportunities
- Expanding global footprint, especially in Asia Pacific and EMEA
- Rising demand for AI and workflow automation
- Strategic partnerships like with Celonis enhance product offerings
Threats
- Intense competition in enterprise cloud software
- Economic downturn could slow IT spending
- High valuation increases vulnerability to market corrections
ServiceNow’s financial strength and rapid growth create a solid foundation. However, stretched valuation and liquidity caution require prudent risk management. The company should leverage its global expansion and innovation to offset competitive and macro risks.
Stock Price Action Analysis
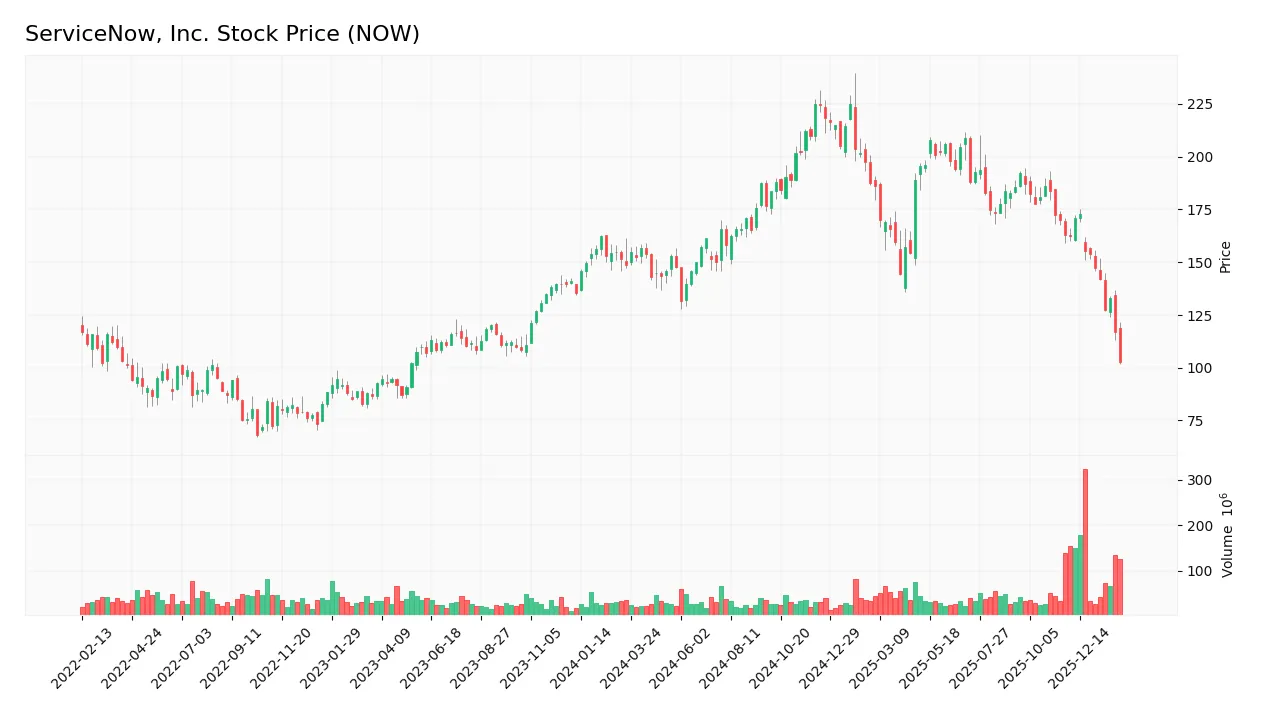
The weekly stock chart below displays ServiceNow, Inc.’s price movements over the past 100 weeks, highlighting key volatility and trend patterns:
Trend Analysis
Over the past 12 months, ServiceNow’s stock price declined by 31.02%, indicating a clear bearish trend. The trend decelerated despite a high volatility level with a 25.27 standard deviation. The price peaked at 225.0 and bottomed at 102.63, reflecting significant downside pressure.
Volume Analysis
Trading volumes increased overall, with sellers dominating at 56% over the full period. In the recent three months, seller volume surged to nearly 1.05B versus buyers’ 394M, confirming seller dominance. This suggests cautious investor sentiment and heightened selling pressure.
Target Prices
Analysts present a wide range of target prices for ServiceNow, reflecting varied market expectations.
| Target Low | Target High | Consensus |
|---|---|---|
| 115 | 1,315 | 429.09 |
The consensus target of 429.09 suggests moderate upside potential, but the broad spread indicates significant uncertainty among analysts.

Don’t Let Luck Decide Your Entry Point
Optimize your entry points with our advanced ProRealTime indicators. You’ll get efficient buy signals with precise price targets for maximum performance. Start outperforming now!
Analyst & Consumer Opinions
This section examines ServiceNow, Inc.’s grades and consumer feedback to provide a balanced performance overview.
Stock Grades
Here are the recent verified stock grades from leading financial institutions for ServiceNow, Inc.:
| Grading Company | Action | New Grade | Date |
|---|---|---|---|
| Needham | Maintain | Buy | 2026-02-05 |
| Citigroup | Maintain | Buy | 2026-01-30 |
| Evercore ISI Group | Maintain | Outperform | 2026-01-29 |
| DA Davidson | Maintain | Buy | 2026-01-29 |
| Cantor Fitzgerald | Maintain | Overweight | 2026-01-29 |
| BTIG | Maintain | Buy | 2026-01-29 |
| RBC Capital | Maintain | Outperform | 2026-01-29 |
| Needham | Maintain | Buy | 2026-01-29 |
| Stifel | Maintain | Buy | 2026-01-29 |
| Macquarie | Maintain | Neutral | 2026-01-29 |
The consensus among these reputable analysts remains firmly positive, with a strong bias toward Buy and Outperform ratings. Only one Neutral rating stands out, indicating broad confidence in the stock’s prospects.
Consumer Opinions
ServiceNow, Inc. enjoys a strong reputation among users for its robust workflow automation, though some customers express frustration with pricing and complexity.
| Positive Reviews | Negative Reviews |
|---|---|
| “Intuitive interface and powerful integrations.” | “Steep learning curve for new users.” |
| “Significantly improved our IT service efficiency.” | “Costs have increased sharply over the past year.” |
| “Reliable uptime and responsive customer support.” | “Customization can be overly complex and time-consuming.” |
Overall, consumers praise ServiceNow’s efficiency gains and reliability. However, recurring concerns include high costs and a challenging user experience for beginners.
Risk Analysis
Below is a summary table of key risks facing ServiceNow, Inc., detailing their probability and potential impact:
| Category | Description | Probability | Impact |
|---|---|---|---|
| Valuation Risk | High P/E (90.88) and P/B (12.25) ratios signal expensive shares. | High | High |
| Liquidity Risk | Current ratio below 1 (0.95) may limit short-term financial flexibility. | Medium | Medium |
| Market Volatility | Stock price recently dropped 7.6%, showing sensitivity to market swings. | High | Medium |
| Competitive Risk | Intense competition in cloud software could pressure margins. | Medium | High |
| Financial Health | Strong Altman Z-Score (6.62) indicates low bankruptcy risk. | Low | Low |
| Dividend Policy | No dividend yield may deter income-focused investors. | Medium | Low |
ServiceNow faces significant valuation risks due to its sky-high P/E and P/B ratios, making it vulnerable if growth slows. The current ratio under 1 is a red flag, suggesting tight liquidity. The recent 7.6% price drop warns of volatility. However, its robust Altman Z-Score keeps bankruptcy risk minimal. Investors must weigh these risks carefully against growth prospects.
Should You Buy ServiceNow, Inc.?
ServiceNow appears to be improving profitability with a slightly favorable moat, suggesting growing operational efficiency despite shedding value relative to WACC. Its leverage profile seems manageable, supported by a solid Altman Z-Score. Overall, the company could be seen as a moderate B-rated investment.
Strength & Efficiency Pillars
ServiceNow, Inc. exhibits solid profitability with a net margin of 13.16% and a return on equity (ROE) of 13.48%. Its return on invested capital (ROIC) stands at 8.98%, slightly above its weighted average cost of capital (WACC) at 8.21%, indicating the company creates value for shareholders. The Altman Z-score of 6.62 places it securely in the safe zone, signaling strong financial health. However, the Piotroski score of 4 suggests average financial strength, pointing to room for operational improvement.
Weaknesses and Drawbacks
The stock’s valuation poses clear risks, with a steep price-to-earnings (P/E) ratio of 90.88 and a price-to-book (P/B) ratio of 12.25, indicating an expensive premium. Its current ratio of 0.95 exposes liquidity concerns, hinting at potential short-term cash flow constraints. Market dynamics add pressure: recent trading is seller-dominant with only 27.3% buyer volume, coinciding with a sharp 36.92% price decline since late 2025. These factors could amplify downside volatility for investors.
Our Verdict about ServiceNow, Inc.
ServiceNow’s long-term fundamentals appear moderately favorable, supported by profitability and financial safety. However, the bearish technical trend coupled with seller dominance in recent months suggests caution. Despite the company’s value creation and operational growth, the current market pressure may warrant a wait-and-see approach for a more attractive entry point.
Disclaimer: This content is for informational purposes only and does not constitute financial, investment, or other professional advice. Investing in financial markets involves a significant risk of loss, and past performance is not indicative of future results.
Additional Resources
- ServiceNow, Inc. (NOW): A Bull Case Theory – Yahoo Finance (Feb 03, 2026)
- ServiceNow, Inc.’s (NYSE:NOW) Stock Retreats 26% But Earnings Haven’t Escaped The Attention Of Investors – simplywall.st (Feb 04, 2026)
- ServiceNow: AI Demand Soars While Investors Fear The Wrong Risk (NYSE:NOW) – Seeking Alpha (Feb 05, 2026)
- How Is The Market Feeling About ServiceNow Inc? – Benzinga (Feb 04, 2026)
- Why ServiceNow (NOW) Shares Are Sliding Today – Yahoo Finance (Feb 03, 2026)
For more information about ServiceNow, Inc., please visit the official website: servicenow.com