Home > Comparison > Technology > NOW vs TTD
The strategic rivalry between ServiceNow, Inc. and The Trade Desk, Inc. shapes the evolution of the software application sector. ServiceNow operates as a capital-intensive enterprise cloud solutions provider, while The Trade Desk excels as a nimble, high-margin digital advertising platform. This analysis pits ServiceNow’s scale and automation capabilities against The Trade Desk’s data-driven agility. I will determine which company offers a superior risk-adjusted return for a diversified portfolio in today’s volatile tech landscape.
Table of contents
Companies Overview
ServiceNow and The Trade Desk dominate distinct niches within the software application industry, shaping enterprise and advertising technology landscapes.
ServiceNow, Inc.: Enterprise Workflow Automation Leader
ServiceNow stands as a market leader in enterprise cloud computing solutions. It generates revenue by providing the Now platform, automating workflows through AI, machine learning, and robotic process automation. In 2026, its strategic focus centers on expanding automation capabilities and integrating governance, risk, and compliance tools to serve sectors like healthcare and financial services.
The Trade Desk, Inc.: Digital Advertising Platform Innovator
The Trade Desk operates a self-service cloud platform that empowers advertisers to create and optimize data-driven campaigns across multiple formats and devices. Its revenue derives from enabling agencies to manage display, video, audio, and connected TV ads. In 2026, it concentrates on enhancing its data services and broadening international reach amid evolving digital ad trends.
Strategic Collision: Similarities & Divergences
Both companies leverage cloud-based software but diverge in focus: ServiceNow builds a closed ecosystem of enterprise automation, while The Trade Desk offers an open infrastructure for digital advertising. Their battleground lies in capturing market share within software-driven efficiency and marketing effectiveness. These distinct models create diverse investment profiles—ServiceNow offers scale and stability, while The Trade Desk presents growth potential in a dynamic ad tech space.
Income Statement Comparison
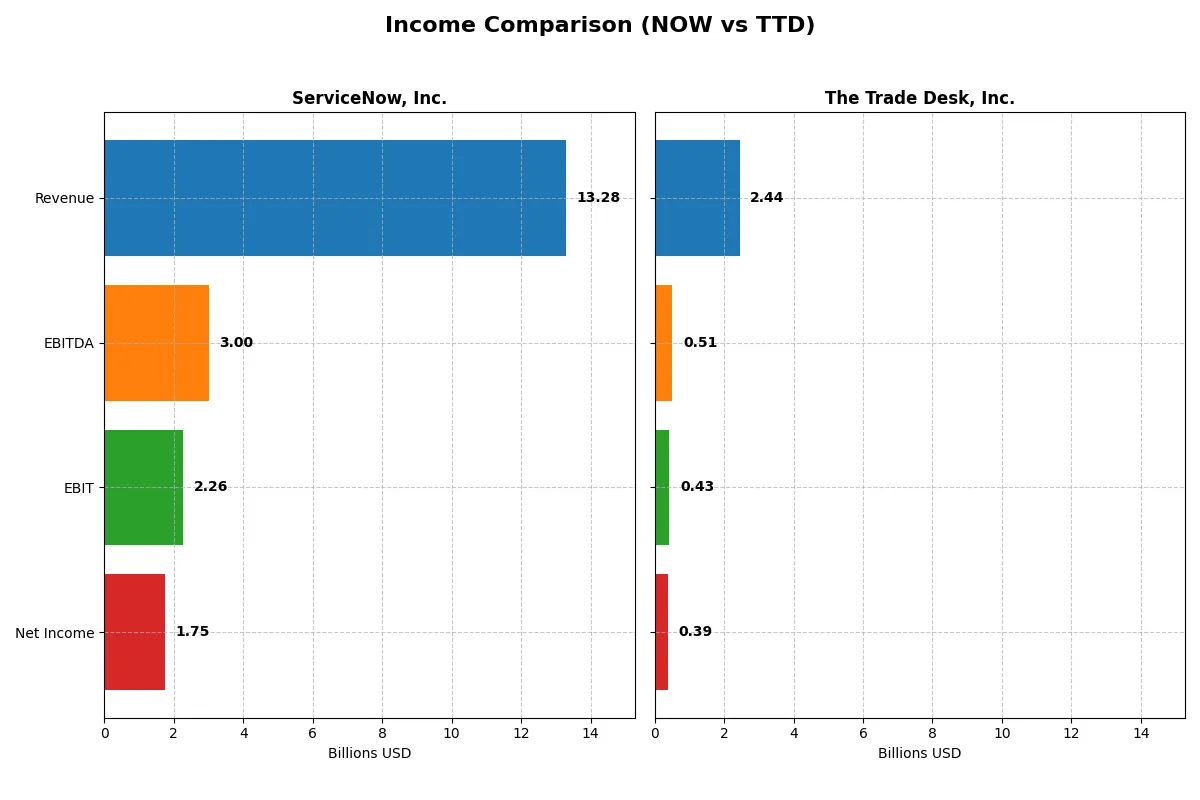
This data dissects the core profitability and scalability of both corporate engines to reveal who dominates the bottom line:
| Metric | ServiceNow, Inc. (NOW) | The Trade Desk, Inc. (TTD) |
|---|---|---|
| Revenue | 13.3B | 2.44B |
| Cost of Revenue | 3.0B | 472M |
| Operating Expenses | 8.47B | 1.55B |
| Gross Profit | 10.3B | 1.97B |
| EBITDA | 3.0B | 515M |
| EBIT | 2.26B | 427M |
| Interest Expense | 0 | 0 |
| Net Income | 1.75B | 393M |
| EPS | 1.69 | 0.80 |
| Fiscal Year | 2025 | 2024 |
Income Statement Analysis: The Bottom-Line Duel
This income statement comparison reveals which company drives greater operational efficiency and sustainable profitability in their recent fiscal years.
ServiceNow, Inc. Analysis
ServiceNow’s revenue surged from $5.9B in 2021 to $13.3B in 2025, with net income growing sixfold to $1.75B. Its gross margin holds strong at 77.5%, reflecting efficient cost control. The 2025 EBIT margin of 17% and net margin of 13.2% demonstrate robust profitability and operational momentum, supported by favorable expense management.
The Trade Desk, Inc. Analysis
The Trade Desk expanded revenue from $837M in 2020 to $2.44B in 2024, with net income climbing to $393M. Its gross margin is even higher at 80.7%, while the EBIT margin stands at 17.5%, slightly outperforming ServiceNow. The net margin improved sharply by 75% year-over-year, underscoring accelerating efficiency and strong earnings momentum.
Margin Power vs. Revenue Scale
ServiceNow dominates in absolute revenue and net income scale, reflecting broader market reach and consistent margin expansion. The Trade Desk edges ahead on margin percentages and growth rates in profitability metrics. For investors, ServiceNow offers a larger, steadily growing profit engine, while The Trade Desk presents a leaner, rapidly improving margin profile.
Financial Ratios Comparison
These vital ratios act as a diagnostic tool to expose underlying fiscal health, valuation premiums, and capital efficiency for investors analyzing these companies:
| Ratios | ServiceNow, Inc. (NOW) | The Trade Desk, Inc. (TTD) |
|---|---|---|
| ROE | 13.5% | 13.3% |
| ROIC | 9.0% | 10.0% |
| P/E | 90.9 | 146.8 |
| P/B | 12.3 | 19.6 |
| Current Ratio | 0.95 | 1.86 |
| Quick Ratio | 0.95 | 1.86 |
| D/E | 0.25 | 0.11 |
| Debt-to-Assets | 12.3% | 5.1% |
| Interest Coverage | 0 | 0 |
| Asset Turnover | 0.51 | 0.40 |
| Fixed Asset Turnover | 4.29 | 5.17 |
| Payout Ratio | 0 | 0 |
| Dividend Yield | 0 | 0 |
| Fiscal Year | 2025 | 2024 |
Efficiency & Valuation Duel: The Vital Signs
Financial ratios serve as the company’s DNA, exposing hidden risks and operational strengths essential for investor decisions.
ServiceNow, Inc.
ServiceNow posts a solid 13.5% ROE and a favorable 13.2% net margin, signaling decent profitability. Yet, its valuation appears stretched with a P/E near 91 and a P/B of 12.3, deterring value-focused investors. The firm does not pay dividends, opting to reinvest heavily in R&D, fueling growth over yield.
The Trade Desk, Inc.
The Trade Desk shows a comparable 13.3% ROE but outperforms in net margin at 16.1%, reflecting operational efficiency. However, its P/E ratio at 147 and P/B near 19.6 indicate a premium pricing. It also lacks dividends, channeling cash into innovation and expansion, supported by a strong balance sheet and liquidity.
Premium Valuation vs. Operational Safety
The Trade Desk offers stronger profitability and more favorable liquidity metrics but trades at a higher premium than ServiceNow. ServiceNow’s valuation is less demanding but with a weaker current ratio. Risk-tolerant investors may prefer The Trade Desk’s growth profile, while those seeking slightly better valuation might lean toward ServiceNow.
Which one offers the Superior Shareholder Reward?
ServiceNow (NOW) and The Trade Desk (TTD) both forgo dividends, reinvesting free cash flow into growth and acquisitions. NOW generates robust free cash flow of 4.4/share with a strong buyback presence, while TTD posts lower free cash flow at 1.3/share but maintains higher operating margins. NOW’s aggressive buyback scale and superior FCF coverage suggest a more sustainable capital return. I conclude NOW offers the more attractive total shareholder reward in 2026.
Comparative Score Analysis: The Strategic Profile
The radar chart reveals the fundamental DNA and trade-offs of ServiceNow, Inc. and The Trade Desk, Inc., highlighting their financial strengths and valuation challenges:
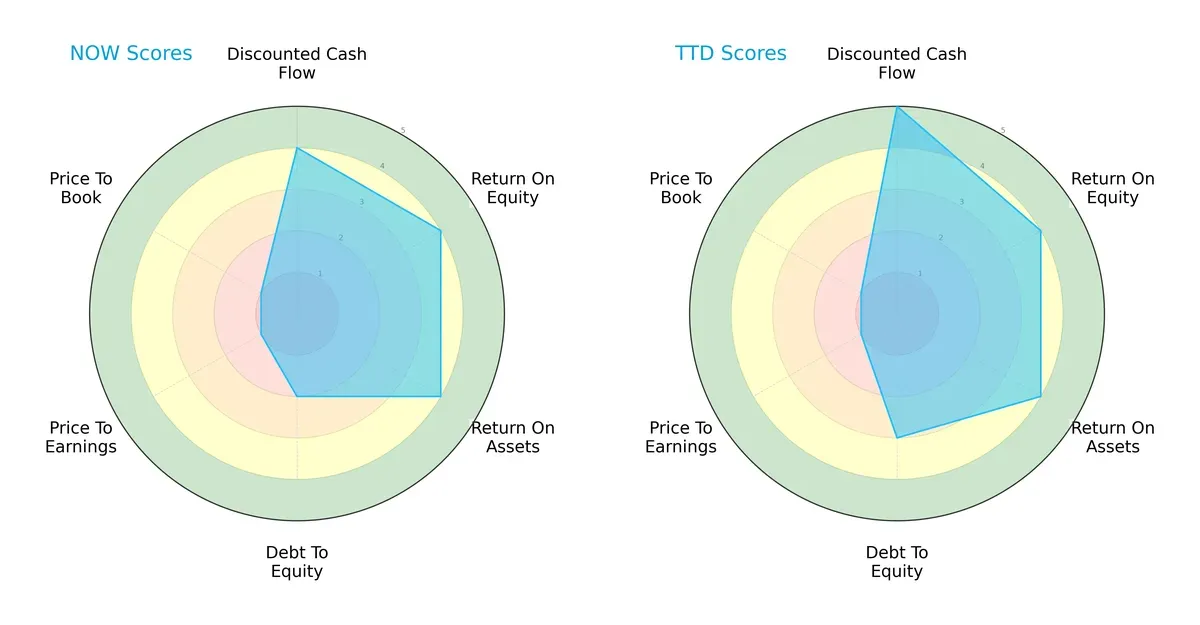
ServiceNow and The Trade Desk share strong returns on equity and assets, scoring 4 each, showing operational efficiency in their sectors. The Trade Desk edges ServiceNow on discounted cash flow, scoring 5 versus 4, signaling better future cash flow prospects. ServiceNow leans on a stronger debt position with a lower debt-to-equity score of 2, compared to 3 for The Trade Desk, indicating more conservative leverage. Both firms face valuation headwinds with very unfavorable P/E and P/B scores of 1. Overall, The Trade Desk presents a more balanced growth and cash flow profile, while ServiceNow relies more heavily on prudent debt management.
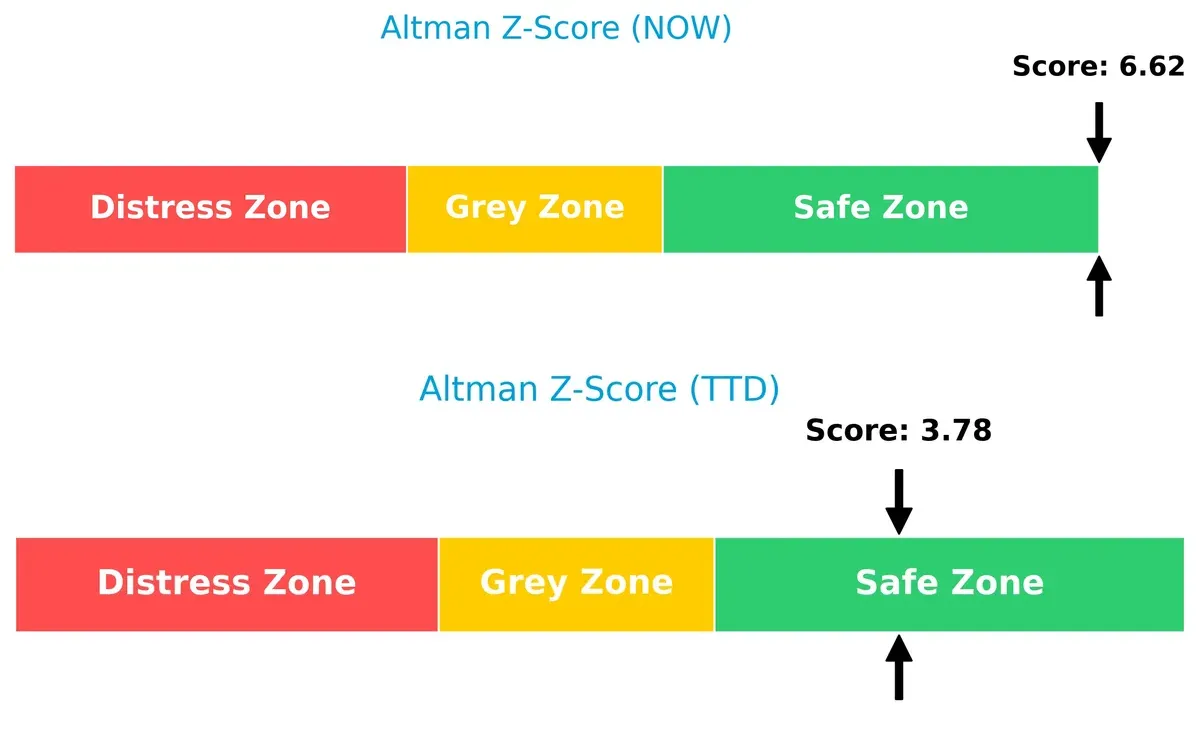
Bankruptcy Risk: Solvency Showdown
ServiceNow’s Altman Z-Score of 6.62 outpaces The Trade Desk’s 3.78, placing both firmly in the safe zone but spotlighting ServiceNow’s superior long-term solvency in this cycle:
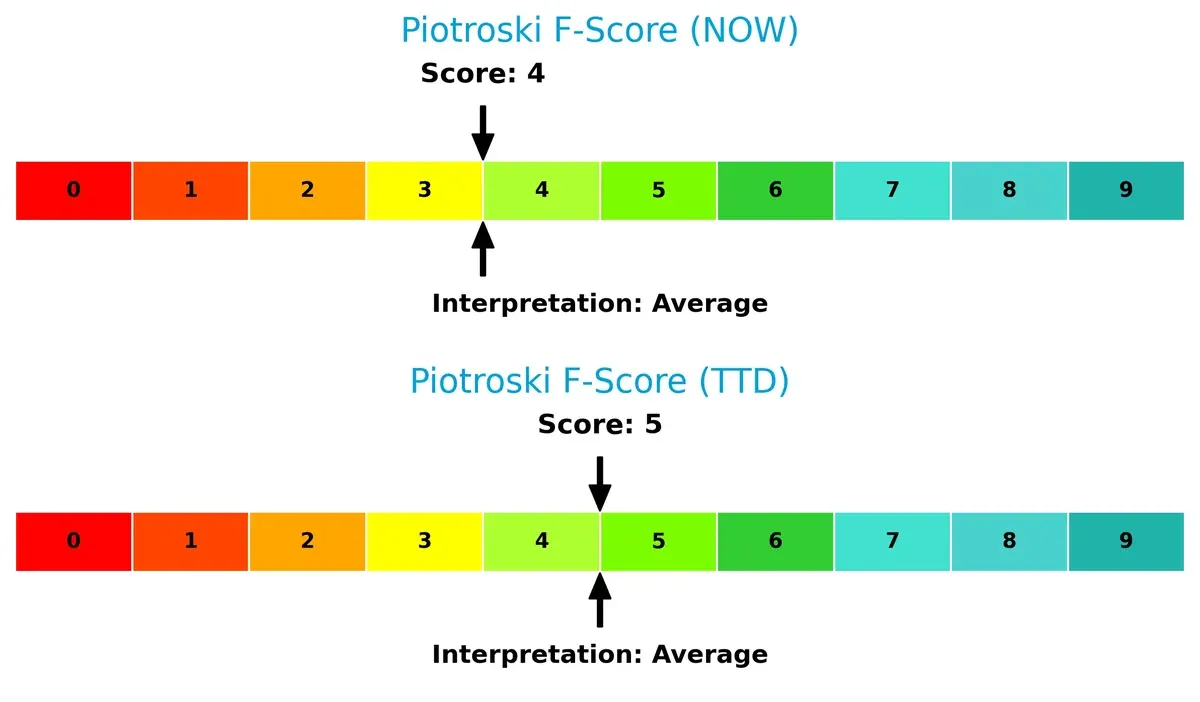
Financial Health: Quality of Operations
The Trade Desk’s Piotroski score of 5 slightly surpasses ServiceNow’s 4, suggesting marginally stronger internal financial health and operational quality, though both firms remain in the average range:
How are the two companies positioned?
This section dissects the operational DNA of ServiceNow and The Trade Desk by comparing their revenue distribution and internal strengths and weaknesses. The goal is to confront their economic moats and identify which business model offers the most resilient, sustainable competitive advantage today.
Revenue Segmentation: The Strategic Mix
This comparison dissects how ServiceNow, Inc. and The Trade Desk, Inc. diversify their income streams and highlights their primary sector bets:
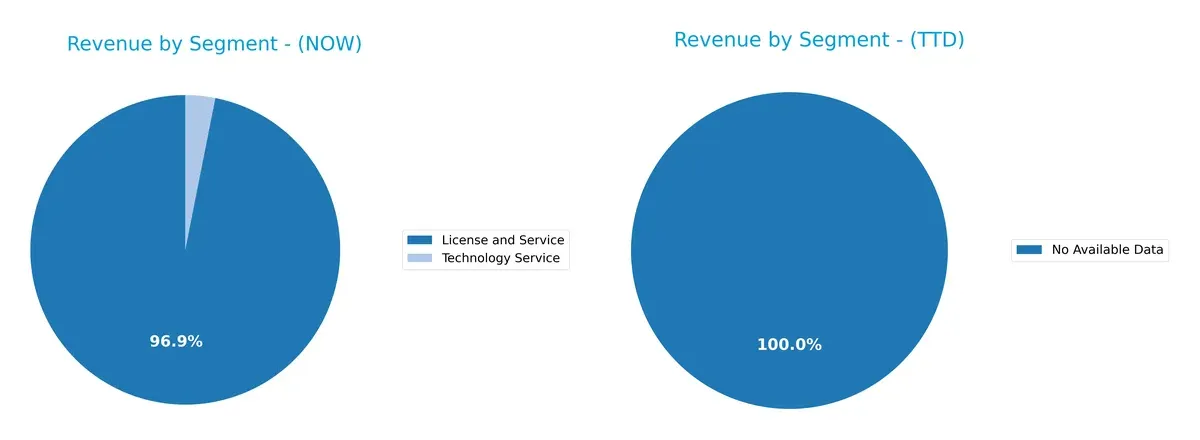
ServiceNow anchors nearly all revenue in “License and Service,” with $12.9B in 2025, dominated by Digital Workflow and ITOM products. The Trade Desk lacks disclosed segment data, indicating opacity or reliance on a single business model. ServiceNow’s focus reveals deep ecosystem lock-in but concentration risk. Without diversified streams, The Trade Desk may face higher volatility versus ServiceNow’s infrastructure dominance.
Strengths and Weaknesses Comparison
This table compares the strengths and weaknesses of ServiceNow, Inc. and The Trade Desk, Inc.:
ServiceNow Strengths
- Strong diversification with License, Service, and Technology segments
- Solid global presence across North America, EMEA, Asia Pacific
- Favorable net margin at 13.16%
- Low debt-to-assets ratio at 12.3% with infinite interest coverage
- High fixed asset turnover at 4.29
The Trade Desk Strengths
- Higher net margin at 16.08% indicating stronger profitability
- Favorable ROIC at 10.02% above WACC
- Strong liquidity with current ratio at 1.86
- Very low debt-to-assets ratio at 5.11% and infinite interest coverage
- High fixed asset turnover at 5.17
ServiceNow Weaknesses
- Unfavorable valuation metrics: PE at 90.88, PB at 12.25
- Current ratio below 1 at 0.95 signals liquidity risk
- No dividend yield
- Neutral ROE and ROIC close to WACC limit
- Asset turnover moderate at 0.51
The Trade Desk Weaknesses
- Very high valuation with PE at 146.77 and PB at 19.56
- Asset turnover low at 0.4 signals less efficient asset use
- No dividend yield
- Neutral ROE at 13.33%
ServiceNow’s strengths lie in diversified revenue and global reach but liquidity and valuation raise caution. The Trade Desk shows superior profitability and liquidity, though steep valuations and asset efficiency require scrutiny. Both companies must balance growth ambitions with prudent financial management.
The Moat Duel: Analyzing Competitive Defensibility
A structural moat is the sole shield preserving long-term profits from relentless competitive pressures. Let’s dissect how these firms defend their turf:
ServiceNow, Inc.: Workflow Automation Switching Costs
ServiceNow’s moat comes from high switching costs embedded in its Now platform, locking customers into complex workflows. This drives stable 17% EBIT margins and 21.9% EPS growth in 2025. Expansion into AI-powered automation in 2026 could deepen this advantage.
The Trade Desk, Inc.: Data-Driven Network Effects
The Trade Desk’s moat relies on network effects from its data-driven ad platform, which attracts advertisers and publishers. Despite a declining ROIC trend, it maintains strong 17.5% EBIT margins and 25.6% revenue growth. Growth in connected TV ad markets offers upside in 2026.
Switching Costs vs. Network Effects: The Moat Face-Off
ServiceNow’s growing ROIC and entrenched switching costs create a deeper moat than The Trade Desk’s eroding profitability amid network effects. I see ServiceNow better positioned to defend and expand its market share in 2026.
Which stock offers better returns?
Over the past year, both ServiceNow and The Trade Desk exhibited significant declines, with decelerating bearish trends and dominant seller volumes shaping their trading dynamics.
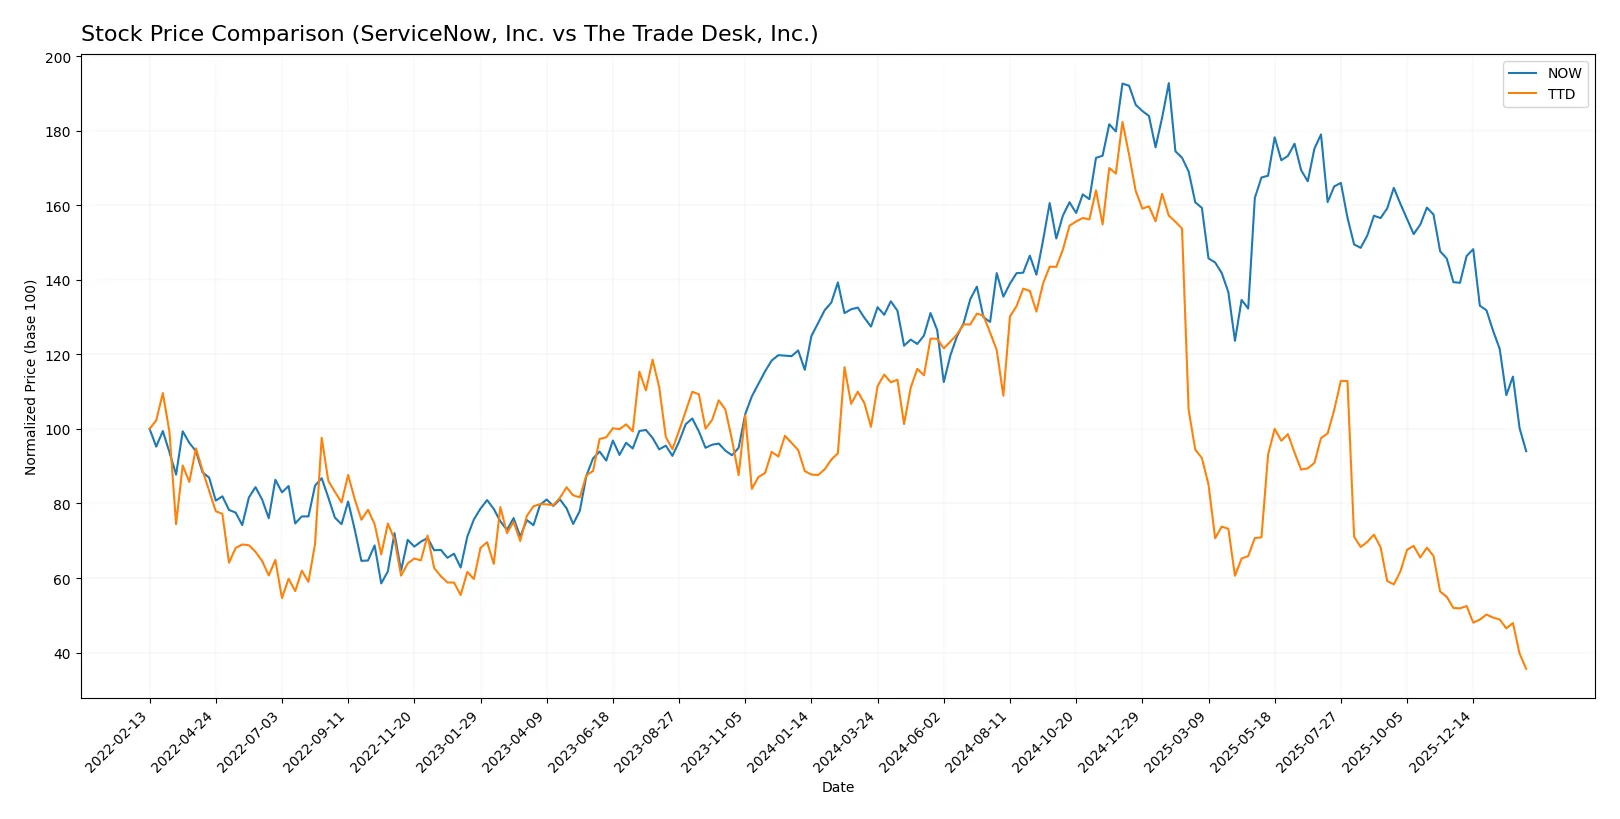
Trend Comparison
ServiceNow’s stock fell 26.22% over the past year, marking a bearish trend with deceleration. It ranged from a high of 225.0 to a low of 109.77, showing elevated volatility (std dev 25.07).
The Trade Desk experienced a steeper 64.57% decline over the same period, also bearish with deceleration. Its price ranged between 139.11 and 27.18, showing higher volatility (std dev 29.59).
Comparing trends, ServiceNow outperformed The Trade Desk, delivering a smaller loss and less volatility during the last 12 months.
Target Prices
Analysts present a wide range of target prices, reflecting divergent views on growth potential and risk for these tech companies.
| Company | Target Low | Target High | Consensus |
|---|---|---|---|
| ServiceNow, Inc. | 115 | 1315 | 440.64 |
| The Trade Desk, Inc. | 39 | 98 | 53.18 |
The consensus targets for ServiceNow and The Trade Desk sit significantly above their current prices of 109.77 and 27.18 respectively, indicating strong analyst optimism despite recent market volatility.

Don’t Let Luck Decide Your Entry Point
Optimize your entry points with our advanced ProRealTime indicators. You’ll get efficient buy signals with precise price targets for maximum performance. Start outperforming now!
How do institutions grade them?
The following tables summarize recent institutional grades for ServiceNow, Inc. and The Trade Desk, Inc.:
ServiceNow, Inc. Grades
This table shows recent grades from leading financial institutions for ServiceNow, Inc.
| Grading Company | Action | New Grade | Date |
|---|---|---|---|
| Citigroup | Maintain | Buy | 2026-01-30 |
| Evercore ISI Group | Maintain | Outperform | 2026-01-29 |
| Macquarie | Maintain | Neutral | 2026-01-29 |
| BTIG | Maintain | Buy | 2026-01-29 |
| RBC Capital | Maintain | Outperform | 2026-01-29 |
| Keybanc | Maintain | Underweight | 2026-01-29 |
| Stifel | Maintain | Buy | 2026-01-29 |
| DA Davidson | Maintain | Buy | 2026-01-29 |
| Cantor Fitzgerald | Maintain | Overweight | 2026-01-29 |
| Needham | Maintain | Buy | 2026-01-29 |
The Trade Desk, Inc. Grades
This table shows recent grades from leading financial institutions for The Trade Desk, Inc.
| Grading Company | Action | New Grade | Date |
|---|---|---|---|
| Keybanc | Maintain | Overweight | 2026-02-03 |
| Rosenblatt | Maintain | Buy | 2026-01-27 |
| CFRA | Downgrade | Hold | 2026-01-27 |
| Truist Securities | Maintain | Buy | 2026-01-27 |
| Citigroup | Maintain | Neutral | 2026-01-27 |
| Stifel | Maintain | Buy | 2026-01-23 |
| Citizens | Downgrade | Market Perform | 2026-01-23 |
| UBS | Maintain | Buy | 2026-01-20 |
| B of A Securities | Maintain | Underperform | 2026-01-20 |
| Morgan Stanley | Maintain | Equal Weight | 2026-01-13 |
Which company has the best grades?
ServiceNow holds a stronger and more consistent set of buy and outperform ratings. The Trade Desk shows mixed grades including downgrades and underperform marks. These differences may affect investor sentiment and portfolio positioning.
Risks specific to each company
The following categories identify the critical pressure points and systemic threats facing both firms in the 2026 market environment:
1. Market & Competition
ServiceNow, Inc.
- Faces intense competition in enterprise cloud workflow automation with established tech giants.
The Trade Desk, Inc.
- Operates in a highly fragmented digital advertising space with fast-evolving platform rivals.
2. Capital Structure & Debt
ServiceNow, Inc.
- Maintains a conservative debt-to-equity ratio of 0.25, signaling moderate leverage.
The Trade Desk, Inc.
- Shows a lower debt-to-equity ratio of 0.11, indicating a stronger balance sheet.
3. Stock Volatility
ServiceNow, Inc.
- Beta near 0.98 suggests market volatility close to the average S&P 500.
The Trade Desk, Inc.
- Slightly higher beta of 1.09 implies greater sensitivity to market swings.
4. Regulatory & Legal
ServiceNow, Inc.
- Subject to data privacy and compliance risks in multiple regulated industries.
The Trade Desk, Inc.
- Faces regulatory scrutiny over digital advertising practices and data usage.
5. Supply Chain & Operations
ServiceNow, Inc.
- Relies on cloud infrastructure and strategic partnerships, exposing it to third-party risks.
The Trade Desk, Inc.
- Dependent on platform integrations and data partnerships, vulnerable to tech disruptions.
6. ESG & Climate Transition
ServiceNow, Inc.
- Increasing focus on governance and social responsibility embedded in enterprise solutions.
The Trade Desk, Inc.
- ESG efforts growing but less mature given smaller scale and industry nature.
7. Geopolitical Exposure
ServiceNow, Inc.
- Global footprint exposes it to cross-border trade tensions and data localization laws.
The Trade Desk, Inc.
- International operations face risks from evolving digital regulations and geopolitical tensions.
Which company shows a better risk-adjusted profile?
ServiceNow’s main risk lies in fierce competition and a stretched valuation, reflected in its unfavorable P/E and current ratio below 1. The Trade Desk’s greatest vulnerability is higher stock volatility and regulatory scrutiny. However, TTD’s stronger liquidity and capital structure improve its risk profile. Recent ratio data shows TTD’s current ratio at 1.86, a clear buffer against short-term shocks, while NOW’s 0.95 flags liquidity risk. Overall, The Trade Desk offers a better risk-adjusted profile amid 2026 uncertainties.
Final Verdict: Which stock to choose?
ServiceNow, Inc. (NOW) excels as a cash-generating powerhouse with steadily growing profitability and strong operational efficiency. Its main point of vigilance is a below-par current ratio that signals potential short-term liquidity risk. This stock suits investors targeting aggressive growth with a tolerance for balance sheet caution.
The Trade Desk, Inc. (TTD) benefits from a strategic moat rooted in recurring revenue and solid balance sheet strength, showing favorable financial stability compared to NOW. Its higher current ratio and lower leverage contribute to a safer profile, aligning well with investors focused on growth at a reasonable price (GARP).
If you prioritize aggressive growth and can manage liquidity risks, ServiceNow outshines with expanding profitability and operational momentum. However, if you seek better stability and a resilient moat with recurring revenues, The Trade Desk offers a more balanced risk-return scenario despite a less favorable ROIC trend. Both cases warrant careful monitoring of valuation premiums.
Disclaimer: Investment carries a risk of loss of initial capital. The past performance is not a reliable indicator of future results. Be sure to understand risks before making an investment decision.
Go Further
I encourage you to read the complete analyses of ServiceNow, Inc. and The Trade Desk, Inc. to enhance your investment decisions: