Home > Comparison > Technology > NOW vs ROP
The strategic rivalry between ServiceNow, Inc. and Roper Technologies, Inc. shapes leadership dynamics across the Technology and Industrials sectors. ServiceNow excels as a high-growth, cloud-based software innovator in enterprise IT solutions. Roper stands as a diversified industrial powerhouse integrating software and engineered products. This analysis probes their contrasting models and growth trajectories to identify which offers superior risk-adjusted returns for a well-diversified portfolio.
Table of contents
Companies Overview
ServiceNow and Roper Technologies stand as pivotal players in distinct yet crucial sectors of the U.S. economy.
ServiceNow, Inc.: Enterprise Cloud Automation Leader
ServiceNow dominates the enterprise cloud computing space, powering workflow automation through its Now platform. It generates revenue by offering AI-driven IT service management and business operations software. In 2026, it focuses strategically on expanding automation capabilities and integrating advanced analytics to drive digital transformation across industries.
Roper Technologies, Inc.: Diversified Industrial Software and Solutions
Roper Technologies excels in industrial and software solutions, combining engineered products with cloud-based software across multiple sectors. Its revenue stems from specialized instruments, software for financial and healthcare industries, and smart technology products. The company’s 2026 strategy emphasizes innovation in data analytics, automation, and expanding its footprint in niche markets like life insurance and utilities.
Strategic Collision: Similarities & Divergences
While both prioritize software-driven innovation, ServiceNow pursues a closed ecosystem focused on enterprise workflow automation, contrasting with Roper’s diversified, multi-industry hardware-software hybrid model. The primary battleground is in cloud-based operational efficiency and analytics. Investors face distinct profiles: ServiceNow offers growth in scalable SaaS, whereas Roper presents a stable blend of industrial assets and recurring software revenues.
Income Statement Comparison
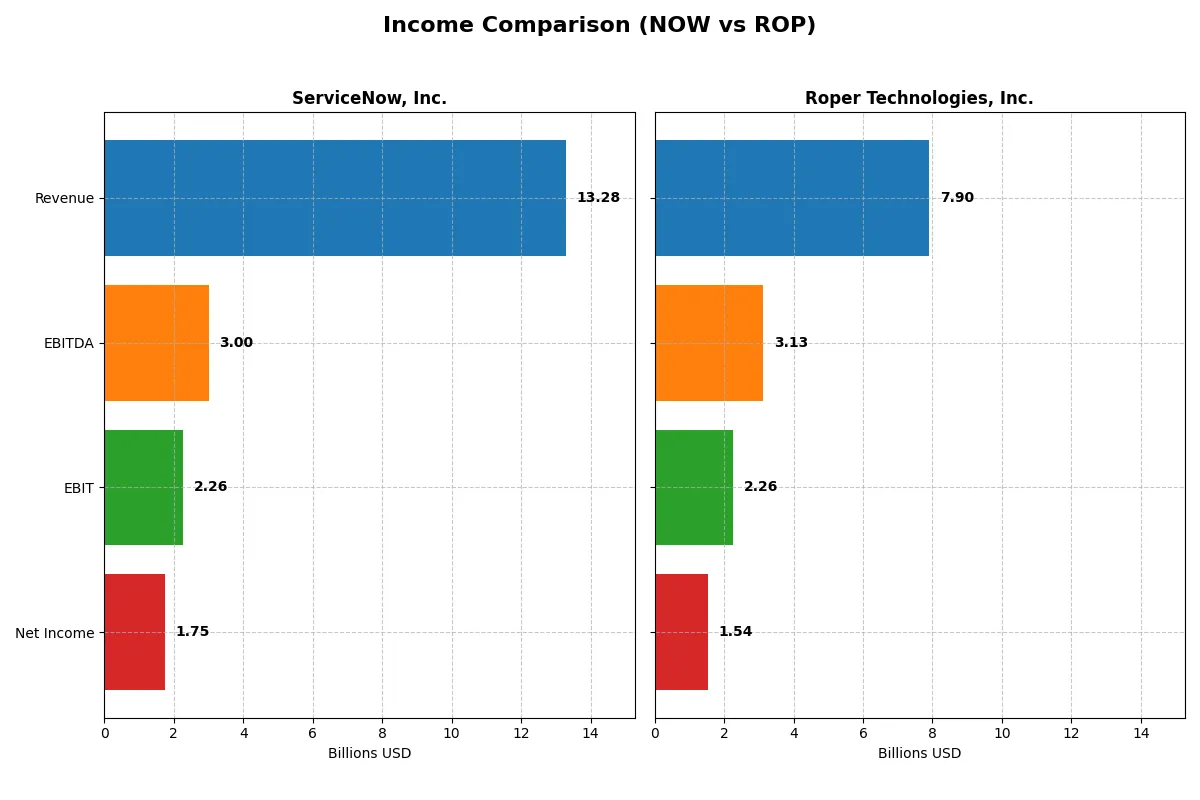
This data dissects the core profitability and scalability of both corporate engines to reveal who dominates the bottom line:
| Metric | ServiceNow, Inc. (NOW) | Roper Technologies, Inc. (ROP) |
|---|---|---|
| Revenue | 13.3B | 7.9B |
| Cost of Revenue | 3.0B | 2.4B |
| Operating Expenses | 8.5B | 3.2B |
| Gross Profit | 10.3B | 5.5B |
| EBITDA | 3.0B | 3.1B |
| EBIT | 2.3B | 2.3B |
| Interest Expense | 0 | 325M |
| Net Income | 1.7B | 1.5B |
| EPS | 1.69 | 14.31 |
| Fiscal Year | 2025 | 2025 |
Income Statement Analysis: The Bottom-Line Duel
This income statement comparison reveals how effectively each company converts revenue into profit, exposing operational efficiency and growth momentum.
ServiceNow, Inc. Analysis
ServiceNow’s revenue surged 21% from 2024 to 2025, reaching $13.3B, while net income climbed 23% to $1.75B. Its gross margin remains robust at 77.5%, and net margin improved slightly to 13.2%. The firm’s expanding top line and consistent margin expansion signal strong operational leverage and accelerating profitability.
Roper Technologies, Inc. Analysis
Roper’s revenue grew 12% to $7.9B in 2025, with net income declining 1.9% to $1.54B. Its gross margin stands at 69.2%, while net margin dropped to 19.4%. Despite a solid revenue base, Roper struggles with margin compression and flat EBIT growth, reflecting challenges in controlling operating expenses amid revenue expansion.
Margin Expansion vs. Revenue Acceleration
ServiceNow outpaces Roper with superior revenue growth and margin expansion, delivering a 28% EBIT increase versus Roper’s 1.6%. ServiceNow’s profile suits investors favoring growth and margin improvement. Roper appeals more to income-focused investors valuing higher net margins but faces pressure on profitability momentum.
Financial Ratios Comparison
These vital ratios act as a diagnostic tool to expose the underlying fiscal health, valuation premiums, and capital efficiency of each company:
| Ratios | ServiceNow, Inc. (NOW) | Roper Technologies, Inc. (ROP) |
|---|---|---|
| ROE | 13.48% | 0% |
| ROIC | 8.98% | 0% |
| P/E | 90.88 | 31.06 |
| P/B | 12.25 | 0 |
| Current Ratio | 0.95 | 0 |
| Quick Ratio | 0.95 | 0 |
| D/E (Debt-to-Equity) | 0.25 | 0 |
| Debt-to-Assets | 12.30% | 0% |
| Interest Coverage | 0 | 6.88 |
| Asset Turnover | 0.51 | 0 |
| Fixed Asset Turnover | 4.29 | 0 |
| Payout Ratio | 0 | 23.11% |
| Dividend Yield | 0 | 0.74% |
| Fiscal Year | 2025 | 2025 |
Efficiency & Valuation Duel: The Vital Signs
Financial ratios act as a company’s DNA, exposing hidden risks and revealing operational excellence beneath surface numbers.
ServiceNow, Inc.
ServiceNow posts a solid net margin of 13.16%, signaling strong profitability, yet a stretched P/E of 90.88 marks the stock as expensive. Its return on equity (13.48%) and return on invested capital (8.98%) remain neutral, slightly above its 8.31% WACC. The firm favors reinvestment over dividends, directing cash flow mainly toward R&D and growth initiatives.
Roper Technologies, Inc.
Roper shows a favorable net margin of 19.44%, indicating efficient profit generation, but with an unfavorable P/E of 31.06, the valuation is moderate, not cheap. Key returns like ROE and ROIC are unavailable or zero, clouding operational efficiency. The company offers a modest dividend yield of 0.74%, returning some capital to shareholders despite mixed financial signals.
Premium Valuation vs. Mixed Fundamentals
ServiceNow’s premium valuation reflects confidence in growth and reinvestment but comes with stretched multiples and liquidity concerns. Roper’s better margin contrasts with opaque returns and some unfavorable liquidity ratios. Investors seeking growth may lean toward ServiceNow, while those valuing margin efficiency might prefer Roper’s profile despite its risks.
Which one offers the Superior Shareholder Reward?
I observe that ServiceNow, Inc. (NOW) pays no dividends but reinvests heavily in growth, reflected in a 0% payout ratio and zero dividend yield. Its free cash flow per share stands at $4.41B, with no buyback data implying limited direct shareholder distributions. Conversely, Roper Technologies, Inc. (ROP) offers a 0.74% dividend yield with a sustainable 23% payout ratio, supported by strong free cash flow per share of $23.25B and active buybacks. Historically, ROP’s combination of dividends and aggressive buybacks delivers a more balanced and sustainable total shareholder return. I conclude that Roper Technologies offers the superior shareholder reward in 2026 due to its prudent capital allocation and consistent distributions.
Comparative Score Analysis: The Strategic Profile
The radar chart reveals the fundamental DNA and trade-offs of ServiceNow, Inc. and Roper Technologies, Inc., highlighting their financial strengths and weaknesses side by side:
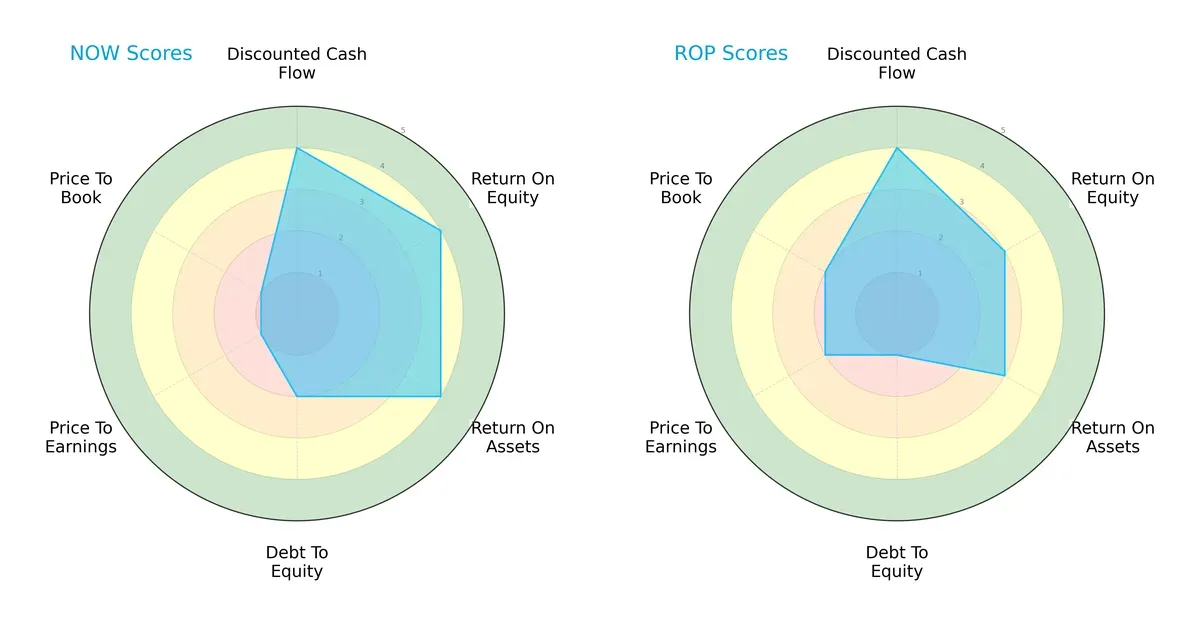
ServiceNow excels in profitability metrics with strong ROE and ROA scores of 4 each, compared to Roper’s moderate 3s. Both share a favorable DCF score of 4, indicating sound cash flow projections. However, ServiceNow carries more balance sheet risk, scoring 2 in debt-to-equity versus Roper’s weaker 1. Valuation metrics (P/E and P/B) heavily favor Roper, which scores moderate 2s, while ServiceNow’s very unfavorable 1s suggest it trades at a premium. Overall, ServiceNow shows a balanced operational profile but at a higher valuation, while Roper relies on valuation appeal with moderate profitability and weaker leverage control.
—
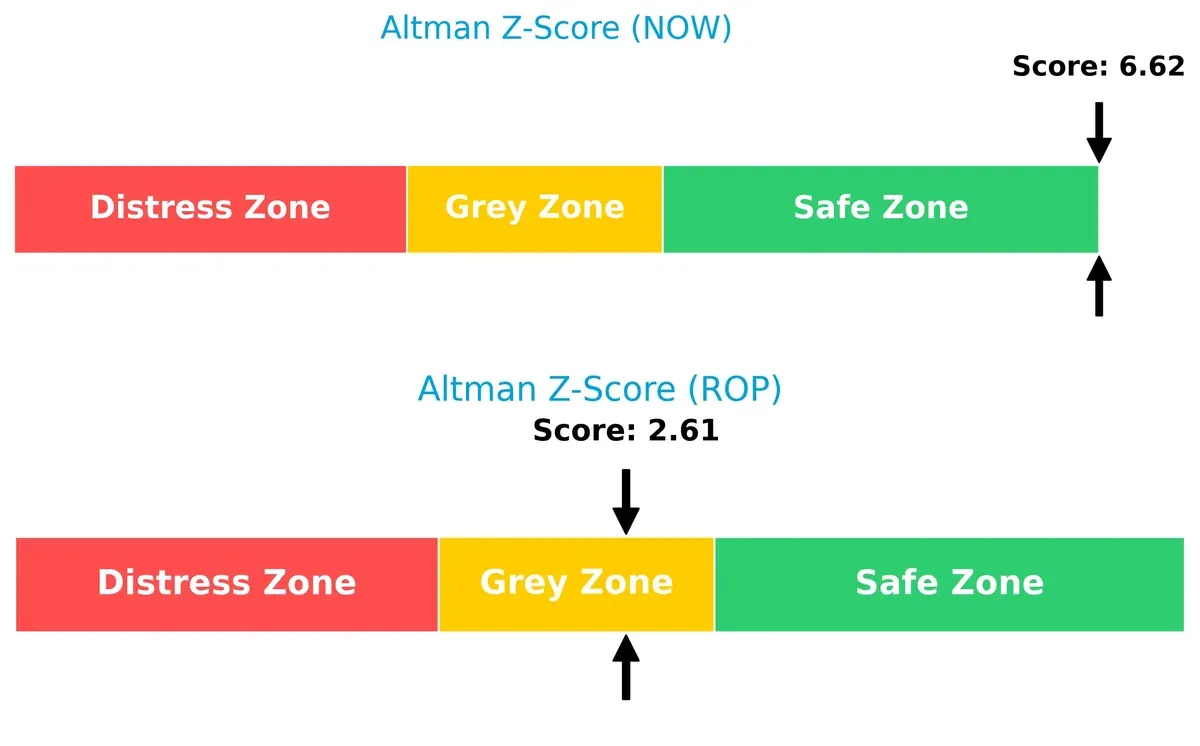
Bankruptcy Risk: Solvency Showdown
ServiceNow’s Altman Z-Score of 6.62 places it securely in the safe zone, signaling strong long-term survival prospects. Roper’s 2.61 lands in the grey zone, indicating moderate bankruptcy risk in volatile cycles:
—
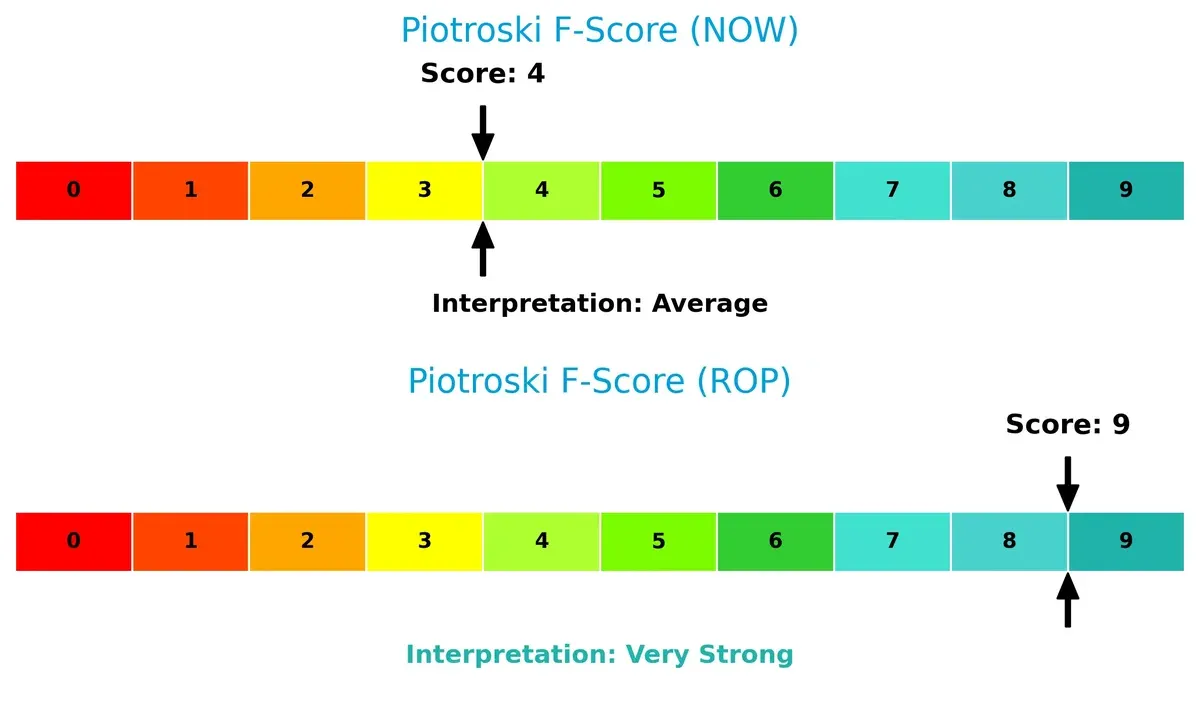
Financial Health: Quality of Operations
Roper’s Piotroski F-Score of 9 signals peak financial health with robust profitability and operational efficiency. ServiceNow’s average score of 4 raises caution, highlighting potential internal weaknesses relative to its peer:
How are the two companies positioned?
This section dissects the operational DNA of ServiceNow and Roper by comparing their revenue distribution and internal strengths and weaknesses. The final objective confronts their economic moats to identify which model delivers the most resilient and sustainable competitive advantage today.
Revenue Segmentation: The Strategic Mix
This visual comparison dissects how ServiceNow and Roper Technologies diversify their income streams and where their primary sector bets lie:
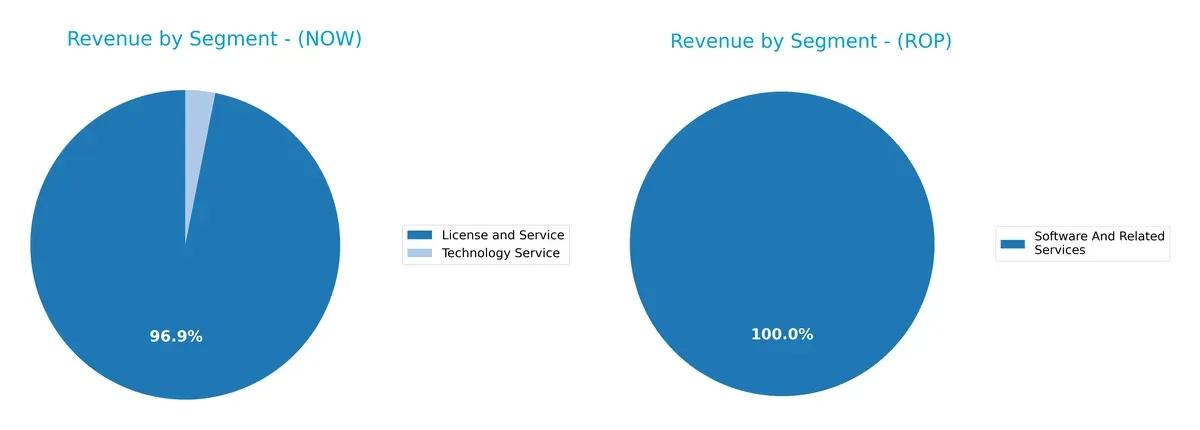
ServiceNow’s 2025 revenue dwarfs Roper’s in scale, anchored by $12.9B from License and Service with a minor $414M in Technology Service. In contrast, Roper splits $10.7B mostly into Software and Related Services but with a more balanced 2023 mix across Application Software ($3.2B), Network Software ($1.4B), and Technology Enabled Products ($1.6B). ServiceNow pivots on a dominant SaaS model, risking concentration, while Roper’s diversified segments reduce exposure and highlight infrastructure strength.
Strengths and Weaknesses Comparison
This table compares the Strengths and Weaknesses of ServiceNow, Inc. (NOW) and Roper Technologies, Inc. (ROP):
NOW Strengths
- Diverse revenue from License, Service, and Technology segments
- Strong global presence with significant North America and EMEA sales
- Favorable debt metrics and interest coverage
- Solid fixed asset turnover ratio indicating operational efficiency
ROP Strengths
- Diversified product segments including software and technology-enabled products
- Favorable debt-to-assets and interest coverage ratios
- Strong net margin reflecting profitable operations
- Favorable price-to-book ratio suggesting undervaluation
NOW Weaknesses
- Unfavorable valuation metrics with high PE and PB ratios
- Current ratio below 1 indicating liquidity risks
- Zero dividend yield may deter income investors
- Neutral ROIC close to WACC limits excess returns
ROP Weaknesses
- Unavailable WACC and zero ROE and ROIC raise profitability concerns
- Unfavorable liquidity ratios with zero current and quick ratios
- Unfavorable asset turnover metrics suggest asset underutilization
- Unfavorable dividend yield despite positive net margin
The comparison highlights NOW’s operational efficiency and global reach versus ROP’s profitability and capital structure. Both face valuation and liquidity challenges impacting their financial flexibility and investor appeal.
The Moat Duel: Analyzing Competitive Defensibility
A structural moat is the only reliable shield protecting long-term profits from relentless competitive erosion. Let’s dissect how each company’s moat holds up:
ServiceNow, Inc.: Workflow Automation Switching Costs
ServiceNow’s moat stems from high switching costs embedded in enterprise workflow automation. Its steady 17% EBIT margin and 20% revenue growth confirm margin resilience. Expansion in AI-driven services in 2026 could deepen this advantage.
Roper Technologies, Inc.: Diversified Industrial Intangible Assets
Roper’s moat relies on a broad portfolio of specialized industrial software and engineered products, creating intangible asset strength. Despite a higher 29% EBIT margin, its declining ROIC trend signals pressure. New tech integrations in 2026 may offer some growth relief.
Verdict: Switching Costs vs. Intangible Asset Breadth
ServiceNow’s growing ROIC and expanding switching-cost moat outpace Roper’s intangible asset diversity burdened by declining capital efficiency. I see ServiceNow better positioned to defend and grow market share in 2026.
Which stock offers better returns?
The past year shows notable declines for both stocks, with sustained selling pressures and decelerating bearish trends dominating their trading dynamics.
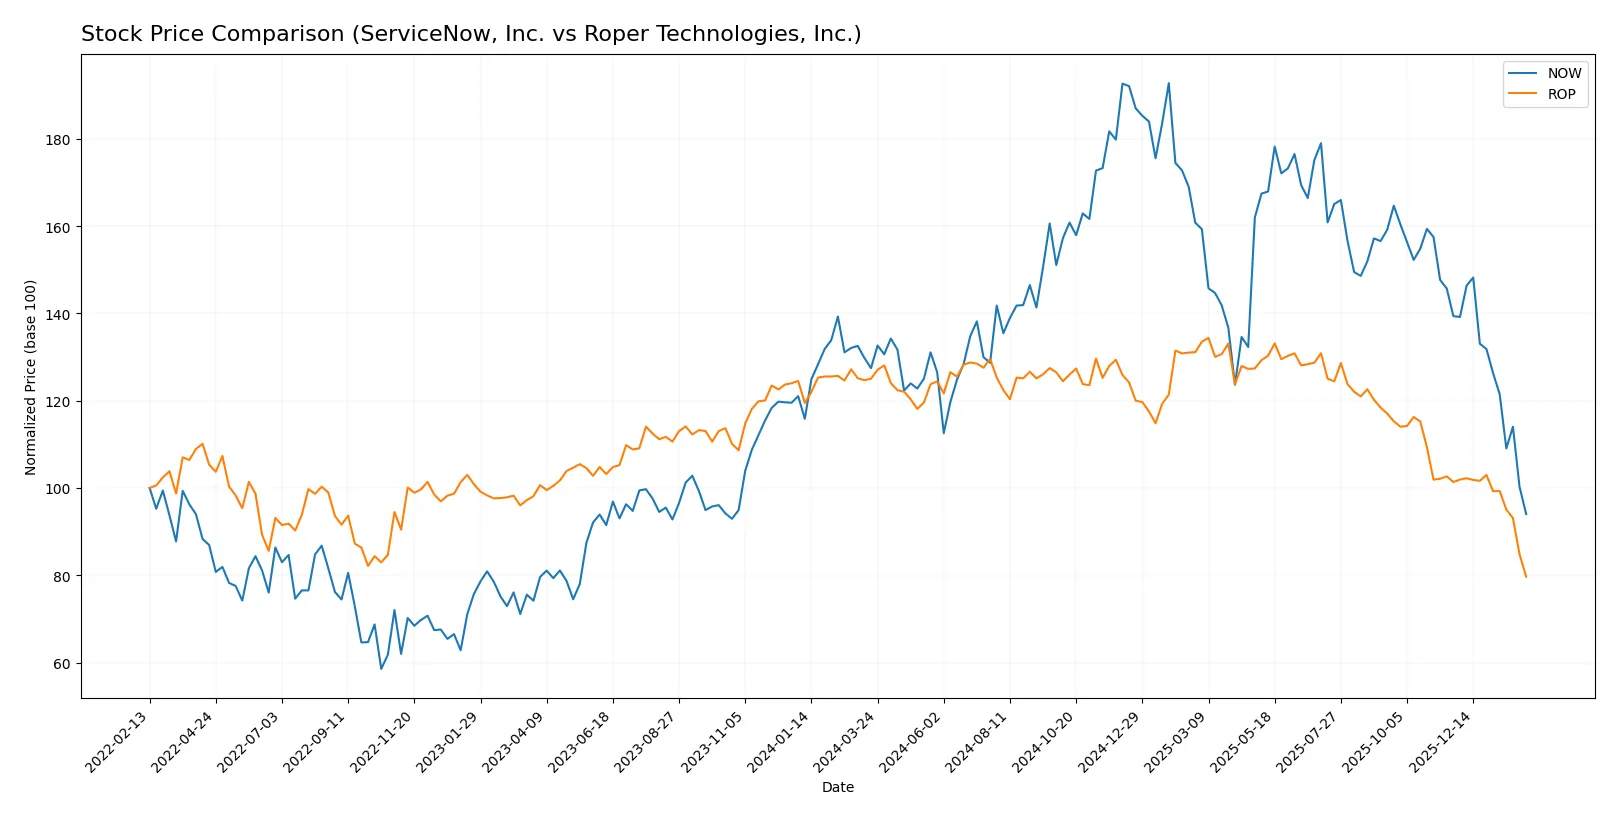
Trend Comparison
ServiceNow, Inc. (NOW) exhibits a bearish trend with a -26.22% price change over 12 months, showing deceleration and a high volatility level (std dev 25.07). The stock peaked at 225.0 and bottomed at 109.77.
Roper Technologies, Inc. (ROP) also follows a bearish trend, declining -36.27% over the same period with deceleration and even greater volatility (std dev 48.31). Its price ranged between 588.38 and 348.82.
Comparing the two, NOW’s decline is less severe than ROP’s, delivering a comparatively better market performance over the past year.
Target Prices
Analysts present a wide range of target prices, reflecting divergent views on growth prospects and risks.
| Company | Target Low | Target High | Consensus |
|---|---|---|---|
| ServiceNow, Inc. | 115 | 1315 | 440.64 |
| Roper Technologies, Inc. | 365 | 575 | 475.5 |
ServiceNow’s consensus target stands roughly 4x above its current price of 110, suggesting optimism despite volatility. Roper’s target consensus is about 36% above its current 349 price, indicating moderate upside potential.

Don’t Let Luck Decide Your Entry Point
Optimize your entry points with our advanced ProRealTime indicators. You’ll get efficient buy signals with precise price targets for maximum performance. Start outperforming now!
How do institutions grade them?
ServiceNow, Inc. Grades
Here are the latest institutional grades for ServiceNow, Inc.:
| Grading Company | Action | New Grade | Date |
|---|---|---|---|
| Citigroup | Maintain | Buy | 2026-01-30 |
| Evercore ISI Group | Maintain | Outperform | 2026-01-29 |
| Macquarie | Maintain | Neutral | 2026-01-29 |
| BTIG | Maintain | Buy | 2026-01-29 |
| RBC Capital | Maintain | Outperform | 2026-01-29 |
| Keybanc | Maintain | Underweight | 2026-01-29 |
| Stifel | Maintain | Buy | 2026-01-29 |
| DA Davidson | Maintain | Buy | 2026-01-29 |
| Cantor Fitzgerald | Maintain | Overweight | 2026-01-29 |
| Needham | Maintain | Buy | 2026-01-29 |
Roper Technologies, Inc. Grades
Below are the recent institutional grades for Roper Technologies, Inc.:
| Grading Company | Action | New Grade | Date |
|---|---|---|---|
| Goldman Sachs | Maintain | Neutral | 2026-01-29 |
| Argus Research | Downgrade | Hold | 2026-01-28 |
| Mizuho | Maintain | Underperform | 2026-01-28 |
| RBC Capital | Maintain | Sector Perform | 2026-01-28 |
| Stifel | Downgrade | Hold | 2026-01-28 |
| Citigroup | Maintain | Buy | 2026-01-28 |
| JP Morgan | Maintain | Underweight | 2026-01-28 |
| Truist Securities | Maintain | Buy | 2026-01-28 |
| Barclays | Maintain | Underweight | 2026-01-28 |
| Oppenheimer | Downgrade | Perform | 2026-01-28 |
Which company has the best grades?
ServiceNow, Inc. commands stronger grades with multiple Buy and Outperform ratings. Roper Technologies shows more mixed views and several downgrades. Investors might see ServiceNow as the more favored pick currently.
Risks specific to each company
The following categories identify the critical pressure points and systemic threats facing both firms in the 2026 market environment:
1. Market & Competition
ServiceNow, Inc.
- Faces intense competition in enterprise cloud software with high innovation pace.
Roper Technologies, Inc.
- Operates in diverse industrial machinery markets with exposure to cyclical demand and specialized competitors.
2. Capital Structure & Debt
ServiceNow, Inc.
- Maintains low leverage with debt-to-assets at 12.3%, interest coverage infinite, indicating strong financial stability.
Roper Technologies, Inc.
- Shows favorable debt ratios but lacks disclosed WACC; interest coverage at 6.96x still solid but less robust.
3. Stock Volatility
ServiceNow, Inc.
- Beta near 1 (0.978) suggests market-level volatility; recent price drop of nearly 7% signals sensitivity to tech sector swings.
Roper Technologies, Inc.
- Slightly lower beta at 0.93; shares also declined ~6.4%, reflecting industrial sector cyclicality and market fluctuations.
4. Regulatory & Legal
ServiceNow, Inc.
- Faces regulatory scrutiny typical for tech firms, including data privacy and compliance risks.
Roper Technologies, Inc.
- Industrial products subject to safety and environmental regulations; potential legal exposure in manufacturing and healthcare segments.
5. Supply Chain & Operations
ServiceNow, Inc.
- Software delivery model limits supply chain risk but depends on data centers and cloud infrastructure resilience.
Roper Technologies, Inc.
- Heavily reliant on complex manufacturing and global supply chains, vulnerable to disruptions and cost inflation.
6. ESG & Climate Transition
ServiceNow, Inc.
- Faces pressure to improve sustainability in data operations; potential reputational risk if ESG standards slip.
Roper Technologies, Inc.
- Industrial footprint demands active climate transition strategies; risks from regulatory shifts and investor scrutiny.
7. Geopolitical Exposure
ServiceNow, Inc.
- Global client base exposes it to geopolitical risks in data sovereignty and cross-border regulations.
Roper Technologies, Inc.
- International operations subject to trade tensions, tariffs, and geopolitical instability affecting supply chains.
Which company shows a better risk-adjusted profile?
ServiceNow’s primary risk lies in its high valuation multiples and competitive pressure in a rapidly evolving tech landscape. Roper’s biggest concern is operational complexity and weak liquidity metrics amid industrial cyclicality. I see ServiceNow’s stronger balance sheet and Altman Z-score in the safe zone as decisive advantages. Despite stock volatility, ServiceNow offers a more resilient risk-adjusted profile, while Roper’s financial distress signals require caution.
Final Verdict: Which stock to choose?
ServiceNow’s superpower lies in its unmatched efficiency in scaling high-margin software revenue with accelerating profitability. Its point of vigilance is a current ratio below 1, signaling potential liquidity constraints in turbulent markets. This stock suits aggressive growth portfolios aiming for market leadership in enterprise SaaS.
Roper Technologies commands a strategic moat through diversified industrial software and data solutions with steady cash generation. Compared to ServiceNow, it offers better financial stability but slower growth momentum. Roper fits well in GARP portfolios, blending moderate growth with reasonable valuation and resilient earnings.
If you prioritize rapid innovation and market expansion to capture future tech adoption, ServiceNow is the compelling choice due to its growing ROIC and strong income statement momentum. However, if you seek income reliability and defensive qualities amid market volatility, Roper offers better stability and a durable business model despite recent ROIC headwinds.
Disclaimer: Investment carries a risk of loss of initial capital. The past performance is not a reliable indicator of future results. Be sure to understand risks before making an investment decision.
Go Further
I encourage you to read the complete analyses of ServiceNow, Inc. and Roper Technologies, Inc. to enhance your investment decisions: