Home > Comparison > Industrials > ROP vs TTAN
The strategic rivalry between Roper Technologies and ServiceTitan defines the evolving landscape of industrial and technology sectors. Roper operates as a diversified industrial machinery powerhouse with a broad portfolio of engineered products and software solutions. ServiceTitan, in contrast, is a nimble, high-growth software application provider focused on field service management. This analysis will assess which company’s trajectory offers superior risk-adjusted potential for a well-diversified portfolio.
Table of contents
Companies Overview
Roper Technologies and ServiceTitan stand as influential players in industrial machinery and software applications, respectively.
Roper Technologies, Inc.: Diverse Industrial Solutions Leader
Roper Technologies dominates the industrial machinery sector with a broad portfolio of software and engineered products. Its core revenue stems from cloud-based software for insurance, healthcare, and financial analytics, alongside precision instruments and control systems. In 2026, Roper focuses strategically on expanding its cloud-based analytics and automation capabilities to strengthen its technological moat.
ServiceTitan, Inc.: Field Service Software Innovator
ServiceTitan leads in software applications tailored to field service management for residential and commercial infrastructure. Its revenue engine revolves around cloud-based platforms that streamline service installation, maintenance, and management. The company’s 2026 strategy emphasizes scaling its software adoption and enhancing integrations to deepen customer engagement in a competitive tech landscape.
Strategic Collision: Similarities & Divergences
Both companies leverage technology-driven solutions but diverge significantly in scope; Roper operates a diversified industrial ecosystem while ServiceTitan pursues a focused software niche. Their competition centers on digital transformation of traditional operations, with Roper serving broader industries and ServiceTitan targeting field service verticals. This contrast defines their distinct investment profiles—Roper as a steady industrial conglomerate and ServiceTitan as a high-growth tech specialist.
Income Statement Comparison
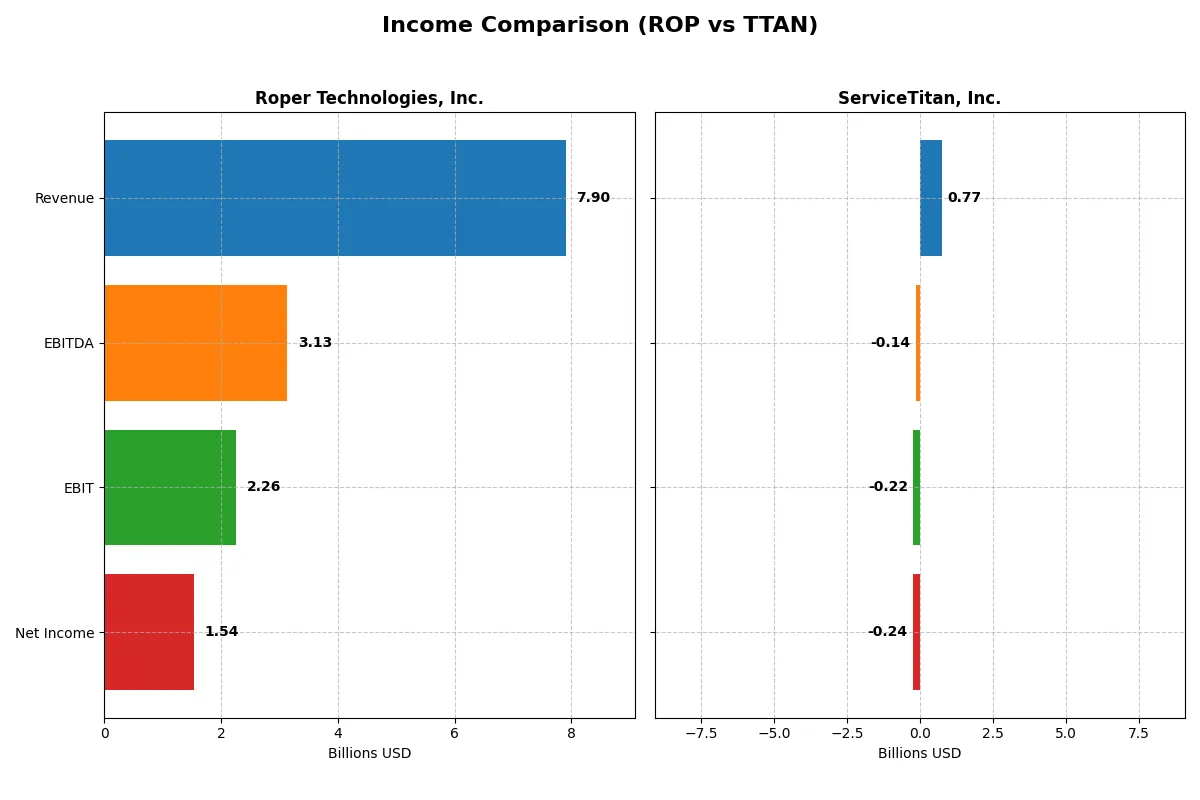
The following figures dissect the core profitability and scalability of both corporate engines to reveal who dominates the bottom line:
| Metric | Roper Technologies, Inc. (ROP) | ServiceTitan, Inc. (TTAN) |
|---|---|---|
| Revenue | 7.9B | 772M |
| Cost of Revenue | 2.43B | 271M |
| Operating Expenses | 3.24B | 731M |
| Gross Profit | 5.47B | 501M |
| EBITDA | 3.13B | -141M |
| EBIT | 2.26B | -221M |
| Interest Expense | 325M | 15.5M |
| Net Income | 1.54B | -239M |
| EPS | 14.31 | -8.53 |
| Fiscal Year | 2025 | 2025 |
Income Statement Analysis: The Bottom-Line Duel
This income statement comparison reveals the true efficiency and profitability dynamics driving each company’s financial engine.
Roper Technologies, Inc. Analysis
Roper Technologies grew revenue steadily from $4.8B in 2021 to $7.9B in 2025, with net income rising from $1.1B to $1.5B. Gross margin remains robust at 69%, and net margin healthy at 19%, reflecting strong cost control. Despite a slight dip in net margin growth last year, Roper sustains solid operating efficiency and consistent earnings momentum.
ServiceTitan, Inc. Analysis
ServiceTitan expanded revenue sharply from $468M in 2023 to $772M in 2025, with gross margin at a favorable 65%. However, it remains unprofitable, posting a negative net margin near -31% in 2025. Operating losses deepened, driven by increased expenses outpacing revenue gains. The company shows growth potential but lacks efficiency in converting sales into profits.
Margin Strength vs. Growth Challenges
Roper Technologies demonstrates superior profitability and margin stability, generating strong cash flows and consistent earnings growth. ServiceTitan excels in rapid revenue expansion but struggles with persistent net losses and negative operating margins. For investors prioritizing stable profits, Roper’s profile offers a clearer path to value realization than ServiceTitan’s high-growth, high-risk model.
Financial Ratios Comparison
These vital ratios act as a diagnostic tool to expose the underlying fiscal health, valuation premiums, and capital efficiency for the companies compared below:
| Ratios | Roper Technologies, Inc. (ROP) | ServiceTitan, Inc. (TTAN) |
|---|---|---|
| ROE | 7.7% | -16.4% |
| ROIC | 5.6% | -14.1% |
| P/E | 31.1 | -18.1 |
| P/B | 2.4 | 3.0 |
| Current Ratio | 0.52 | 3.74 |
| Quick Ratio | 0.48 | 3.74 |
| D/E (Debt-to-Equity) | 0.47 | 0.11 |
| Debt-to-Assets | 27.0% | 9.4% |
| Interest Coverage | 6.88 | -14.8 |
| Asset Turnover | 0.23 | 0.44 |
| Fixed Asset Turnover | 50.4 | 9.6 |
| Payout Ratio | 23.1% | 0% |
| Dividend Yield | 0.74% | 0% |
| Fiscal Year | 2025 | 2025 |
Efficiency & Valuation Duel: The Vital Signs
Financial ratios act as a company’s DNA, revealing hidden risks and operational strengths that shape investor expectations and portfolio decisions.
Roper Technologies, Inc.
Roper Technologies shows solid profitability with a 7.7% ROE and a strong 19.4% net margin. Its valuation appears stretched at a 31.1 P/E, reflecting market optimism despite moderate returns. Dividend yield is low at 0.74%, indicating a focus on stable capital allocation rather than aggressive shareholder payouts.
ServiceTitan, Inc.
ServiceTitan struggles with negative profitability metrics: a -16.4% ROE and -31.0% net margin. The stock’s valuation is unusual, with a negative P/E but a moderate 2.98 P/B ratio. It pays no dividends, reinvesting heavily in R&D and growth, which weighs on short-term returns but targets long-term expansion.
Premium Valuation vs. Operational Safety
Roper offers a balanced risk-reward profile with positive profitability amid a premium valuation. ServiceTitan’s growth potential comes with significant operational losses and uncertain returns. Investors seeking stability may prefer Roper, while those chasing growth must accept higher risk with ServiceTitan.
Which one offers the Superior Shareholder Reward?
I see Roper Technologies, Inc. (ROP) delivers steady shareholder rewards through dividends and buybacks. Its 2025 dividend yield stands at 0.74%, supported by a conservative 23% payout ratio and strong free cash flow coverage near 98%. ROP’s buyback activity complements its distribution, reinforcing capital return. Conversely, ServiceTitan, Inc. (TTAN) pays no dividends and shows negative profitability margins, reflecting heavy reinvestment in growth. Its buyback program is minimal, limiting immediate shareholder returns. While TTAN’s growth focus may pay off long-term, ROP’s balanced dividend and buyback model offers a more sustainable and attractive total return for investors in 2026.
Comparative Score Analysis: The Strategic Profile
The radar chart reveals the fundamental DNA and trade-offs of Roper Technologies and ServiceTitan, highlighting each firm’s core financial strengths and weaknesses:
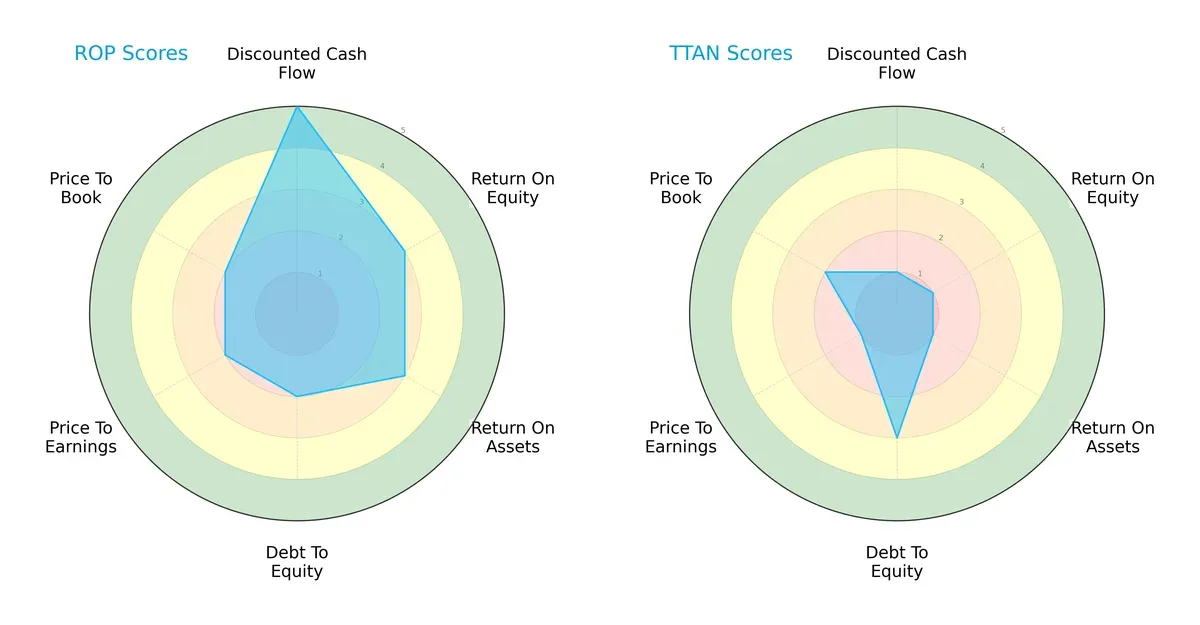
Roper Technologies shows a more balanced profile with strong discounted cash flow (5) and moderate returns on equity (3) and assets (3), but carries moderate debt risk (2) and valuation scores (2). ServiceTitan relies heavily on its moderate debt-to-equity strength (3) but scores very low across cash flow (1), returns (1), and valuation metrics (1), reflecting a narrow competitive edge and higher financial vulnerability.
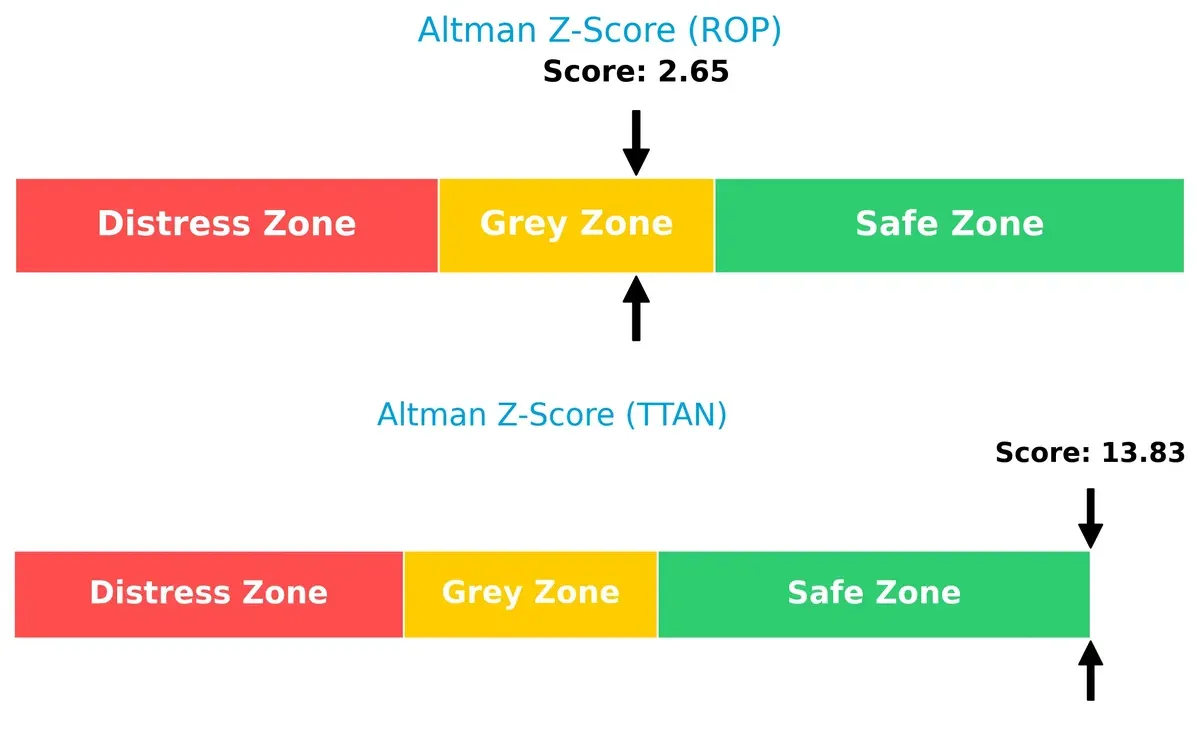
Bankruptcy Risk: Solvency Showdown
The Altman Z-Score gap indicates ServiceTitan’s superior solvency, firmly in the safe zone, while Roper sits in the grey zone, signaling moderate bankruptcy risk in this cycle:
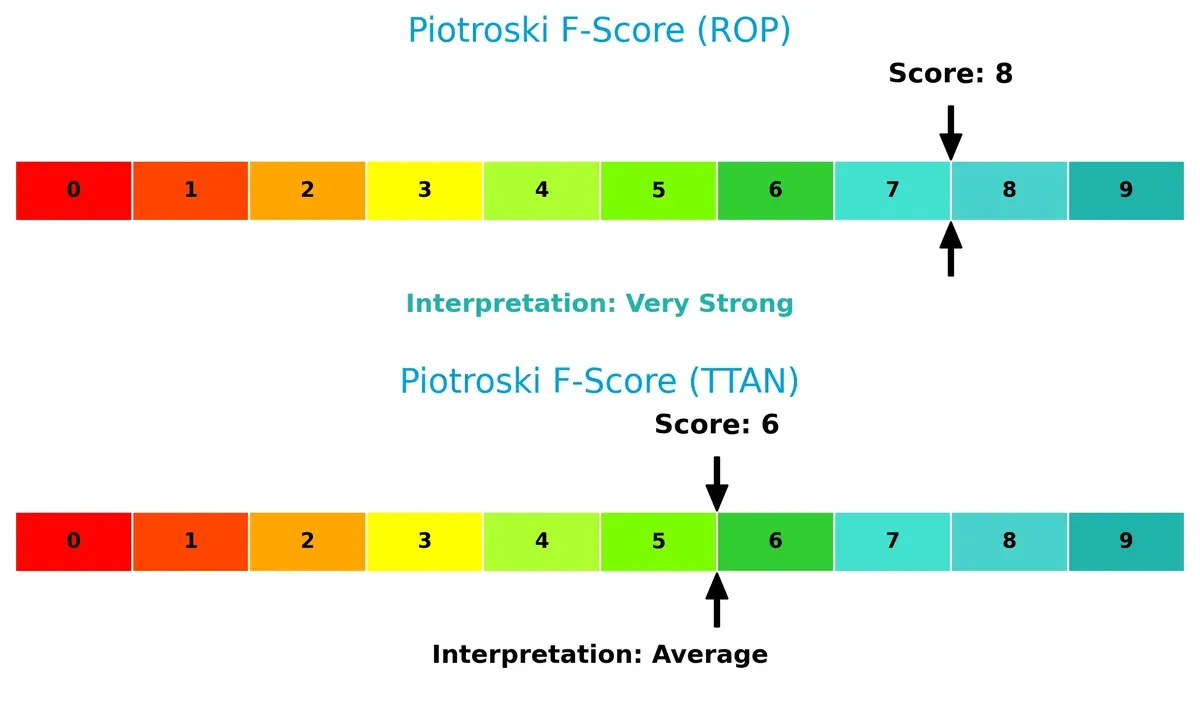
Financial Health: Quality of Operations
Roper’s Piotroski F-Score of 8 signals very strong financial health, outperforming ServiceTitan’s average score of 6, which hints at operational red flags and lower internal financial quality:
How are the two companies positioned?
This section dissects the operational DNA of Roper and ServiceTitan by comparing revenue distribution and internal dynamics—strengths and weaknesses. The goal is to confront their economic moats to identify which business model offers the most resilient competitive advantage today.
Revenue Segmentation: The Strategic Mix
This visual comparison dissects how Roper Technologies and ServiceTitan diversify their income streams and where their primary sector bets lie:
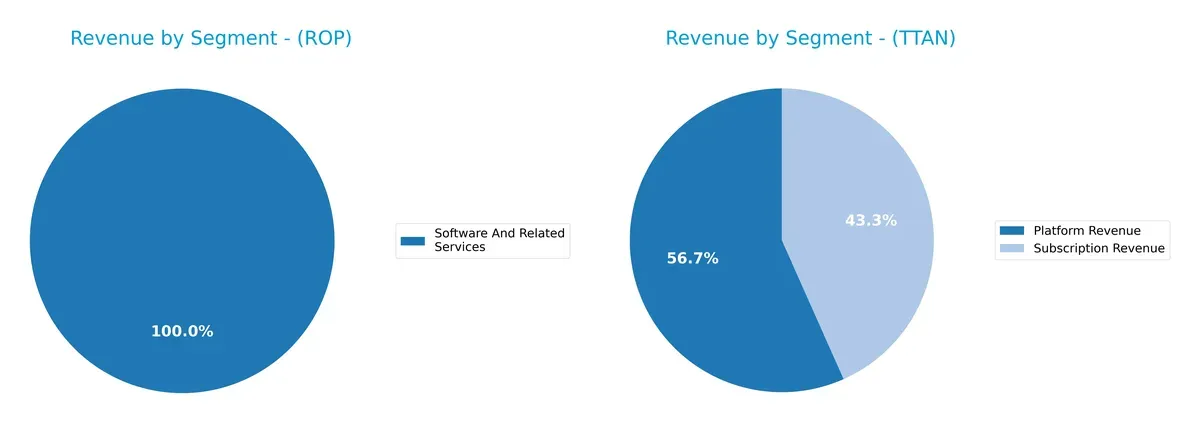
Roper Technologies displays a more diversified mix, with software-related segments generating $10.7B in 2024 and multiple specialized units contributing smaller amounts. ServiceTitan relies heavily on two segments: Platform Revenue at $740M and Subscription Revenue at $566M. Roper’s broad portfolio reduces concentration risk, while ServiceTitan’s focus suggests ecosystem lock-in but heightens dependency on core platforms.
Strengths and Weaknesses Comparison
This table compares the Strengths and Weaknesses of Roper Technologies, Inc. and ServiceTitan, Inc.:
ROP Strengths
- Diverse software segments generating over 10B USD revenue
- Favorable net margin at 19.44%
- Low debt-to-assets at 26.9%
- Strong interest coverage at 6.96
- Favorable WACC at 7.27%
- Large US market presence with 6B USD revenue
TTAN Strengths
- Favorable WACC at 5.03%
- Low debt-to-assets at 9.35%
- Favorable quick ratio at 3.74
- Favorable fixed asset turnover at 9.57
- Subscription-based revenue model of 566M USD
- Platform revenue of 739M USD
ROP Weaknesses
- Unfavorable current and quick ratios below 1
- ROE at 7.73% below WACC
- Unfavorable P/E at 31.06
- Low asset turnover at 0.23
- Unfavorable dividend yield at 0.74%
- Moderate market diversification outside US
TTAN Weaknesses
- Negative net margin at -30.98%
- Negative ROE at -16.44% and ROIC at -14.11%
- Negative interest coverage at -14.26
- Unfavorable current ratio at 3.74
- Unfavorable asset turnover at 0.44
- Zero dividend yield
Roper demonstrates financial stability with strong margins and capital structure, though liquidity and efficiency metrics lag. ServiceTitan shows growth potential via subscription revenue but faces operational losses and liquidity concerns. Both companies must address their weaknesses to sustain competitive market positions.
The Moat Duel: Analyzing Competitive Defensibility
A structural moat is the only thing protecting long-term profits from competition’s relentless erosion. Let’s dissect how moats shape Roper and ServiceTitan’s futures:
Roper Technologies, Inc.: Diversified Industrial Intangible Assets
Roper’s moat stems from its broad portfolio of specialized software and engineered products. This drives stable margins and a growing ROIC trend despite current value shedding. Expansion into cloud analytics strengthens its moat in 2026.
ServiceTitan, Inc.: Platform Network Effects in Field Services
ServiceTitan’s moat relies on network effects linking contractors and customers with proprietary software. Unlike Roper, it shows negative ROIC versus WACC but has rapid revenue growth. Market disruption risks loom, yet expansion into new verticals could deepen its competitive edge.
Industrial Diversification vs. Software Network Effects
Roper’s wider moat benefits from diversified industrial assets and margin stability, while ServiceTitan’s narrower moat hinges on scaling network effects amid profitability challenges. Roper is better positioned to defend market share over the long term.
Which stock offers better returns?
The past year shows sustained bearish trends for both stocks, with sharp declines and decelerating momentum reflecting persistent selling pressure.
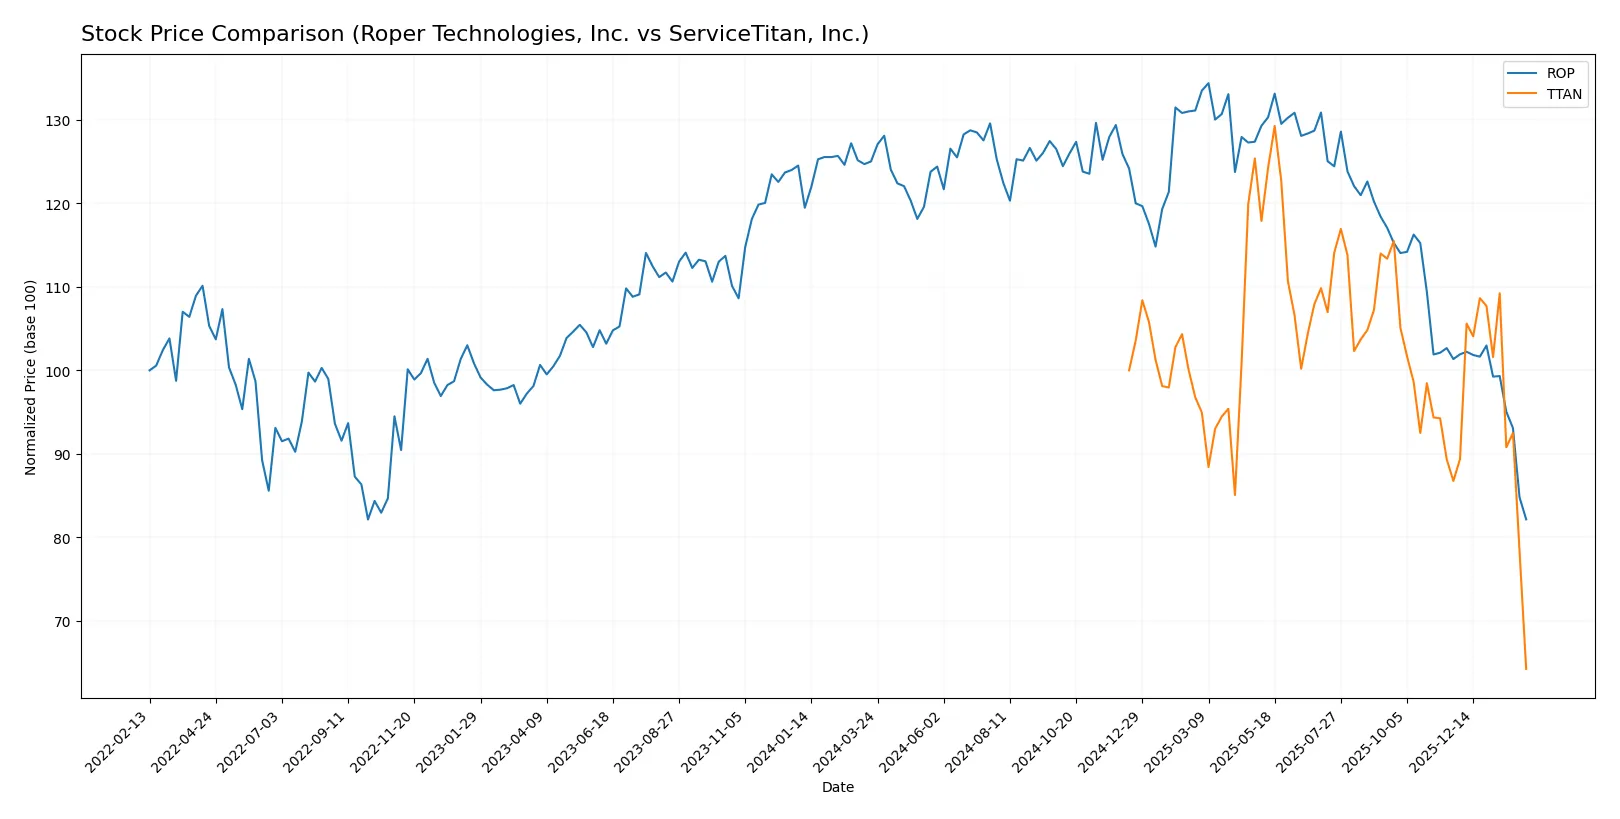
Trend Comparison
Roper Technologies, Inc. (ROP) experienced a 34.28% price decline over the last 12 months, with decelerating bearish momentum and volatility at 47.92, hitting a high of 588.38 and a low of 359.71.
ServiceTitan, Inc. (TTAN) saw a 35.75% drop in stock price over the same period, also with decelerating bearish momentum but lower volatility at 11.41, ranging between 129.26 and 64.25.
ROP and TTAN both endured significant losses, yet ROP’s slightly smaller decline indicates marginally better market performance across the year.
Target Prices
Analysts present a bullish consensus for both Roper Technologies and ServiceTitan with notable upside potential.
| Company | Target Low | Target High | Consensus |
|---|---|---|---|
| Roper Technologies, Inc. | 365 | 575 | 475.5 |
| ServiceTitan, Inc. | 117 | 145 | 130.89 |
Roper’s target consensus stands 32% above its current price of $360, signaling strong growth expectations. ServiceTitan shows an even more pronounced upside, with consensus targets over 100% above its $64 price, reflecting high growth anticipation in software.

Don’t Let Luck Decide Your Entry Point
Optimize your entry points with our advanced ProRealTime indicators. You’ll get efficient buy signals with precise price targets for maximum performance. Start outperforming now!
How do institutions grade them?
Here is a summary of the latest grades assigned to Roper Technologies, Inc. and ServiceTitan, Inc.:
Roper Technologies, Inc. Grades
The following table lists recent grades from major financial institutions for Roper Technologies:
| Grading Company | Action | New Grade | Date |
|---|---|---|---|
| Goldman Sachs | Maintain | Neutral | 2026-01-29 |
| Argus Research | Downgrade | Hold | 2026-01-28 |
| Mizuho | Maintain | Underperform | 2026-01-28 |
| RBC Capital | Maintain | Sector Perform | 2026-01-28 |
| Stifel | Downgrade | Hold | 2026-01-28 |
| Citigroup | Maintain | Buy | 2026-01-28 |
| JP Morgan | Maintain | Underweight | 2026-01-28 |
| Truist Securities | Maintain | Buy | 2026-01-28 |
| Barclays | Maintain | Underweight | 2026-01-28 |
| Oppenheimer | Downgrade | Perform | 2026-01-28 |
ServiceTitan, Inc. Grades
Below are recent institutional grades for ServiceTitan from recognized analysts:
| Grading Company | Action | New Grade | Date |
|---|---|---|---|
| Piper Sandler | Maintain | Overweight | 2026-02-03 |
| Morgan Stanley | Maintain | Equal Weight | 2025-12-05 |
| Piper Sandler | Maintain | Overweight | 2025-12-05 |
| BMO Capital | Maintain | Outperform | 2025-12-05 |
| TD Cowen | Maintain | Buy | 2025-12-05 |
| BMO Capital | Maintain | Outperform | 2025-11-20 |
| Wells Fargo | Maintain | Overweight | 2025-09-19 |
| Piper Sandler | Maintain | Overweight | 2025-09-19 |
| Stifel | Maintain | Buy | 2025-09-19 |
| Canaccord Genuity | Maintain | Buy | 2025-09-19 |
Which company has the best grades?
ServiceTitan holds consistently higher grades, including multiple “Buy,” “Outperform,” and “Overweight” ratings. Roper shows more mixed reviews, with several downgrades and neutral or underperform grades. This difference may influence investors seeking stronger institutional confidence.
Risks specific to each company
The following categories identify the critical pressure points and systemic threats facing both firms in the 2026 market environment:
1. Market & Competition
Roper Technologies, Inc.
- Operates in diversified industrial machinery with established market presence and varied product lines.
ServiceTitan, Inc.
- Focuses on software applications for field services, facing intense competition and rapid technological change.
2. Capital Structure & Debt
Roper Technologies, Inc.
- Moderate debt-to-equity ratio (0.47) with favorable interest coverage (6.96), indicating manageable leverage.
ServiceTitan, Inc.
- Low debt-to-equity (0.11) but negative interest coverage (-14.26) signals difficulty servicing debt.
3. Stock Volatility
Roper Technologies, Inc.
- Beta near market average (0.93) suggests moderate volatility aligned with industrial sector norms.
ServiceTitan, Inc.
- Negative beta (-0.86) indicates stock moves inversely to market, raising unpredictability for investors.
4. Regulatory & Legal
Roper Technologies, Inc.
- Subject to industrial regulations and product compliance; historically stable legal environment.
ServiceTitan, Inc.
- Faces regulatory scrutiny in technology and data privacy; evolving compliance requirements pose risks.
5. Supply Chain & Operations
Roper Technologies, Inc.
- Complex global supply chain for machinery components; operational disruptions can impact production.
ServiceTitan, Inc.
- Relies on cloud infrastructure and software development; operational risks include cybersecurity and service uptime.
6. ESG & Climate Transition
Roper Technologies, Inc.
- Industrial footprint requires ongoing adaptation to emissions and sustainability regulations; transition costs likely.
ServiceTitan, Inc.
- Technology-oriented with smaller physical footprint but faces pressure to demonstrate data and energy efficiency.
7. Geopolitical Exposure
Roper Technologies, Inc.
- Global operations expose it to trade tensions and supply chain disruptions, especially in manufacturing hubs.
ServiceTitan, Inc.
- Primarily US-focused but sensitive to international tech regulations and potential export controls.
Which company shows a better risk-adjusted profile?
Roper’s most impactful risk is its weak liquidity ratios, raising short-term financial vulnerability despite stable leverage. ServiceTitan struggles with persistent losses and negative profitability metrics, amplifying financial distress risks. Roper’s moderate beta and stronger interest coverage suggest a better risk-adjusted profile. ServiceTitan’s negative interest coverage and volatile stock behavior increase its risk footprint. Recent data show ServiceTitan’s negative net margin (-31%) and poor interest coverage as red flags, while Roper’s low current ratio (0.52) demands caution but is less alarming than sustained losses.
Final Verdict: Which stock to choose?
Roper Technologies, Inc. (ROP) impresses with its robust cash generation and steadily improving profitability. Its superpower lies in operational efficiency and a growing ROIC trend, despite a point of vigilance around its stretched liquidity ratios. It suits investors aiming for stable, long-term industrial growth exposure.
ServiceTitan, Inc. (TTAN) builds its moat on rapid revenue expansion fueled by strong recurring software demand. It offers a safer balance sheet with ample liquidity but struggles with profitability and value creation. This stock fits growth-oriented portfolios willing to tolerate elevated risks for potential tech disruption.
If you prioritize consistent value creation and operational resilience, ROP outshines with a more favorable financial foundation. However, if you seek aggressive growth with a focus on scaling tech platforms, TTAN offers better upside potential but commands a premium risk profile. Each appeals to distinct investor profiles balancing stability versus growth ambition.
Disclaimer: Investment carries a risk of loss of initial capital. The past performance is not a reliable indicator of future results. Be sure to understand risks before making an investment decision.
Go Further
I encourage you to read the complete analyses of Roper Technologies, Inc. and ServiceTitan, Inc. to enhance your investment decisions: