Home > Analyses > Technology > Microsoft Corporation
Microsoft Corporation transforms how millions connect, work, and play daily through its diverse software, cloud, and device ecosystems. As a dominant force in technology, Microsoft leads with flagship offerings like Office 365, Azure cloud, and Xbox, consistently driving innovation and quality across its segments. With a market influence spanning productivity, cloud infrastructure, and personal computing, the critical question remains: do Microsoft’s robust fundamentals still warrant its premium valuation and growth expectations in today’s evolving tech landscape?

Table of contents
Business Model & Company Overview
Microsoft Corporation, founded in 1975 and headquartered in Redmond, Washington, stands as a global leader in the software infrastructure industry. Its integrated ecosystem spans productivity tools like Office 365 and Teams, cloud platforms such as Azure, and personal computing devices including Surface and Xbox. This cohesive portfolio drives enterprise and consumer engagement worldwide, solidifying Microsoft’s dominant market position.
The company’s revenue engine balances hardware sales, software licensing, and recurring cloud services, generating robust cash flows across diverse segments. Its footprint extends strategically across the Americas, Europe, and Asia, leveraging scale in Productivity, Intelligent Cloud, and More Personal Computing divisions. This diversified model creates a strong economic moat, positioning Microsoft at the forefront of technological innovation and industry evolution.
Financial Performance & Fundamental Metrics
In this section, I analyze Microsoft Corporation’s income statement, key financial ratios, and dividend payout policy to assess its fundamental strength.
Income Statement
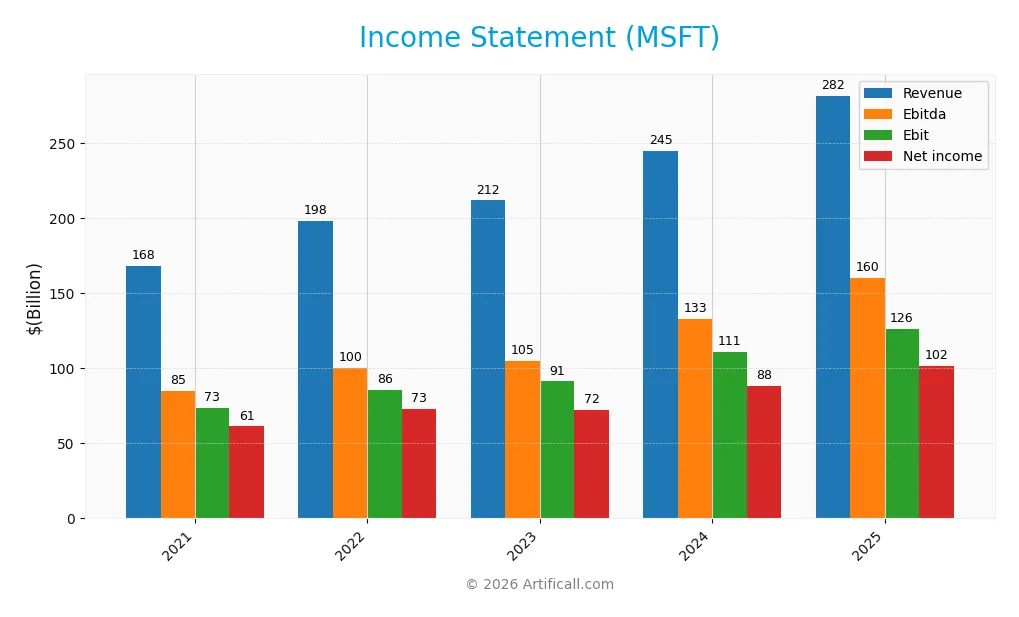
The table below presents Microsoft Corporation’s key income statement figures for the fiscal years 2021 through 2025, reflecting revenue, expenses, and profitability metrics reported in USD.
| 2021 | 2022 | 2023 | 2024 | 2025 | |
|---|---|---|---|---|---|
| Revenue | 168.1B | 198.3B | 211.9B | 245.1B | 281.7B |
| Cost of Revenue | 52.2B | 62.7B | 65.9B | 74.1B | 87.8B |
| Operating Expenses | 45.9B | 52.2B | 57.5B | 61.6B | 65.4B |
| Gross Profit | 115.9B | 135.6B | 146.1B | 171.0B | 193.9B |
| EBITDA | 85.1B | 100.2B | 105.1B | 133.0B | 160.2B |
| EBIT | 73.4B | 85.8B | 91.3B | 110.7B | 126.0B |
| Interest Expense | 2.3B | 2.1B | 2.0B | 2.9B | 2.4B |
| Net Income | 61.3B | 72.7B | 72.4B | 88.1B | 101.8B |
| EPS | 8.12 | 9.70 | 9.72 | 11.86 | 13.7 |
| Filing Date | 2021-07-29 | 2022-07-28 | 2023-07-27 | 2024-07-30 | 2025-07-30 |
Income Statement Evolution
From 2021 to 2025, Microsoft’s revenue grew significantly by 67.61% to reach $282B, with net income increasing 66.2% to $102B. Margins remained largely stable; the gross margin held at a favorable 68.82%, while the EBIT margin improved to 44.73%. Net margin growth was flat overall, showing a slight decline of 0.84%, indicating stable profitability despite strong top-line growth.
Is the Income Statement Favorable?
The 2025 fiscal year shows strong fundamentals with revenue up 14.93% and EBIT rising 13.81%, reflecting efficient cost control. Net margin remained steady at 36.15%, while EPS grew 15.59%, signaling enhanced shareholder value. Interest expense was low at 0.85% of revenue, supporting financial health. Overall, 85.71% of income statement metrics are favorable, suggesting a robust and well-managed income profile.
Financial Ratios
The following table presents key financial ratios for Microsoft Corporation over the past five fiscal years, providing an overview of profitability, valuation, liquidity, leverage, and operational efficiency:
| Ratios | 2021 | 2022 | 2023 | 2024 | 2025 |
|---|---|---|---|---|---|
| Net Margin | 36% | 37% | 34% | 36% | 36% |
| ROE | 43% | 44% | 35% | 33% | 30% |
| ROIC | 24% | 27% | 23% | 23% | 22% |
| P/E | 33.4 | 26.5 | 35.0 | 38.5 | 36.3 |
| P/B | 14.4 | 11.6 | 12.3 | 12.6 | 10.8 |
| Current Ratio | 2.08 | 1.78 | 1.77 | 1.27 | 1.35 |
| Quick Ratio | 2.05 | 1.75 | 1.75 | 1.27 | 1.35 |
| D/E | 0.48 | 0.37 | 0.29 | 0.25 | 0.18 |
| Debt-to-Assets | 20% | 17% | 15% | 13% | 10% |
| Interest Coverage | 30.0 | 40.4 | 45.0 | 37.3 | 53.9 |
| Asset Turnover | 0.50 | 0.54 | 0.51 | 0.48 | 0.46 |
| Fixed Asset Turnover | 2.37 | 2.26 | 1.93 | 1.59 | 1.23 |
| Dividend Yield | 0.81% | 0.94% | 0.78% | 0.64% | 0.65% |
Evolution of Financial Ratios
From 2021 to 2025, Microsoft’s Return on Equity (ROE) showed a declining trend from 43.15% to 29.65%, indicating a moderation in profitability. The Current Ratio decreased from 2.08 to 1.35, suggesting reduced liquidity but remaining above 1. The Debt-to-Equity Ratio improved significantly, dropping from 0.48 to 0.18, reflecting a lower reliance on debt financing and enhanced financial stability.
Are the Financial Ratios Fovorable?
In 2025, Microsoft’s profitability ratios such as net margin (36.15%) and ROE (29.65%) are favorable, alongside strong returns on invested capital. Liquidity ratios present a mixed picture: the quick ratio is favorable at 1.35, while the current ratio is neutral. Leverage ratios, including debt-to-equity at 0.18 and interest coverage at 52.84, are favorable, indicating manageable debt levels. However, market valuation ratios like price-to-earnings (36.31) and price-to-book (10.76) are unfavorable, and efficiency measured by asset turnover (0.46) is also weak. Overall, the ratio profile is slightly favorable.
Shareholder Return Policy
Microsoft Corporation maintains a consistent dividend payout ratio around 24%, with dividend per share rising from $2.19 in 2021 to $3.24 in 2025, supported by a free cash flow coverage ratio near 0.53. The annual dividend yield remains modest, about 0.65%, complemented by ongoing share buybacks.
This balanced distribution aligns with sustainable value creation, as dividends are covered by solid free cash flow and supported by strong profitability margins, reducing risks of unsustainable payouts or excessive share repurchases. The policy reflects prudent capital allocation favoring long-term shareholder returns.
Score analysis
The following radar chart presents a comprehensive overview of Microsoft Corporation’s key financial scores:
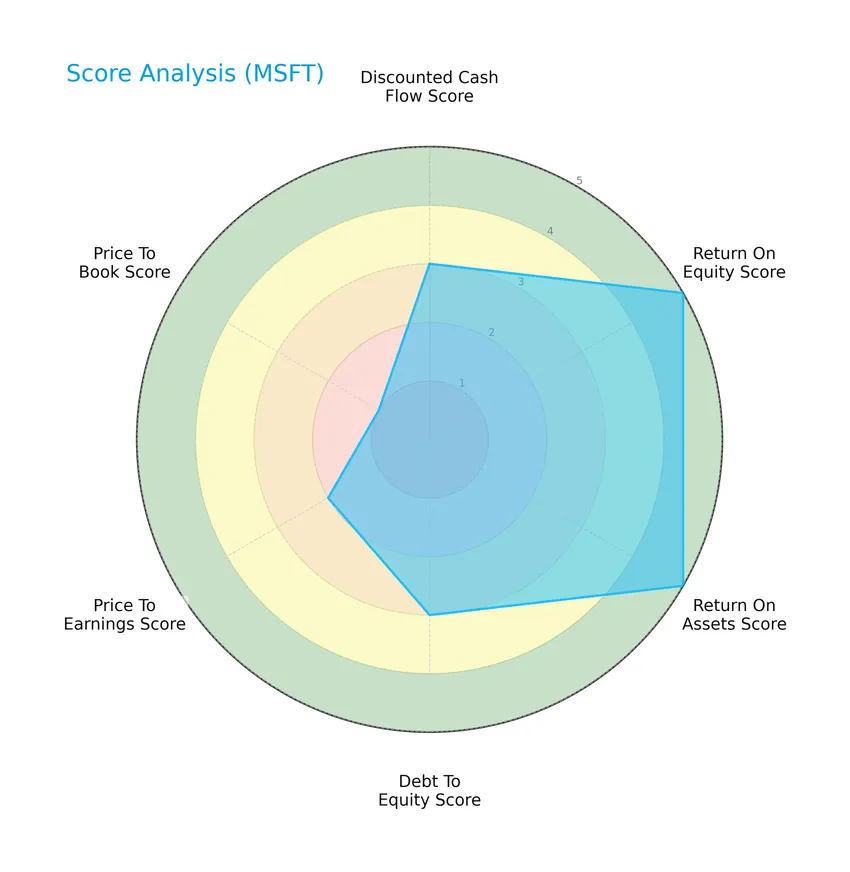
Microsoft shows very favorable profitability metrics with high return on equity and assets scores of 5 each. Its discounted cash flow and debt-to-equity scores stand at moderate levels of 3, while valuation metrics reveal a more cautious picture, with price-to-earnings at 2 and price-to-book at a very unfavorable 1.
Analysis of the company’s bankruptcy risk
Microsoft is positioned well within the safe zone according to its Altman Z-Score, indicating a low risk of bankruptcy:

Is the company in good financial health?
The Piotroski Score diagram below offers insight into Microsoft’s current financial health status:

With a Piotroski Score of 5, Microsoft is considered to have average financial health, reflecting moderate strength in profitability, leverage, liquidity, and operational efficiency factors.
Competitive Landscape & Sector Positioning
This sector analysis will explore Microsoft Corporation’s strategic positioning, revenue by segment, key products, main competitors, and competitive advantages. I will assess whether Microsoft holds a competitive advantage over its industry peers based on these factors.
Strategic Positioning
Microsoft Corporation maintains a highly diversified product portfolio across software, cloud services, devices, gaming, and advertising, with FY2025 revenues spanning segments like Server Products ($98B), Microsoft 365 Commercial ($88B), and Gaming ($23B). Geographically, revenues are well-balanced between the US ($145B) and international markets ($137B), reflecting broad global exposure.
Revenue by Segment
The pie chart presents Microsoft Corporation’s revenue breakdown by product segment for the fiscal year 2025, illustrating the diverse sources contributing to the company’s income.
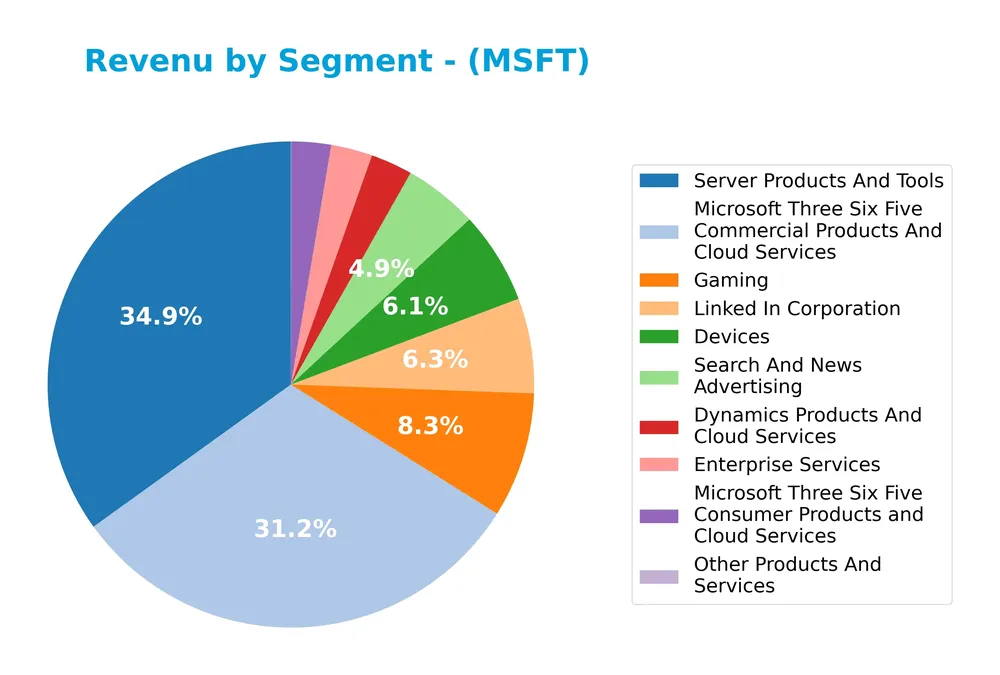
In 2025, Server Products And Tools led with $98.4B, followed by Microsoft 365 Commercial Products And Cloud Services at $87.8B, showcasing strong cloud and enterprise software demand. Gaming revenue rose to $23.5B, reflecting growth in the entertainment sector. LinkedIn and Devices also contributed significantly, with $17.8B and $17.3B respectively. Noteworthy is the decline or absence of traditional segments like Windows, indicating a strategic shift toward cloud services and recurring revenue models.
Key Products & Brands
The following table summarizes Microsoft Corporation’s key products and brands with their respective descriptions:
| Product | Description |
|---|---|
| Office, Exchange, SharePoint, Microsoft Teams, Office 365 Security and Compliance, Microsoft Viva, Skype for Business | Productivity and Business Processes segment software for communication, collaboration, and compliance. |
| Skype, Outlook.com, OneDrive, LinkedIn | Communication, email, cloud storage services, and professional networking platform. |
| Dynamics 365 | Cloud-based and on-premises business solutions for organizations and enterprise divisions. |
| SQL, Windows Servers, Visual Studio, System Center, Client Access Licenses | Intelligent Cloud segment server software and development tools. |
| GitHub | Collaboration platform and code hosting service for developers. |
| Nuance | Healthcare and enterprise AI solutions. |
| Azure | Cloud platform offering computing, analytics, storage, and networking services. |
| Windows OEM and Commercial Licensing, Windows Internet of Things | Operating system licensing for original equipment manufacturers and commercial use. |
| Surface, PCs, tablets, PC accessories | Hardware devices including personal computers and accessories. |
| Gaming (Xbox hardware, content, services, video games) | Gaming consoles, game content, and related services. |
| Search (Bing, Microsoft advertising) | Internet search engine and advertising platform. |
Microsoft’s diversified portfolio spans productivity software, cloud computing, enterprise solutions, hardware devices, gaming, and digital advertising, reflecting its broad technology infrastructure and consumer offerings.
Main Competitors
There are 32 competitors in the sector, with the table below showing the top 10 leaders by market capitalization:
| Competitor | Market Cap. |
|---|---|
| Microsoft Corporation | 3.52T |
| Oracle Corporation | 553B |
| Palantir Technologies Inc. | 383B |
| Adobe Inc. | 140B |
| Palo Alto Networks, Inc. | 120B |
| CrowdStrike Holdings, Inc. | 113B |
| Synopsys, Inc. | 92B |
| Cloudflare, Inc. | 69B |
| Fortinet, Inc. | 59B |
| Block, Inc. | 40B |
Microsoft Corporation ranks 1st among 32 competitors in the Software – Infrastructure industry. Its market cap is 0.9852 times that of the top player, indicating it leads the sector. The company is positioned above both the average market cap of the top 10 competitors (508B) and the median market cap in the sector (18.8B). There is a significant gap of -526.66% to the next competitor below, Oracle Corporation, highlighting Microsoft’s dominant scale.
Comparisons with competitors
Check out how we compare the company to its competitors:
Does Microsoft have a competitive advantage?
Microsoft demonstrates a competitive advantage as it consistently creates value with a ROIC exceeding its WACC by over 13%, indicating efficient use of capital despite a declining ROIC trend. Its strong profitability metrics, including a 36% net margin and favorable revenue growth, support its market position.
Looking ahead, Microsoft’s diverse segments like Intelligent Cloud, Productivity and Business Processes, and More Personal Computing offer opportunities to expand through cloud platforms, AI solutions, and enterprise services. Continued innovation and geographic revenue growth, especially outside the US, underpin its future potential.
SWOT Analysis
This SWOT analysis highlights Microsoft Corporation’s key strategic factors to guide investors in understanding its current position and future potential.
Strengths
- dominant market position with $3.46T market cap
- strong profitability with 36.15% net margin
- diversified portfolio across cloud, software, and devices
Weaknesses
- high PE ratio at 36.31 indicating premium valuation
- declining ROIC trend despite value creation
- relatively high price-to-book ratio at 10.76
Opportunities
- expanding cloud market with Azure growth
- increasing international revenue, $137B non-US in 2025
- potential in AI and enterprise solutions through Nuance acquisition
Threats
- intensifying competition in cloud and software
- regulatory scrutiny in US and abroad
- global economic uncertainty affecting IT spending
Microsoft’s strengths lie in its market leadership, robust margins, and diversified business segments, but investors should watch valuation levels and profitability trends. Growth opportunities in cloud and AI are balanced against competitive and regulatory risks, suggesting a cautious yet optimistic approach.
Stock Price Action Analysis
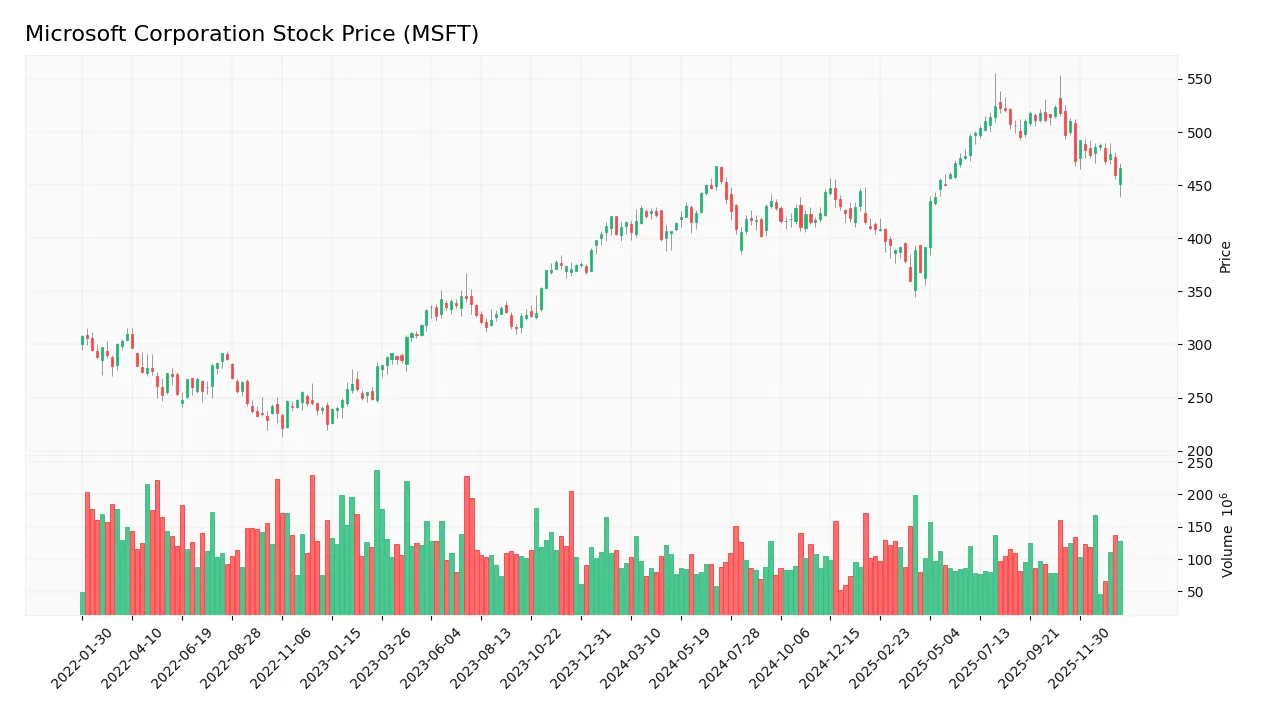
The following weekly stock chart illustrates Microsoft Corporation’s price movements and volatility over the past 12 months:
Trend Analysis
Over the past 12 months, Microsoft’s stock price increased by 12.14%, indicating a bullish trend. The price ranged from a low of 359.84 to a high of 524.11, with notable deceleration in upward momentum. The standard deviation of 42.01 points to significant price volatility during this period.
Volume Analysis
Trading volumes over the last three months show a slight decrease in activity, with buyer volume at 679M and seller volume at 698M, reflecting a neutral buyer dominance of 49.35%. This balanced volume suggests cautious investor sentiment and steady market participation without clear directional pressure.
Target Prices
Analysts present a bullish consensus for Microsoft Corporation with a strong upside potential.
| Target High | Target Low | Consensus |
|---|---|---|
| 675 | 450 | 633.59 |
The target prices suggest analysts expect Microsoft’s stock to trade significantly higher, reflecting confidence in its growth prospects and market position.

Don’t Let Luck Decide Your Entry Point
Optimize your entry points with our advanced ProRealTime indicators. You’ll get efficient buy signals with precise price targets for maximum performance. Start outperforming now!
Analyst & Consumer Opinions
This section reviews the latest analyst ratings and consumer feedback regarding Microsoft Corporation’s market performance and product reception.
Stock Grades
The following table presents the latest verified stock grades from recognized financial institutions for Microsoft Corporation:
| Grading Company | Action | New Grade | Date |
|---|---|---|---|
| UBS | Maintain | Buy | 2026-01-23 |
| Guggenheim | Maintain | Buy | 2026-01-22 |
| Wells Fargo | Maintain | Overweight | 2026-01-22 |
| Mizuho | Maintain | Outperform | 2026-01-21 |
| Citigroup | Maintain | Buy | 2026-01-21 |
| TD Cowen | Maintain | Buy | 2026-01-20 |
| Barclays | Maintain | Overweight | 2026-01-12 |
| Wells Fargo | Maintain | Overweight | 2026-01-08 |
| Wedbush | Maintain | Outperform | 2025-12-22 |
| DA Davidson | Maintain | Buy | 2025-12-04 |
The consensus across these reputable analysts remains consistently positive, with the majority maintaining Buy or equivalent ratings, reflecting confidence in Microsoft’s performance and outlook. No downward revisions were noted in this period, indicating stable sentiment.
Consumer Opinions
Microsoft Corporation continues to evoke mixed but insightful reactions from its broad user base, reflecting its impact across various tech sectors.
| Positive Reviews | Negative Reviews |
|---|---|
| “Microsoft’s software integration boosts my productivity significantly.” | “Windows updates often disrupt my workflow unexpectedly.” |
| “The customer support team is knowledgeable and responsive.” | “Pricing for some enterprise solutions feels steep.” |
| “Their cloud services are reliable and scale well with my business needs.” | “Occasional bugs in new software releases are frustrating.” |
Overall, consumers appreciate Microsoft’s robust software ecosystem and strong support, though some express concerns over update stability and pricing, indicating areas for cautious attention.
Risk Analysis
Below is a summary table of key risks associated with investing in Microsoft Corporation based on recent financial and market data:
| Category | Description | Probability | Impact |
|---|---|---|---|
| Valuation Risk | Elevated P/E (36.31) and P/B (10.76) ratios suggest potential overvaluation. | Medium | High |
| Market Volatility | Beta of 1.073 indicates moderate sensitivity to market swings. | Medium | Medium |
| Competitive Risk | Intense competition in cloud and software sectors could affect growth. | Medium | High |
| Regulatory Risk | Increased scrutiny on tech giants may lead to fines or operational limits. | Low | Medium |
| Innovation Risk | Pressure to maintain leadership in AI, cloud, and software innovation. | Medium | High |
| Dividend Yield Risk | Low dividend yield at 0.65% may disappoint income-focused investors. | Low | Low |
The most significant risks for Microsoft are valuation and competitive pressures, as the stock trades at a premium and the tech industry remains fiercely competitive. Despite strong financials and a safe Altman Z-Score, investors should carefully monitor market conditions and innovation trends.
Should You Buy Microsoft Corporation?
Microsoft appears to be a robust value creator with strong operational efficiency, supported by a durable competitive moat despite a declining ROIC trend. Its leverage profile seems manageable, complemented by a very favorable B+ overall rating, suggesting a stable financial health profile.
Strength & Efficiency Pillars
Microsoft Corporation exhibits robust profitability with a net margin of 36.15% and a return on equity (ROE) of 29.65%, underscoring strong operational efficiency. The company is a clear value creator, as its return on invested capital (ROIC) stands at 22.02%, significantly above its weighted average cost of capital (WACC) of 8.81%. Financial stability is further supported by an Altman Z-score of 9.05, placing Microsoft firmly in the safe zone, although its Piotroski score of 5 suggests moderate financial strength. Overall, these pillars reflect a well-managed enterprise capable of generating sustainable value.
Weaknesses and Drawbacks
Despite its strengths, Microsoft faces valuation pressures with a high price-to-earnings (P/E) ratio of 36.31 and a price-to-book (P/B) ratio of 10.76, both labeled unfavorable, indicating a premium market valuation that could limit upside potential. The current ratio of 1.35 is neutral, suggesting adequate liquidity but not a significant cushion. Although debt-to-equity is low at 0.18, indicating conservative leverage, recent market dynamics show some headwinds with a buyer dominance of 49.35% during the latest period, signaling neutral to slightly seller-favorable momentum that may introduce short-term volatility.
Our Verdict about Microsoft Corporation
Microsoft’s long-term fundamental profile appears favorable, driven by strong profitability and value creation metrics. However, despite a bullish overall stock trend with a 12.14% price increase, recent seller dominance and a -6.21% price decline suggest caution. Consequently, the profile may appear attractive for long-term exposure, but recent market pressure could warrant a wait-and-see approach for a more favorable entry point.
Disclaimer: This content is for informational purposes only and does not constitute financial, investment, or other professional advice. Investing in financial markets involves a significant risk of loss, and past performance is not indicative of future results.
Additional Resources
- What’s Fueling The Surge in Microsoft Stock? – Benzinga (Jan 23, 2026)
- Microsoft: Deep Discount Before Earnings (NASDAQ:MSFT) – Seeking Alpha (Jan 23, 2026)
- Microsoft Stock Hands Over $350 Billion To Shareholders – Forbes (Jan 23, 2026)
- Microsoft (NASDAQ:MSFT) Trading Down 2.3% After Analyst Downgrade – MarketBeat (Jan 21, 2026)
- SoundHound vs. Microsoft: Can the Small Voice AI Player Beat the Tech Giant? – TradingView — Track All Markets (Jan 21, 2026)
For more information about Microsoft Corporation, please visit the official website: microsoft.com