Home > Comparison > Technology > NOW vs BSY
The strategic rivalry between ServiceNow, Inc. and Bentley Systems, Incorporated shapes the evolution of the technology sector’s software application landscape. ServiceNow operates a broad enterprise cloud platform focused on workflow automation and AI, while Bentley Systems specializes in infrastructure engineering software with deep industry-specific solutions. This head-to-head highlights a contrast between expansive platform growth and niche infrastructure expertise. This analysis determines which trajectory offers superior risk-adjusted returns for diversified investors.
Table of contents
Companies Overview
ServiceNow and Bentley Systems are pivotal players shaping enterprise software and infrastructure engineering markets.
ServiceNow, Inc.: Leader in Enterprise Cloud Automation
ServiceNow dominates with its Now platform, powering workflow automation for IT service management and business operations. Its revenue stems from cloud subscriptions across industries like healthcare and finance. In 2026, ServiceNow emphasizes expanding AI-driven automation and strategic partnerships to enhance process efficiency and customer engagement globally.
Bentley Systems, Incorporated: Specialist in Infrastructure Engineering Software
Bentley Systems focuses on infrastructure design and simulation software for civil and geotechnical engineers worldwide. Its revenue is driven by licensing open modeling tools and project delivery systems. Bentley’s 2026 strategy centers on integrating asset performance analytics and collaboration platforms to support complex infrastructure projects and digital twins.
Strategic Collision: Similarities & Divergences
Both firms lead in software but differ in scope—ServiceNow targets enterprise workflows, Bentley engineers infrastructure. They compete indirectly in automation and digital transformation, yet Bentley’s open applications contrast with ServiceNow’s proprietary cloud ecosystem. Investors view ServiceNow as a scalable SaaS growth play, while Bentley offers niche exposure to infrastructure modernization and engineering innovation.
Income Statement Comparison
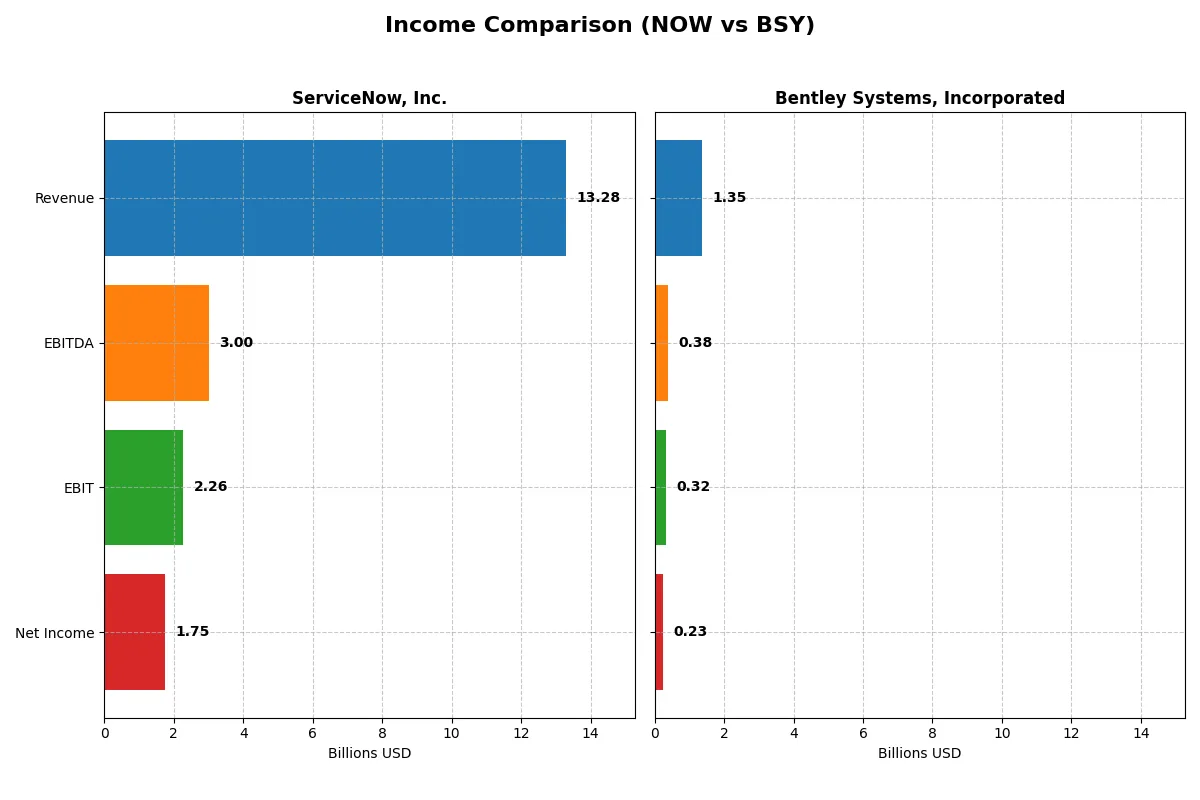
This data dissects the core profitability and scalability of both corporate engines to reveal who dominates the bottom line:
| Metric | ServiceNow, Inc. (NOW) | Bentley Systems, Inc. (BSY) |
|---|---|---|
| Revenue | 13.3B | 1.35B |
| Cost of Revenue | 3.0B | 258M |
| Operating Expenses | 8.5B | 793M |
| Gross Profit | 10.3B | 1.1B |
| EBITDA | 3.0B | 382M |
| EBIT | 2.3B | 318M |
| Interest Expense | 0 | 25M |
| Net Income | 1.75B | 242M |
| EPS | 1.69 | 0.75 |
| Fiscal Year | 2025 | 2024 |
Income Statement Analysis: The Bottom-Line Duel
This income statement comparison exposes which company drives superior efficiency and profitability in their respective markets.
ServiceNow, Inc. Analysis
ServiceNow’s revenue surged from 5.9B in 2021 to 13.3B in 2025, reflecting robust growth momentum. Net income skyrocketed 660%, reaching 1.75B in 2025. The company maintains strong margins, with a gross margin of 77.5% and a net margin of 13.2%. Operating efficiency improved, as EBIT margin expanded to 17%, signaling excellent cost control amid rapid expansion.
Bentley Systems, Incorporated Analysis
Bentley Systems grew revenue steadily from 801M in 2020 to 1.35B in 2024, a respectable 69% increase. Net income climbed 85.6% over five years but showed volatility, dipping to 235M in 2024. Bentley boasts a higher gross margin of 81% and a superior net margin of 17.4%. However, recent net margin and EPS declined, indicating margin pressure despite strong top-line growth.
Growth Momentum vs. Margin Quality
ServiceNow dominates with exceptional growth rates and improving profitability metrics, reflecting powerful scale and operational leverage. Bentley offers higher margins but faces margin erosion and EPS decline recently. For investors seeking rapid expansion and margin improvement, ServiceNow presents a more compelling income statement profile. Bentley suits those prioritizing margin quality but warrants caution due to recent earnings softness.
Financial Ratios Comparison
These vital ratios act as a diagnostic tool to expose the underlying fiscal health, valuation premiums, and capital efficiency of the companies analyzed:
| Ratios | ServiceNow, Inc. (NOW) | Bentley Systems, Incorporated (BSY) |
|---|---|---|
| ROE | 13.5% | 22.6% |
| ROIC | 9.0% | 9.3% |
| P/E | 90.9 | 62.6 |
| P/B | 12.3 | 14.1 |
| Current Ratio | 0.95 | 0.54 |
| Quick Ratio | 0.95 | 0.54 |
| D/E (Debt-to-Equity) | 0.25 | 1.37 |
| Debt-to-Assets | 12.3% | 41.9% |
| Interest Coverage | 0 | 12.2 |
| Asset Turnover | 0.51 | 0.40 |
| Fixed Asset Turnover | 4.29 | 20.47 |
| Payout Ratio | 0% | 31% |
| Dividend Yield | 0% | 0.49% |
| Fiscal Year | 2025 | 2024 |
Efficiency & Valuation Duel: The Vital Signs
Financial ratios act as the company’s DNA, uncovering hidden risks and showcasing operational excellence critical for investment decisions.
ServiceNow, Inc.
ServiceNow delivers a solid net margin of 13.16% with neutral ROE and ROIC just above its WACC, indicating moderate profitability and capital efficiency. However, its P/E ratio of 90.88 signals an expensive stock. The firm pays no dividends, instead reinvesting heavily in R&D, fueling future growth but stretching valuation metrics.
Bentley Systems, Incorporated
Bentley Systems reports a stronger net margin of 17.35% and a robust ROE of 22.55%, signaling efficient profit generation. Its P/E ratio of 62.63 is lower than ServiceNow’s but still high, suggesting a premium valuation. The company carries high debt levels and a weak current ratio, while offering a modest dividend yield of 0.49%, balancing shareholder returns with leverage risks.
Premium Valuation vs. Operational Safety
ServiceNow’s valuation is more stretched with better operational stability and low leverage, while Bentley offers higher profitability but carries significant debt and liquidity risks. Investors prioritizing growth at a high price may prefer ServiceNow, whereas those seeking stronger returns with more risk might lean toward Bentley.
Which one offers the Superior Shareholder Reward?
I see ServiceNow (NOW) pays no dividends, reinvesting heavily in growth, with a 0% payout ratio and strong free cash flow (4.4/share). Bentley Systems (BSY) offers a modest 0.49% dividend yield, a 31% payout ratio, and consistent buybacks. NOW’s aggressive reinvestment supports innovation but demands patience. BSY’s dividend and buybacks provide immediate income but face leverage risks (debt/equity ~1.37). Given NOW’s superior free cash flow coverage and growth focus, I find NOW offers a more attractive total return profile for 2026 investors seeking long-term value creation.
Comparative Score Analysis: The Strategic Profile
The radar chart reveals the fundamental DNA and trade-offs of ServiceNow, Inc. and Bentley Systems, Incorporated, highlighting their strategic strengths and vulnerabilities:
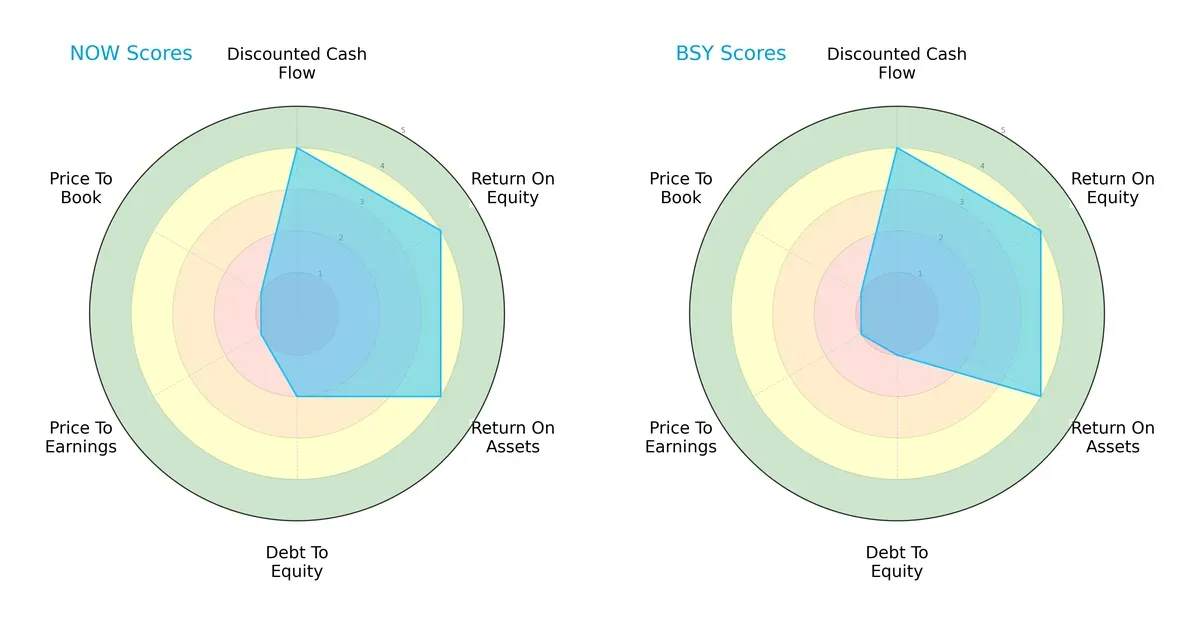
Both companies share strong discounted cash flow, ROE, and ROA scores, signaling efficient capital use and profitability. ServiceNow exhibits a moderately better debt-to-equity profile, implying a more conservative leverage stance. However, both firms face valuation challenges with very unfavorable P/E and P/B scores, suggesting market skepticism or overpricing. Bentley leans heavily on operational efficiency but carries higher financial risk due to its weak debt-to-equity score. Overall, ServiceNow offers a more balanced profile, while Bentley depends on its operational edge amid financial leverage concerns.
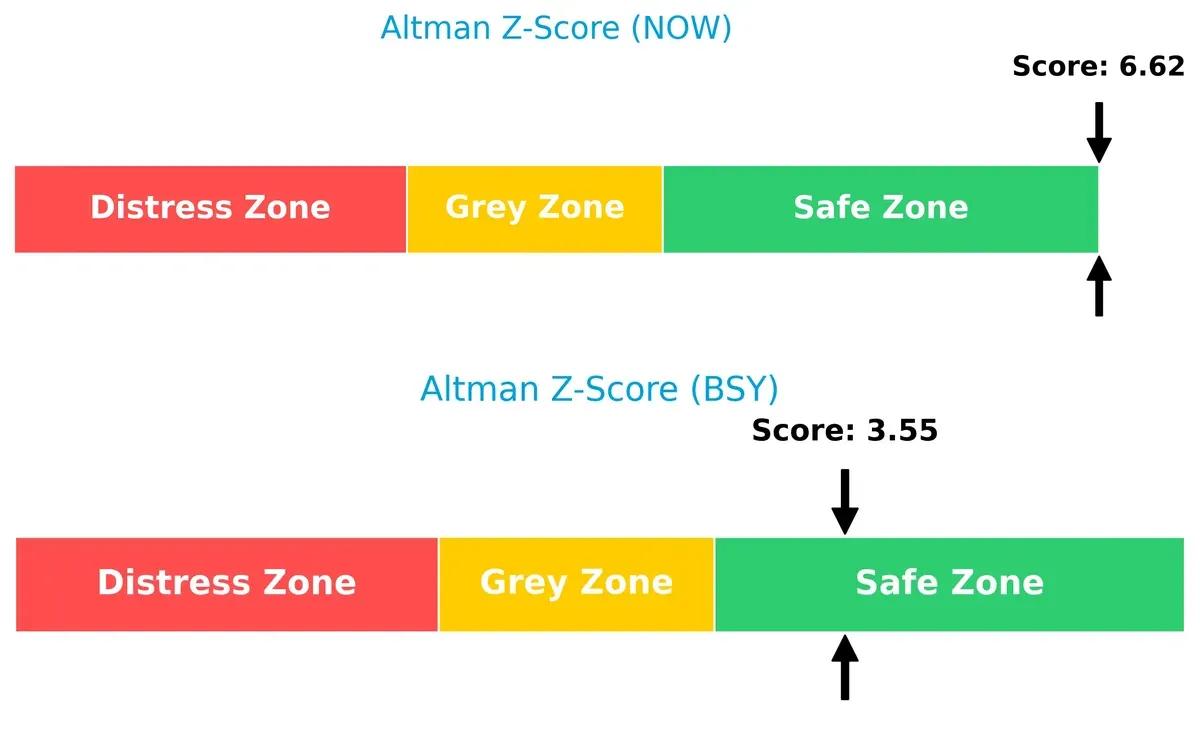
Bankruptcy Risk: Solvency Showdown
ServiceNow’s Altman Z-Score of 6.62 far exceeds Bentley’s 3.55, placing both safely above distress thresholds but signaling ServiceNow’s superior long-term solvency resilience in this cycle:
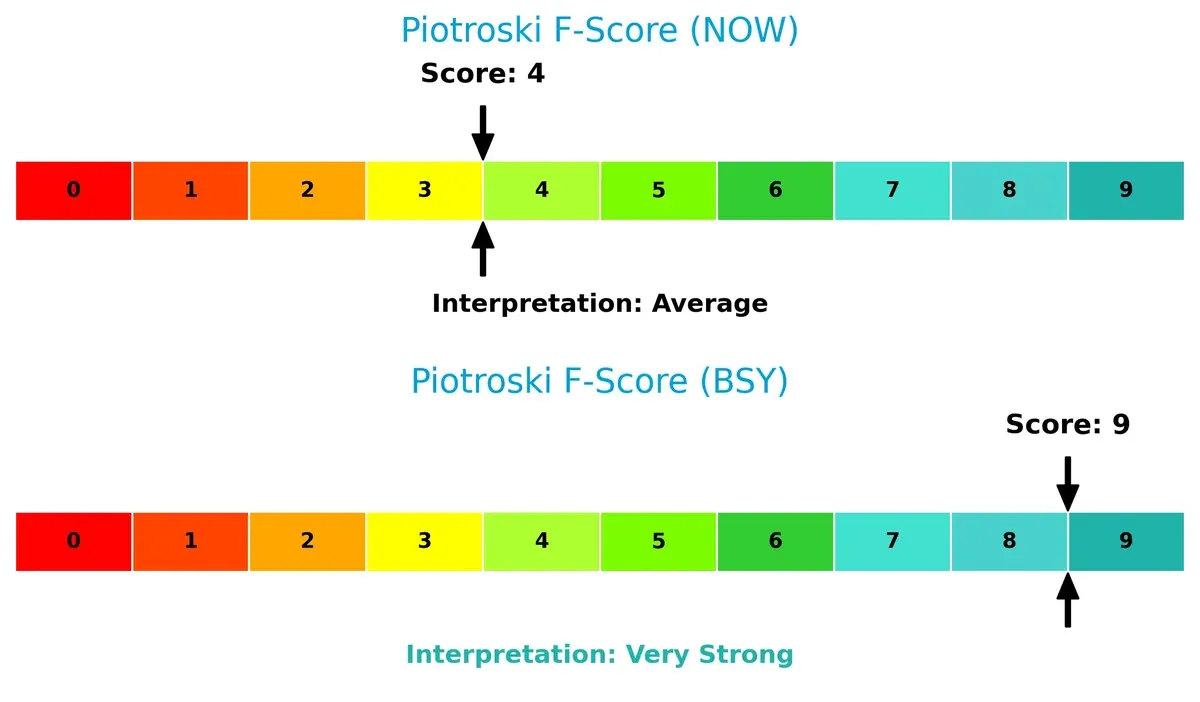
Financial Health: Quality of Operations
Bentley’s Piotroski F-Score of 9 versus ServiceNow’s 4 indicates Bentley’s peak internal financial health, with ServiceNow showing potential red flags in profitability or liquidity metrics:
How are the two companies positioned?
This section dissects the operational DNA of NOW and BSY by comparing their revenue distribution by segment alongside internal strengths and weaknesses. The final objective is to confront their economic moats to identify which business model offers the most resilient and sustainable competitive advantage in today’s market landscape.
Revenue Segmentation: The Strategic Mix
This comparison dissects how ServiceNow and Bentley Systems diversify their income streams and highlights their primary sector bets:
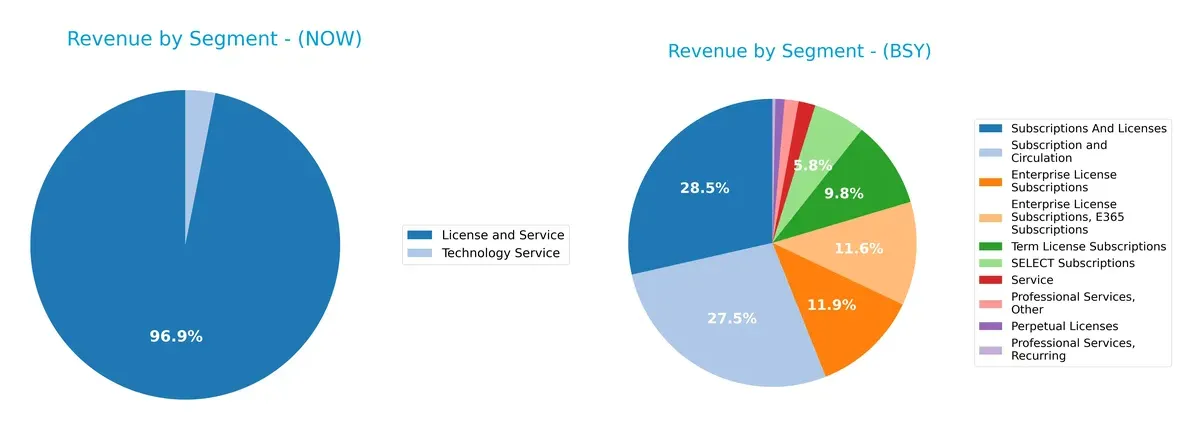
ServiceNow anchors 2025 revenue with $12.9B from License and Service, showing heavy concentration versus Bentley’s $1.27B spread across Subscriptions, Licenses, and Services. Bentley’s mix dilutes risk with multiple mid-sized segments. ServiceNow’s dominance in digital workflow products signals ecosystem lock-in, while Bentley’s diversified subscriptions and professional services revenues reflect infrastructure breadth but also complexity in capital allocation.
Strengths and Weaknesses Comparison
This table compares the Strengths and Weaknesses of ServiceNow, Inc. and Bentley Systems, Incorporated:
ServiceNow Strengths
- Strong global presence led by North America and EMEA
- Favorable net margin of 13.16%
- Low debt-to-equity ratio at 0.25
- High fixed asset turnover of 4.29
- Technology service segment contributes to product diversification
Bentley Systems Strengths
- Higher net margin of 17.35% and strong ROE at 22.55%
- Very high fixed asset turnover of 20.47
- Favorable interest coverage ratio at 12.83
- Diverse revenue from subscriptions and licenses
- Presence across Asia Pacific, EMEA, and Americas
ServiceNow Weaknesses
- Unfavorable valuation metrics: PE 90.88, PB 12.25
- Current ratio below 1.0 at 0.95 signals liquidity risk
- Zero dividend yield
- Neutral ROIC only slightly above WACC
- Limited product diversification dominated by license and service
Bentley Systems Weaknesses
- Unfavorable debt-to-equity ratio of 1.37 indicates higher leverage
- Current and quick ratios both low at 0.54, raising liquidity concerns
- Unfavorable valuation metrics: PE 62.63, PB 14.13
- Modest asset turnover of 0.4 despite strong margins
- Dividend yield low at 0.49%
Overall, ServiceNow shows solid global scale and manageable leverage but faces valuation and liquidity challenges. Bentley Systems excels in profitability and asset efficiency but carries heavier debt and weaker liquidity. Both companies must balance growth ambitions with prudent financial management.
The Moat Duel: Analyzing Competitive Defensibility
A structural moat alone shields a company’s long-term profits from relentless competitive pressure and market erosion:
ServiceNow, Inc.: Workflow Automation Switching Costs
ServiceNow’s moat stems from strong switching costs embedded in its enterprise cloud platform. Its 77.5% gross margin and 17% EBIT margin reflect this. In 2026, expansion into AI-driven automation should deepen customer reliance and margin stability.
Bentley Systems, Incorporated: Specialized Infrastructure Software Niche
Bentley’s moat relies on highly specialized engineering software tailored to infrastructure professionals. Unlike ServiceNow, its 81% gross margin and 23.5% EBIT margin signal operational efficiency but face slower growth. Opportunities lie in integrating 4D construction tech to disrupt peers.
Switching Costs vs. Niche Specialization: Who Defends Better?
ServiceNow’s growing ROIC and broad adoption create a wider moat than Bentley’s shrinking profitability amid niche pressures. I view ServiceNow as better positioned to defend and expand market share through scalable automation platforms.
Which stock offers better returns?
The past year reveals clear bearish trends for both stocks, with notable price declines and differing volatility profiles shaping their trading dynamics.
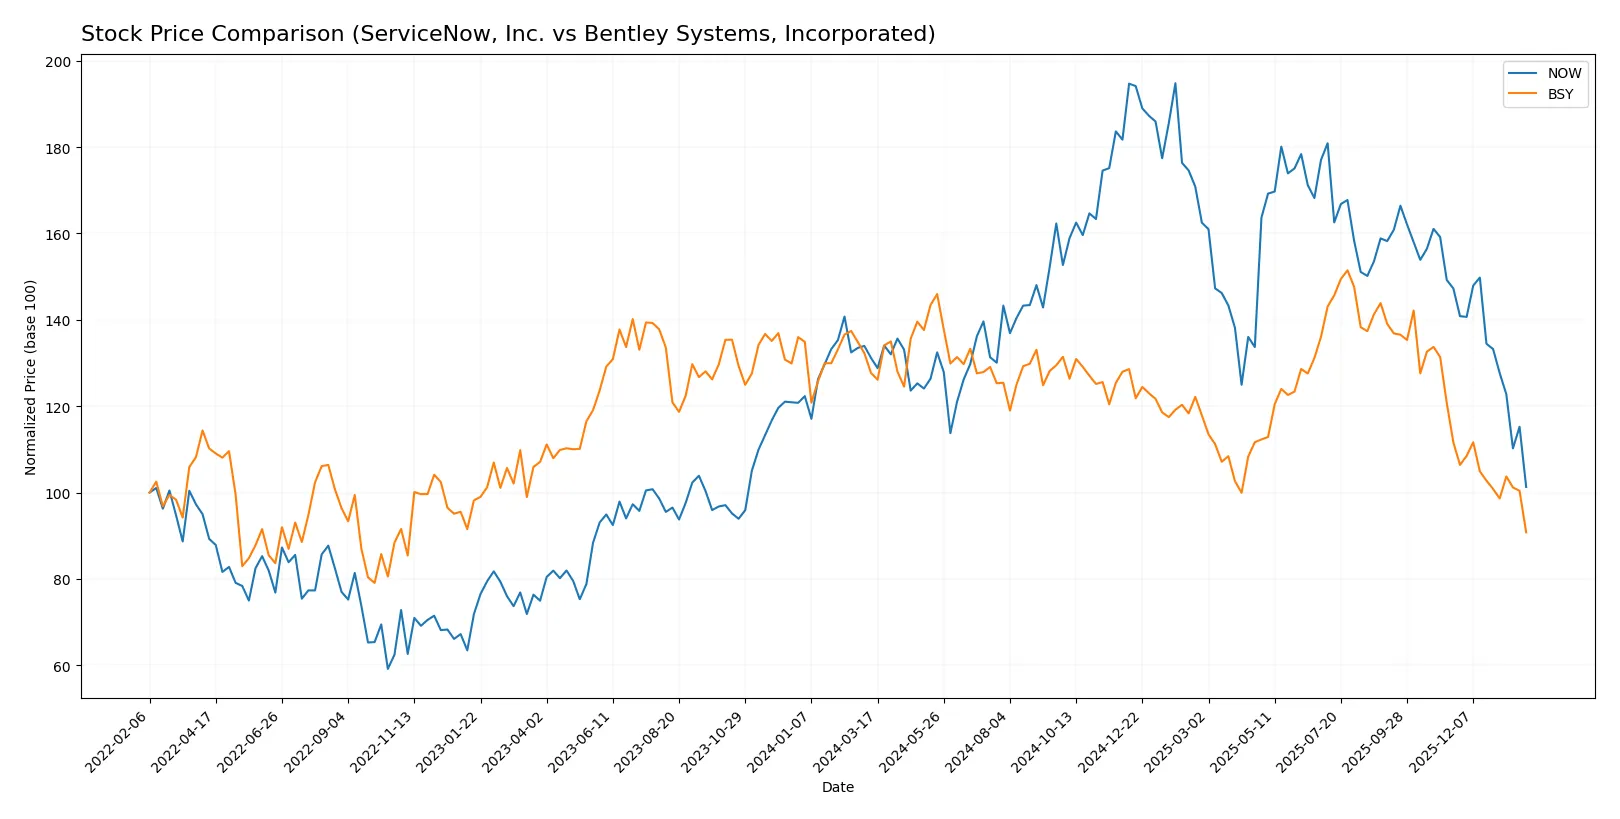
Trend Comparison
ServiceNow, Inc. (NOW) shows a bearish trend over the past 12 months with a -22.79% price change and decelerating decline. Volatility is high, evidenced by a 24.31 std deviation and a range from $117.01 to $225.00.
Bentley Systems, Inc. (BSY) also exhibits a bearish trend, losing -28.91% over the same period, with decelerating momentum. Volatility remains low at a 4.89 std deviation, with prices fluctuating between $35.12 and $58.59.
Comparing both, NOW’s decline is less severe than BSY’s, delivering the higher market performance despite elevated volatility.
Target Prices
Analysts show a wide range of expectations for ServiceNow, Inc. and Bentley Systems, Incorporated.
| Company | Target Low | Target High | Consensus |
|---|---|---|---|
| ServiceNow, Inc. | 115 | 1,315 | 440.14 |
| Bentley Systems, Inc. | 45 | 55 | 49.33 |
ServiceNow’s target consensus at 440.14 far exceeds its current 117 price, indicating bullish expectations despite the wide target range. Bentley Systems’ consensus of 49.33 also suggests upside potential from its current 35.12 price, reflecting moderate analyst optimism.

Don’t Let Luck Decide Your Entry Point
Optimize your entry points with our advanced ProRealTime indicators. You’ll get efficient buy signals with precise price targets for maximum performance. Start outperforming now!
How do institutions grade them?
Here are the recent institutional grades for ServiceNow, Inc. and Bentley Systems, Incorporated:
ServiceNow, Inc. Grades
The following table summarizes recent grades from major financial institutions for ServiceNow, Inc.:
| Grading Company | Action | New Grade | Date |
|---|---|---|---|
| Citigroup | Maintain | Buy | 2026-01-30 |
| BTIG | Maintain | Buy | 2026-01-29 |
| Stifel | Maintain | Buy | 2026-01-29 |
| RBC Capital | Maintain | Outperform | 2026-01-29 |
| Macquarie | Maintain | Neutral | 2026-01-29 |
| DA Davidson | Maintain | Buy | 2026-01-29 |
| Needham | Maintain | Buy | 2026-01-29 |
| Keybanc | Maintain | Underweight | 2026-01-29 |
| Evercore ISI Group | Maintain | Outperform | 2026-01-29 |
| Cantor Fitzgerald | Maintain | Overweight | 2026-01-29 |
Bentley Systems, Incorporated Grades
The following table summarizes recent grades from major financial institutions for Bentley Systems, Incorporated:
| Grading Company | Action | New Grade | Date |
|---|---|---|---|
| Oppenheimer | Maintain | Outperform | 2026-01-20 |
| Piper Sandler | Downgrade | Neutral | 2026-01-13 |
| Barclays | Maintain | Equal Weight | 2026-01-12 |
| RBC Capital | Maintain | Outperform | 2026-01-05 |
| JP Morgan | Maintain | Neutral | 2025-11-06 |
| Rosenblatt | Maintain | Buy | 2025-11-06 |
| Baird | Maintain | Outperform | 2025-11-06 |
| Piper Sandler | Maintain | Overweight | 2025-11-06 |
| Rosenblatt | Upgrade | Buy | 2025-10-17 |
| Oppenheimer | Maintain | Outperform | 2025-08-07 |
Which company has the best grades?
ServiceNow, Inc. holds consistently strong buy and outperform ratings from several firms, showing broad institutional confidence. Bentley Systems exhibits a mix of outperform and neutral grades, including a recent downgrade. This spread suggests ServiceNow currently enjoys higher institutional enthusiasm, which may influence investor sentiment and perceived momentum.
Risks specific to each company
The following categories identify the critical pressure points and systemic threats facing both firms in the 2026 market environment:
1. Market & Competition
ServiceNow, Inc.
- Faces intense competition in enterprise cloud software, requiring constant innovation to maintain market share.
Bentley Systems, Incorporated
- Competes in niche infrastructure engineering software with specialized applications, but faces pressure from larger software suites.
2. Capital Structure & Debt
ServiceNow, Inc.
- Maintains a low debt-to-equity ratio (0.25), indicating financial prudence and flexibility.
Bentley Systems, Incorporated
- Exhibits high leverage with a debt-to-equity ratio of 1.37, posing increased financial risk.
3. Stock Volatility
ServiceNow, Inc.
- Beta near 1 (0.979) suggests stock moves closely with the market, implying moderate volatility.
Bentley Systems, Incorporated
- Beta above 1 (1.214) indicates higher volatility and greater sensitivity to market swings.
4. Regulatory & Legal
ServiceNow, Inc.
- Subject to data privacy and cybersecurity regulations impacting cloud services globally.
Bentley Systems, Incorporated
- Faces compliance demands across multiple regions, especially in infrastructure and construction sectors.
5. Supply Chain & Operations
ServiceNow, Inc.
- Operates predominantly software-based services, with minimal supply chain risks.
Bentley Systems, Incorporated
- Relies on continuous software development and integration, vulnerable to tech talent shortages.
6. ESG & Climate Transition
ServiceNow, Inc.
- Increasing pressure to demonstrate sustainability in data centers and cloud operations.
Bentley Systems, Incorporated
- Positioned to benefit from infrastructure projects focused on climate adaptation and green energy.
7. Geopolitical Exposure
ServiceNow, Inc.
- Global client base exposes it to risks from US-China tensions and data sovereignty laws.
Bentley Systems, Incorporated
- Operates worldwide, with potential disruptions from regional infrastructure funding and trade policies.
Which company shows a better risk-adjusted profile?
ServiceNow’s strongest risk factor is its high valuation multiples combined with a current ratio below 1, signaling liquidity risks despite robust market positioning. Bentley’s key risk is its leveraged capital structure that raises financial vulnerability amid market volatility. Between them, ServiceNow presents a better risk-adjusted profile, supported by its safer debt levels and Altman Z-Score well inside the safe zone (6.6 vs. Bentley’s 3.5). However, Bentley’s very strong Piotroski score (9) signals excellent financial health, offsetting some leverage concerns. The stark contrast in debt-to-equity ratios justifies my caution on Bentley’s balance sheet risk.
Final Verdict: Which stock to choose?
ServiceNow, Inc. (NOW) shines as a cash machine with impressive revenue growth and expanding profitability, reflecting a business scaling efficiently. Its main point of vigilance lies in a stretched valuation and a current ratio below 1, signaling liquidity caution. NOW suits an aggressive growth portfolio focused on market leadership and innovation.
Bentley Systems, Incorporated (BSY) boasts a strategic moat rooted in its specialized software niche and recurring revenue streams. Compared to NOW, it offers better interest coverage but carries heavier debt and weaker liquidity, suggesting a more leveraged risk profile. BSY fits a GARP (Growth at a Reasonable Price) portfolio seeking steady cash flow with moderate growth.
If you prioritize rapid expansion and market dominance, NOW is the compelling choice due to its accelerating profitability despite elevated multiples. However, if you seek more stability with a defined niche moat and consistent returns, BSY offers better resilience albeit with financial leverage risks. Each presents a distinct investment scenario shaped by risk tolerance and growth expectations.
Disclaimer: Investment carries a risk of loss of initial capital. The past performance is not a reliable indicator of future results. Be sure to understand risks before making an investment decision.
Go Further
I encourage you to read the complete analyses of ServiceNow, Inc. and Bentley Systems, Incorporated to enhance your investment decisions: