Home > Analyses > Technology > QUALCOMM Incorporated
QUALCOMM Incorporated powers the backbone of modern wireless communication, enabling billions to connect seamlessly through its cutting-edge semiconductor technologies. As a dominant force in the semiconductor industry, QUALCOMM’s flagship products and patented innovations drive advances in 3G, 4G, and 5G networks worldwide. Renowned for its market influence and continuous innovation, the company stands at a critical juncture—do its core strengths and growth prospects still justify its premium valuation in an evolving tech landscape?

Table of contents
Business Model & Company Overview
QUALCOMM Incorporated, founded in 1985 and headquartered in San Diego, CA, stands as a dominant player in the semiconductors industry. Its core mission revolves around developing and commercializing foundational wireless technologies, integrating 3G to 5G standards into a cohesive ecosystem of integrated circuits, system software, and licensing. This synergy fuels innovations across voice, data communications, multimedia, and global positioning systems, positioning QUALCOMM at the forefront of wireless advancement.
The company’s revenue engine balances hardware sales through Qualcomm CDMA Technologies (QCT) with robust, recurring income from Qualcomm Technology Licensing (QTL). By licensing its extensive intellectual property portfolio worldwide, QUALCOMM secures a strategic footprint across the Americas, Europe, and Asia. Its Qualcomm Strategic Initiatives (QSI) segment further drives growth by investing in emerging tech sectors like AI and IoT. This multi-segment approach builds a formidable economic moat that underpins QUALCOMM’s enduring industry influence.
Financial Performance & Fundamental Metrics
In this section, I analyze QUALCOMM Incorporated’s income statement, key financial ratios, and dividend payout policy to assess its overall financial health and investment potential.
Income Statement
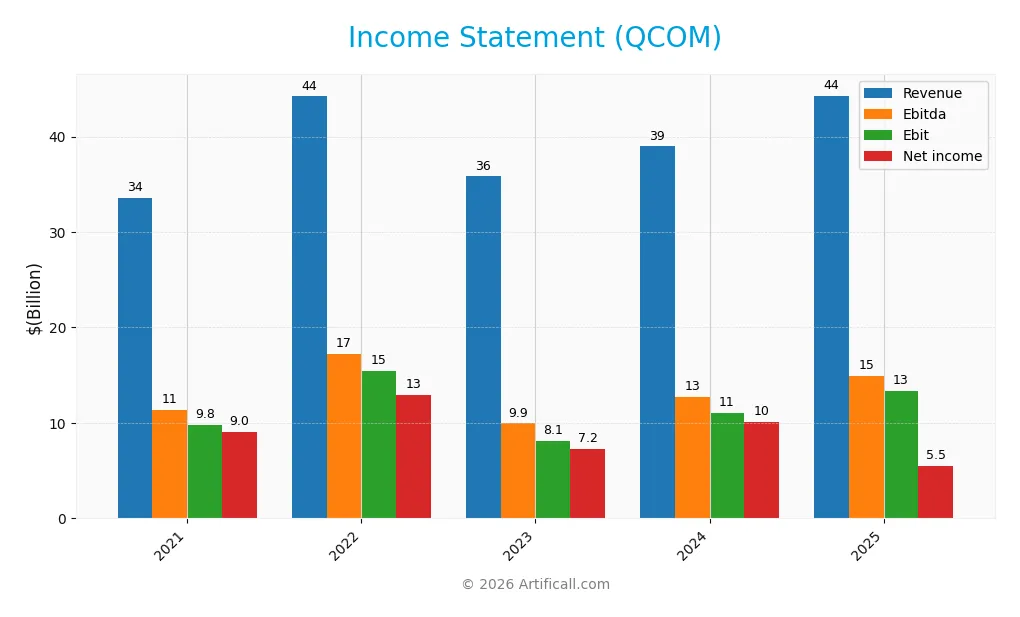
The table below summarizes QUALCOMM Incorporated’s key income statement figures for fiscal years 2021 through 2025, expressed in USD.
| 2021 | 2022 | 2023 | 2024 | 2025 | |
|---|---|---|---|---|---|
| Revenue | 33.6B | 44.2B | 35.8B | 38.9B | 44.3B |
| Cost of Revenue | 14.3B | 18.6B | 15.9B | 17.1B | 19.7B |
| Operating Expenses | 9.5B | 9.7B | 12.2B | 11.8B | 12.2B |
| Gross Profit | 19.3B | 25.6B | 19.9B | 21.9B | 24.5B |
| EBITDA | 11.4B | 17.3B | 9.9B | 12.7B | 14.9B |
| EBIT | 9.8B | 15.5B | 8.1B | 11.0B | 13.3B |
| Interest Expense | 559M | 490M | 694M | 697M | 664M |
| Net Income | 9.0B | 12.9B | 7.2B | 10.1B | 5.5B |
| EPS | 8.00 | 11.52 | 6.47 | 9.09 | 5.06 |
| Filing Date | 2021-11-03 | 2022-11-02 | 2023-11-01 | 2024-11-06 | 2025-11-05 |
Income Statement Evolution
Between 2021 and 2025, QUALCOMM’s revenue increased by 31.93%, showing solid top-line growth. However, net income declined by 38.73% over the same period, reflecting a contraction in net margins by 53.56%. Gross and EBIT margins remained favorable at 55.43% and 30.09%, respectively, indicating consistent operational efficiency despite net income pressures.
Is the Income Statement Favorable?
In fiscal 2025, revenue rose 13.66% year-over-year to $44.3B, with gross profit and EBIT growing 12.07% and 20.79%, respectively, supporting strong operating performance. Yet net income fell 51.93% to $5.5B, dragging net margin down to 12.51%. Despite margin compression and EPS decline, the overall income statement evaluation is favorable, supported by controlled interest expense and solid operating metrics.
Financial Ratios
The following table presents key financial ratios for QUALCOMM Incorporated (QCOM) over recent fiscal years to assist in evaluating its performance and financial health:
| Ratios | 2021 | 2022 | 2023 | 2024 | 2025 |
|---|---|---|---|---|---|
| Net Margin | 27% | 29% | 20% | 26% | 13% |
| ROE | 91% | 72% | 34% | 39% | 26% |
| ROIC | 27% | 35% | 18% | 21% | 13% |
| P/E | 16.1 | 9.8 | 17.2 | 18.7 | 32.7 |
| P/B | 14.7 | 7.0 | 5.7 | 7.2 | 8.5 |
| Current Ratio | 1.68 | 1.75 | 2.33 | 2.40 | 2.82 |
| Quick Ratio | 1.41 | 1.15 | 1.67 | 1.79 | 2.10 |
| D/E | 1.64 | 0.90 | 0.74 | 0.59 | 0.70 |
| Debt-to-Assets | 40% | 33% | 31% | 28% | 30% |
| Interest Coverage | 17.5 | 32.4 | 11.2 | 14.4 | 18.6 |
| Asset Turnover | 0.81 | 0.90 | 0.70 | 0.71 | 0.88 |
| Fixed Asset Turnover | 7.36 | 8.55 | 7.10 | 8.35 | 9.44 |
| Dividend Yield | 2.1% | 2.5% | 2.8% | 1.9% | 2.1% |
All values are rounded and expressed in compact numeric or percentage format for clarity.
Evolution of Financial Ratios
From 2021 to 2025, QUALCOMM’s Return on Equity (ROE) showed a downward trend from 90.88% in 2021 to 26.13% in 2025, reflecting a notable decline in profitability. The Current Ratio steadily improved, rising from 1.68 to 2.82, indicating enhanced short-term liquidity. The Debt-to-Equity Ratio decreased from 1.64 to 0.70, suggesting reduced leverage and a more conservative capital structure over the period.
Are the Financial Ratios Fovorable?
In 2025, profitability ratios such as net margin (12.51%) and ROE (26.13%) are favorable, while the price-to-earnings (32.7) and price-to-book (8.54) ratios are unfavorable, indicating elevated market valuation. Liquidity appears strong with a current ratio of 2.82 and a quick ratio of 2.1, both favorable. Debt metrics, including a debt-to-assets ratio of 29.54% and interest coverage of 20.07, are mostly favorable. Overall, 64.29% of key ratios are favorable, supporting a generally positive financial profile.
Shareholder Return Policy
QUALCOMM has consistently paid dividends with a payout ratio rising from 33% in 2021 to nearly 69% in 2025, alongside a dividend yield around 2.1% in 2025. Dividend payments appear well covered by free cash flow, supporting sustainable distributions. The company also engages in share buybacks, complementing its dividend returns.
The increasing payout ratio combined with steady dividend growth suggests a balancing act between rewarding shareholders and retaining capital. Coverage by operating and free cash flow ratios indicates prudent risk management, while continued buybacks signal a commitment to shareholder value. This policy supports sustainable long-term value creation without evident overextension.
Score analysis
The following radar chart presents an overview of QUALCOMM Incorporated’s key financial scores to facilitate a comprehensive evaluation:
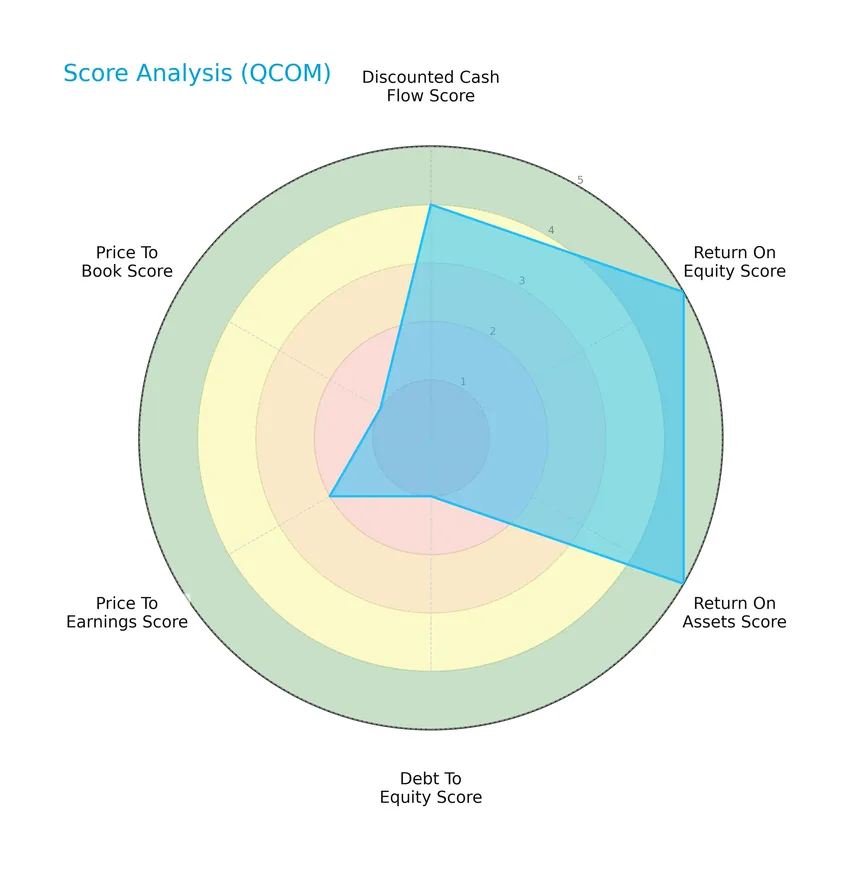
QUALCOMM shows strong profitability with very favorable return on equity and assets scores of 5 each. The discounted cash flow score is favorable at 4, but leverage and valuation metrics are weak, with debt-to-equity and price-to-book scores at 1 and price-to-earnings at 2, indicating potential concerns in capital structure and market pricing.
Analysis of the company’s bankruptcy risk
QUALCOMM’s Altman Z-Score places it well within the safe zone, suggesting a low risk of bankruptcy and solid financial stability:

Is the company in good financial health?
The Piotroski Score diagram provides insights into QUALCOMM’s financial strength and operational efficiency:

With a strong Piotroski score of 7, QUALCOMM demonstrates solid financial health, reflecting sound profitability, effective asset management, and prudent leverage compared to lower scoring peers.
Competitive Landscape & Sector Positioning
This sector analysis will review QUALCOMM Incorporated’s strategic positioning, revenue segments, key products, main competitors, competitive advantages, and SWOT factors. I will assess whether QUALCOMM holds a competitive advantage over its peers in the semiconductor and wireless technology industry.
Strategic Positioning
QUALCOMM operates a concentrated portfolio focused on semiconductor technologies, primarily through its QCT segment (over $38B in 2025) and QTL licensing segment (around $5.6B). Geographically, it is heavily exposed to China, generating approximately $22.4B in 2023, with additional significant revenues from Korea, Vietnam, and the US.
Revenue by Segment
This pie chart illustrates QUALCOMM Incorporated’s revenue distribution by segment for the fiscal year 2025, highlighting the business drivers across its main product lines.
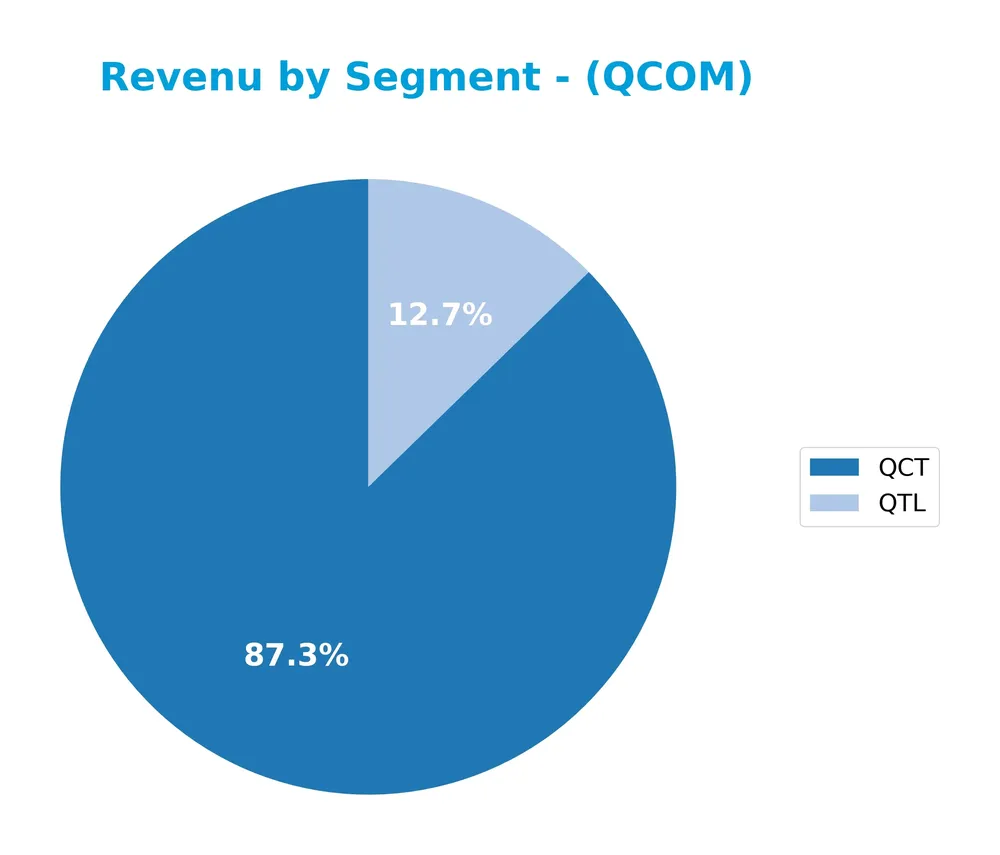
In 2025, the QCT segment remains the dominant revenue contributor at $38.4B, showing strong growth from $33.2B in 2024. The QTL segment maintains a steady revenue stream of $5.6B, consistent with prior years. Notably, QSI revenue fell below the reporting threshold in 2025, indicating a possible shift or consolidation. Overall, QUALCOMM’s revenue concentration in QCT highlights its reliance on chipset technology, with steady licensing income supporting a balanced portfolio.
Key Products & Brands
The table below presents QUALCOMM Incorporated’s main products and brands along with their descriptions:
| Product | Description |
|---|---|
| Qualcomm CDMA Technologies (QCT) | Develops and supplies integrated circuits and system software based on 3G/4G/5G and other wireless communication technologies. |
| Qualcomm Technology Licensing (QTL) | Grants licenses or rights to use portions of its intellectual property portfolio, including patents for CDMA2000, WCDMA, LTE, and 5G standards. |
| Qualcomm Strategic Initiatives (QSI) | Invests in early-stage companies across industries like 5G, AI, automotive, cloud, and IoT, supporting new products and services development. |
QUALCOMM’s product portfolio focuses on wireless communication technologies through its QCT and QTL segments, complemented by strategic investments via QSI to foster innovation and new industry applications.
Main Competitors
There are 38 competitors in the semiconductors industry, with the table below listing the top 10 leaders by market capitalization:
| Competitor | Market Cap. |
|---|---|
| NVIDIA Corporation | 4.6T |
| Broadcom Inc. | 1.6T |
| Taiwan Semiconductor Manufacturing Company Limited | 1.6T |
| ASML Holding N.V. | 415B |
| Advanced Micro Devices, Inc. | 363B |
| Micron Technology, Inc. | 353B |
| Lam Research Corporation | 232B |
| Applied Materials, Inc. | 214B |
| QUALCOMM Incorporated | 185B |
| Intel Corporation | 173B |
QUALCOMM Incorporated ranks 9th among 38 competitors by market capitalization in the semiconductor sector. Its market cap is 3.63% of the leader NVIDIA Corporation. QUALCOMM is positioned below the top 10 average market cap of 975B but remains above the sector median of 31B. It maintains a 28.35% market cap gap from its closest competitor above, Applied Materials.
Comparisons with competitors
Check out how we compare the company to its competitors:
Does QCOM have a competitive advantage?
QUALCOMM Incorporated presents a competitive advantage as it consistently creates value with a ROIC exceeding its WACC by 4.1%, supported by favorable gross and EBIT margins above 30%. However, the company faces a declining ROIC trend and shrinking net margin, indicating some erosion in profitability.
Looking ahead, QUALCOMM’s diversified segments in 3G/4G/5G technologies, licensing, and strategic investments in AI, automotive, and IoT offer potential growth avenues. Continued innovation and expansion into emerging markets may provide opportunities to sustain its competitive position despite current margin pressures.
SWOT Analysis
This SWOT analysis highlights QUALCOMM Incorporated’s key internal strengths and weaknesses alongside external opportunities and threats, guiding strategic investment decisions.
Strengths
- strong market position in wireless technology
- robust gross margin at 55%
- diversified revenue streams including licensing and early-stage investments
Weaknesses
- declining net margin and EPS over recent years
- high valuation multiples (PE 32.7, PB 8.54)
- moderate debt management concerns
Opportunities
- growth in 5G and AI-driven markets
- expansion in automotive and IoT sectors
- increasing demand for semiconductor solutions globally
Threats
- geopolitical risks impacting key markets like China
- intense competition in semiconductor industry
- regulatory challenges on licensing and patents
QUALCOMM’s strengths in technology and market presence provide a solid foundation, but profitability pressures and valuation risks warrant caution. Capitalizing on emerging tech trends while managing geopolitical and competitive threats is crucial for sustained growth.
Stock Price Action Analysis
The following weekly stock chart illustrates QUALCOMM Incorporated’s price movements over the analyzed 12-month period:
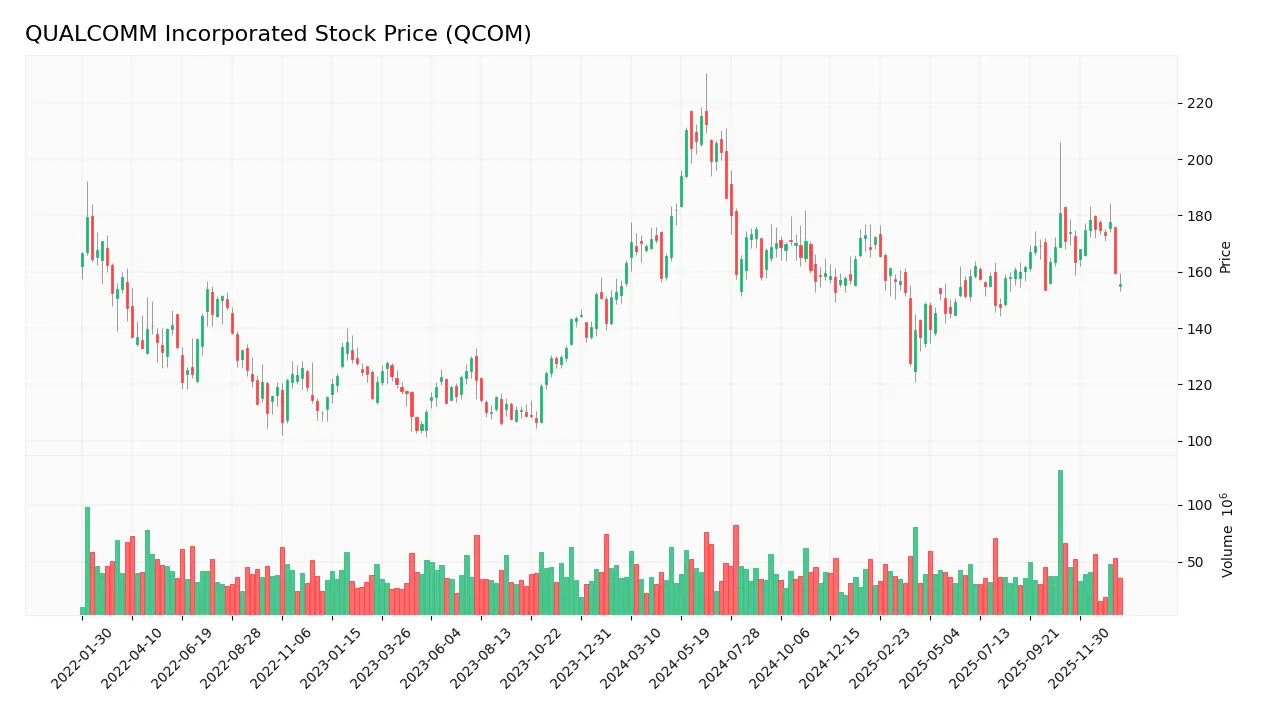
Trend Analysis
Over the past 12 months, QCOM’s stock price declined by 4.46%, indicating a bearish trend. The price showed deceleration in its downward movement, with notable price extremes at a high of 215.33 and a low of 127.46. Volatility remains elevated, reflected in a standard deviation of 16.09.
Volume Analysis
In the last three months, trading volume has been decreasing overall, with a total buyer volume below seller volume, indicating slight seller dominance at 40.81%. This suggests cautious or reduced market participation, with investor sentiment leaning mildly bearish during the recent period.
Target Prices
The target price consensus for QUALCOMM Incorporated reflects a moderately optimistic outlook among analysts.
| Target High | Target Low | Consensus |
|---|---|---|
| 210 | 165 | 185.71 |
Analysts expect QUALCOMM’s stock to trade between $165 and $210, with a consensus target around $186, indicating potential upside from current levels.

Don’t Let Luck Decide Your Entry Point
Optimize your entry points with our advanced ProRealTime indicators. You’ll get efficient buy signals with precise price targets for maximum performance. Start outperforming now!
Analyst & Consumer Opinions
This section reviews the latest analyst ratings and consumer feedback regarding QUALCOMM Incorporated’s performance and market perception.
Stock Grades
Here is a detailed overview of recent stock grades assigned to QUALCOMM Incorporated by recognized analysts and firms:
| Grading Company | Action | New Grade | Date |
|---|---|---|---|
| Mizuho | Downgrade | Neutral | 2026-01-09 |
| Rosenblatt | Maintain | Buy | 2025-11-06 |
| B of A Securities | Maintain | Buy | 2025-11-06 |
| UBS | Maintain | Neutral | 2025-11-06 |
| Piper Sandler | Maintain | Overweight | 2025-11-06 |
| Mizuho | Maintain | Outperform | 2025-11-06 |
| Wells Fargo | Maintain | Underweight | 2025-11-06 |
| JP Morgan | Maintain | Overweight | 2025-11-04 |
| Citigroup | Maintain | Neutral | 2025-10-28 |
| Rosenblatt | Maintain | Buy | 2025-10-28 |
The grades reveal a mixed sentiment, with several firms maintaining buy or overweight ratings, yet Mizuho’s recent downgrade to neutral signals some caution. Overall consensus remains a buy, reflecting moderate confidence among analysts.
Consumer Opinions
Consumers have mixed but generally favorable views on QUALCOMM Incorporated, reflecting both satisfaction with innovation and concerns about pricing and product availability.
| Positive Reviews | Negative Reviews |
|---|---|
| “QUALCOMM’s chipsets offer excellent performance and reliability.” | “Some products are priced higher than competitors’ alternatives.” |
| “Strong support for 5G technology and future-proof solutions.” | “Occasional delays in product availability have been frustrating.” |
| “Consistent updates and good customer service experience.” | “Compatibility issues with certain devices were encountered.” |
Overall, consumers appreciate QUALCOMM’s technological leadership and product quality but express concerns regarding cost and supply delays, indicating room for improvement in accessibility and pricing strategies.
Risk Analysis
The table below summarizes the main risks associated with investing in QUALCOMM Incorporated, highlighting their likelihood and potential impact:
| Category | Description | Probability | Impact |
|---|---|---|---|
| Market Risk | Exposure to semiconductor industry cyclicality and overall tech market volatility | High | High |
| Valuation Risk | Elevated P/E (32.7) and P/B (8.54) ratios suggest potential overvaluation | Medium | Medium |
| Competitive Risk | Intense competition in 5G technology and licensing could pressure margins and market share | Medium | High |
| Regulatory Risk | Possible changes in patent laws and international trade policies affecting licensing revenue | Medium | Medium |
| Debt Risk | Moderate debt-to-equity ratio with unfavorable debt score could affect financial flexibility | Low | Medium |
| Innovation Risk | Dependence on successful development of new technologies like AI and IoT | Medium | High |
The most significant risks for QUALCOMM lie in market cyclicality and competitive pressures in its core semiconductor and licensing segments. Despite a strong Altman Z-Score placing the company in a safe financial zone, valuation concerns and evolving industry dynamics warrant cautious monitoring.
Should You Buy QUALCOMM Incorporated?
QUALCOMM appears to be generating robust profitability and strong value creation, supported by a slightly favorable competitive moat despite a declining ROIC trend. Its leverage profile could be seen as manageable, though some debt-related scores remain unfavorable, leading to an overall B+ rating.
Strength & Efficiency Pillars
QUALCOMM Incorporated exhibits robust profitability and financial health, underscored by a net margin of 12.51%, return on equity (ROE) of 26.13%, and return on invested capital (ROIC) of 13.19%. Importantly, its ROIC substantially exceeds the weighted average cost of capital (WACC) of 9.1%, confirming the company as a clear value creator. The Altman Z-Score of 6.22 places QUALCOMM well within the safe zone, signaling excellent bankruptcy resilience. Coupled with a strong Piotroski Score of 7, the firm demonstrates solid operational strength and prudent financial management.
Weaknesses and Drawbacks
Despite strong fundamentals, QUALCOMM faces valuation and leverage concerns. The price-to-earnings ratio stands at 32.7 and price-to-book at 8.54, both marked unfavorable, indicating a premium valuation that may limit upside. While the debt-to-equity ratio is moderate at 0.7, the company’s recent bearish price trend, with an 8.82% decline since November 2025 and a slightly seller-dominant market behavior at 40.81% buyer dominance, suggests short-term pressure. These factors introduce potential volatility and caution for near-term investors.
Our Verdict about QUALCOMM Incorporated
QUALCOMM’s long-term fundamental profile is favorable, supported by strong profitability and financial health. However, the recent bearish technical trend combined with moderate seller dominance might suggest a wait-and-see approach for a better entry point. The company’s premium valuation and short-term market pressures may temper immediate enthusiasm, although its underlying value creation remains compelling for patient investors.
Disclaimer: This content is for informational purposes only and does not constitute financial, investment, or other professional advice. Investing in financial markets involves a significant risk of loss, and past performance is not indicative of future results.
Additional Resources
- Mn Services Vermogensbeheer B.V. Increases Stock Holdings in QUALCOMM Incorporated $QCOM – MarketBeat (Jan 24, 2026)
- Is QUALCOMM (QCOM) One of the Best 5G Stocks to Invest In? – Finviz (Jan 25, 2026)
- Qualcomm Looks Cheap: The Next Guidance Could Make It Way Cheaper (NASDAQ:QCOM) – Seeking Alpha (Jan 20, 2026)
- Y Intercept Hong Kong Ltd Decreases Position in QUALCOMM Incorporated $QCOM – MarketBeat (Jan 24, 2026)
- Qualcomm heading towards seventh straight session of losses – Seeking Alpha (Jan 20, 2026)
For more information about QUALCOMM Incorporated, please visit the official website: qualcomm.com