Strategies, Indicators & Screeners for Prorealtime
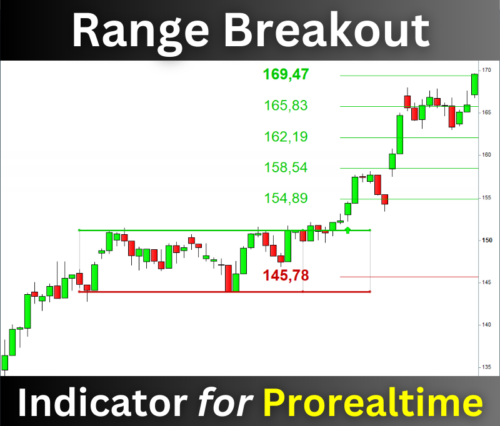
The Range Breaker indicator detects the range breakouts on the Prorealtime platform.
✅ It displays the ranges, signals, and target prices on your chart.
✅ The associated screener will allow you to find opportunities in real time.
You will never miss a breakout again!
Hello and welcome to Artificall. 😀
My name is Vivien. I’m a trader and software developer. I’ve been programming indicators and screeners for over seven years on the Prorealtime platform.
I share my knowledge in the learning section. You’ll discover trading strategies and tips for success.
I created indicators and screeners to help you seize the best market opportunities. They will give you buy and sell signals with exit conditions.
➡️ You’ll have everything you need to trade all types of markets. 😉
Discover Profitable Strategies for Prorealtime
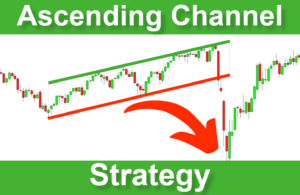
Finding a profitable trading strategy is challenging. It requires a lot of work. However, it is the key to your success. I regularly publish articles on strategies that I consider profitable enough. This will help you find the right one for you:
I wrote this book to help you design your trading system using Prorealtime
As a first step, I provide you with the theoretical and conceptual basis you need to develop trading algorithms. Then, step-by-step, I will lead you in programming your trading bot. After that, a chapter about the backtest analysis will explain how to reduce the risk of overfitting.
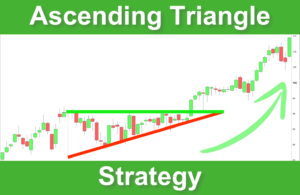
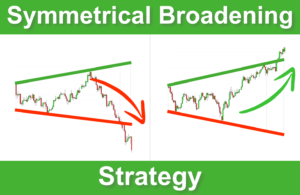
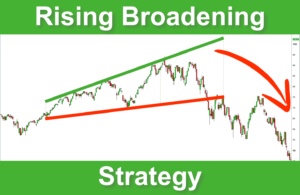
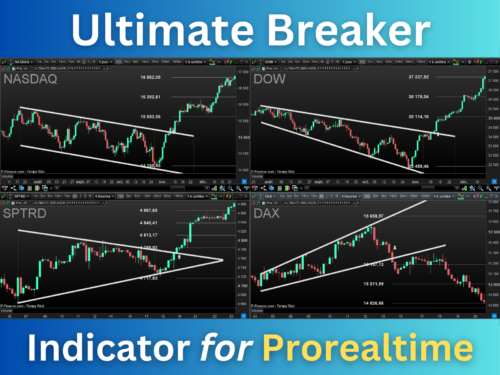
The Ultimate Breaker will help you trade the most profitable patterns. It detects the breakouts of the best figures, often followed by explosive price movements.
The indicator displays signals, targets, and stoploss. It works with all the assets in any time unit.
We use cookies on our website to give you the most relevant experience by remembering your preferences and repeat visits. By clicking “Accept”, you consent to the use of ALL the cookies.
This website uses cookies to improve your experience while you navigate through the website. Out of these, the cookies that are categorized as necessary are stored on your browser as they are essential for the working of basic functionalities of the ...
Necessary cookies are absolutely essential for the website to function properly. These cookies ensure basic functionalities and security features of the website, anonymously.
Cookie
Duration
Description
cookielawinfo-checkbox-analytics
11 months
This cookie is set by GDPR Cookie Consent plugin. The cookie is used to store the user consent for the cookies in the category "Analytics".
cookielawinfo-checkbox-functional
11 months
The cookie is set by GDPR cookie consent to record the user consent for the cookies in the category "Functional".
cookielawinfo-checkbox-necessary
11 months
This cookie is set by GDPR Cookie Consent plugin. The cookies is used to store the user consent for the cookies in the category "Necessary".
cookielawinfo-checkbox-others
11 months
This cookie is set by GDPR Cookie Consent plugin. The cookie is used to store the user consent for the cookies in the category "Other.
cookielawinfo-checkbox-performance
11 months
This cookie is set by GDPR Cookie Consent plugin. The cookie is used to store the user consent for the cookies in the category "Performance".
viewed_cookie_policy
11 months
The cookie is set by the GDPR Cookie Consent plugin and is used to store whether or not user has consented to the use of cookies. It does not store any personal data.
Functional cookies help to perform certain functionalities like sharing the content of the website on social media platforms, collect feedbacks, and other third-party features.
Performance cookies are used to understand and analyze the key performance indexes of the website which helps in delivering a better user experience for the visitors.
Analytical cookies are used to understand how visitors interact with the website. These cookies help provide information on metrics the number of visitors, bounce rate, traffic source, etc.
Advertisement cookies are used to provide visitors with relevant ads and marketing campaigns. These cookies track visitors across websites and collect information to provide customized ads.