NVIDIA Corporation and QUALCOMM Incorporated stand as two titans within the semiconductor industry, each driving innovation in overlapping markets like AI, wireless communication, and advanced computing. NVIDIA’s focus on graphics, data centers, and automotive AI contrasts with QUALCOMM’s leadership in wireless technologies and intellectual property licensing. This comparison aims to uncover which company presents a more compelling investment opportunity for savvy investors seeking growth and stability in tech innovation.
Table of contents
Companies Overview
I will begin the comparison between NVIDIA and QUALCOMM by providing an overview of these two companies and their main differences.
NVIDIA Overview
NVIDIA Corporation, headquartered in Santa Clara, California, focuses on providing advanced graphics, compute, and networking solutions globally. Its product portfolio spans gaming GPUs, enterprise workstation graphics, cloud-based computing software, automotive infotainment platforms, and AI-driven automotive solutions. NVIDIA operates across gaming, professional visualization, data center, and automotive markets, serving a diverse range of customers, from OEMs to cloud providers.
QUALCOMM Overview
QUALCOMM Incorporated, based in San Diego, California, specializes in foundational wireless technologies. The company develops integrated circuits and system software for 3G to 5G communications, licenses intellectual property for wireless standards, and invests in early-stage technology ventures. It operates through segments focused on chipsets, technology licensing, and strategic initiatives, serving global wireless industry needs and government agencies.
Key similarities and differences
Both NVIDIA and QUALCOMM operate in the semiconductor industry and serve technology-driven markets, but differ in focus. NVIDIA emphasizes graphics, AI, and computing solutions across gaming and automotive sectors, while QUALCOMM centers on wireless communication technologies and intellectual property licensing. Each company diversifies through software and investments, yet their core markets and product applications remain distinct.
Income Statement Comparison
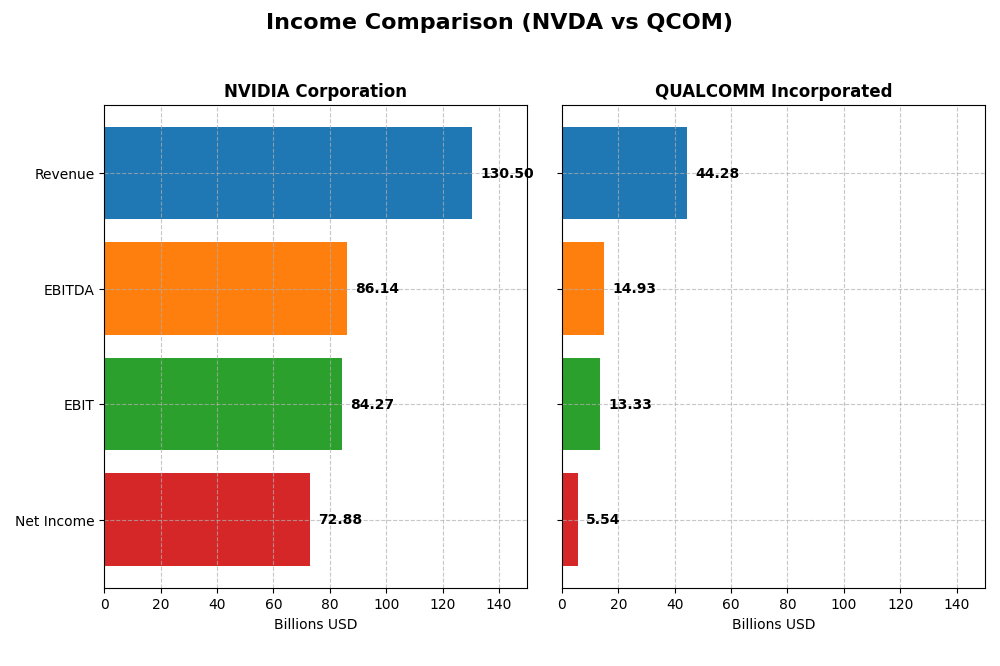
The table below compares the most recent fiscal year income statement metrics for NVIDIA Corporation and QUALCOMM Incorporated, providing a side-by-side view of key financial figures.
| Metric | NVIDIA Corporation | QUALCOMM Incorporated |
|---|---|---|
| Market Cap | 4.6T | 185B |
| Revenue | 130.5B | 44.3B |
| EBITDA | 86.1B | 14.9B |
| EBIT | 84.3B | 13.3B |
| Net Income | 72.9B | 5.5B |
| EPS | 2.97 | 5.06 |
| Fiscal Year | 2025 | 2025 |
Income Statement Interpretations
NVIDIA Corporation
NVIDIA’s revenue and net income have shown remarkable growth from 2021 to 2025, with revenue soaring from $16.7B to $130.5B and net income rising from $4.3B to $72.9B. Margins have improved significantly, with a gross margin near 75% and net margin above 55% in 2025. The latest year saw exceptional growth rates, with revenue more than doubling and net margin expanding further.
QUALCOMM Incorporated
QUALCOMM’s revenue grew steadily from $33.6B in 2021 to $44.3B in 2025, but net income declined from $9.0B to $5.5B over the same period. Margins remain favorable, with a gross margin of 55% and a net margin of 12.5% in 2025, though net margin and EPS contracted sharply in the most recent year. Operating income and revenue growth were positive, but net income faced headwinds.
Which one has the stronger fundamentals?
NVIDIA demonstrates stronger fundamentals with robust revenue and net income growth, high and expanding margins, and favorable expense management. QUALCOMM shows steady revenue gains but declining profitability and weaker net margin trends. Overall, NVIDIA’s income statement presents a consistently more favorable performance across key financial metrics.
Financial Ratios Comparison
Below is a comparison of key financial ratios for NVIDIA Corporation and QUALCOMM Incorporated based on the most recent fiscal year data available.
| Ratios | NVIDIA Corporation (FY 2025) | QUALCOMM Incorporated (FY 2025) |
|---|---|---|
| ROE | 91.87% | 26.13% |
| ROIC | 75.28% | 13.19% |
| P/E | 39.90 | 32.70 |
| P/B | 36.66 | 8.54 |
| Current Ratio | 4.44 | 2.82 |
| Quick Ratio | 3.88 | 2.10 |
| D/E (Debt to Equity) | 0.13 | 0.70 |
| Debt-to-Assets | 9.20% | 29.54% |
| Interest Coverage | 329.77 | 18.61 |
| Asset Turnover | 1.17 | 0.88 |
| Fixed Asset Turnover | 16.16 | 9.44 |
| Payout Ratio | 1.14% | 68.67% |
| Dividend Yield | 0.03% | 2.10% |
Interpretation of the Ratios
NVIDIA Corporation
NVIDIA shows strong profitability with a net margin of 55.85% and an impressive return on equity of 91.87%, indicating efficient use of equity capital. However, valuation metrics such as a high P/E of 39.9 and P/B of 36.66 are less favorable, suggesting a potentially overvalued stock. The company pays a minimal dividend yield of 0.03%, reflecting a cautious payout strategy amid strong free cash flow coverage.
QUALCOMM Incorporated
QUALCOMM exhibits solid financial health with a favorable net margin of 12.51% and a return on equity of 26.13%, indicating effective capital management. Its dividend yield of 2.1% is supported by healthy free cash flow, making it attractive for income investors. While some ratios like debt-to-equity are neutral, the overall profile shows a balanced approach to leverage and shareholder returns.
Which one has the best ratios?
Both NVIDIA and QUALCOMM present favorable overall ratios at 64.29%, but NVIDIA’s exceptional profitability and efficiency metrics contrast with QUALCOMM’s more moderate performance and higher dividend yield. NVIDIA’s valuation and liquidity ratios are less favorable, whereas QUALCOMM maintains better balance with fewer unfavorable marks, suggesting distinct strengths in their financial profiles.
Strategic Positioning
This section compares the strategic positioning of NVIDIA Corporation and QUALCOMM Incorporated, including market position, key segments, and exposure to technological disruption:
NVIDIA Corporation
- Leading semiconductor firm with strong competitive pressure in GPUs and AI data centers.
- Diverse segments: Data Center, Gaming, Automotive, Professional Visualization driving growth.
- Active in AI, HPC, cloud computing, automotive AI, and virtual worlds, showing strong tech disruption exposure.
QUALCOMM Incorporated
- Established semiconductor company facing moderate competitive pressure in wireless tech.
- Focused segments: QCT (chipsets), QTL (licensing), and QSI (investments in emerging tech).
- Concentrated on wireless technologies (3G/4G/5G), licensing patents, and emerging tech investments.
NVIDIA Corporation vs QUALCOMM Incorporated Positioning
NVIDIA has a diversified portfolio across data center, gaming, and automotive markets, benefiting from broad tech adoption. QUALCOMM maintains a more concentrated focus on wireless semiconductor technologies and IP licensing, with targeted investments in emerging sectors.
Which has the best competitive advantage?
NVIDIA displays a very favorable moat with high and growing ROIC, indicating durable competitive advantage and efficient capital use. QUALCOMM shows a slightly favorable moat with value creation but a declining profitability trend.
Stock Comparison
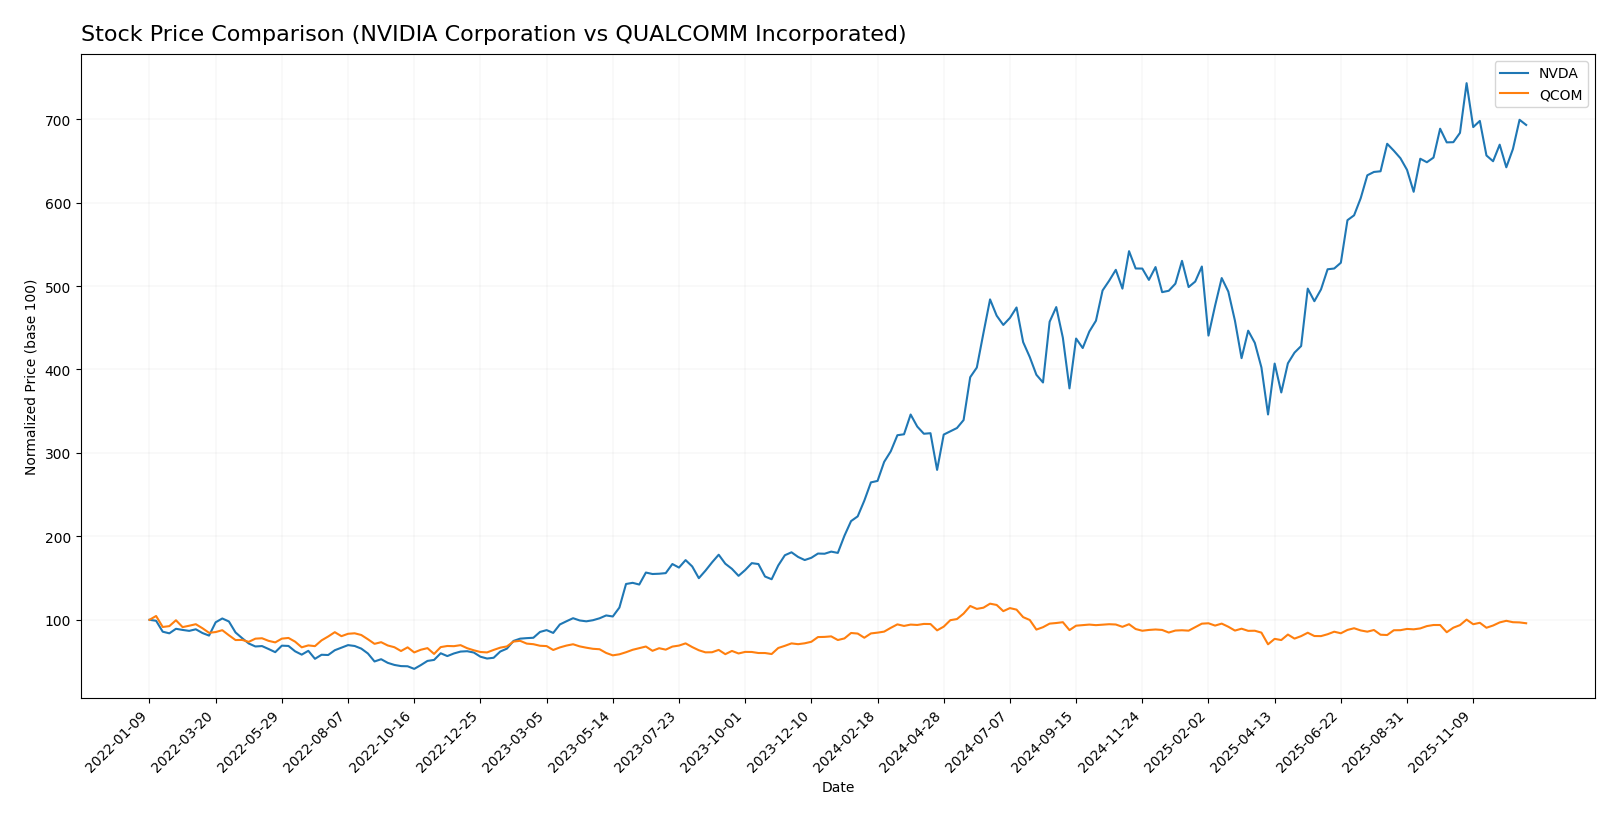
The stock price chart highlights significant bullish momentum for NVIDIA Corporation and QUALCOMM Incorporated over the past 12 months, with NVIDIA showing strong gains despite a recent deceleration and QUALCOMM accelerating steadily.
Trend Analysis
NVIDIA Corporation’s stock exhibited a robust bullish trend over the past year with a 161.82% price increase, though the trend shows deceleration. The price ranged between 72.13 and 202.49, with notable volatility (std deviation 32.99).
QUALCOMM Incorporated also demonstrated a bullish trend with a 14.56% gain and accelerating momentum. The stock price fluctuated from 127.46 to 215.33, with moderate volatility (std deviation 16.17).
Comparing both, NVIDIA delivered the highest market performance over the past year, outperforming QUALCOMM by a wide margin in price appreciation.
Target Prices
The current analyst consensus presents a bullish outlook for both NVIDIA Corporation and QUALCOMM Incorporated.
| Company | Target High | Target Low | Consensus |
|---|---|---|---|
| NVIDIA Corporation | 352 | 140 | 262.79 |
| QUALCOMM Incorporated | 210 | 165 | 189 |
Analysts expect NVIDIA’s stock to rise significantly from its current price of $188.85, with a consensus target near $263. QUALCOMM also shows upside potential, with a consensus target well above its current price of $172.98.
Analyst Opinions Comparison
This section compares analysts’ ratings and financial scores for NVIDIA Corporation and QUALCOMM Incorporated:
Rating Comparison
NVIDIA Corporation Rating
- Rating: B+, categorized as Very Favorable
- Discounted Cash Flow Score: Moderate at 3
- ROE Score: Very Favorable at 5
- ROA Score: Very Favorable at 5
- Debt To Equity Score: Moderate at 3
- Overall Score: Moderate at 3
QUALCOMM Incorporated Rating
- Rating: B+, categorized as Very Favorable
- Discounted Cash Flow Score: Favorable at 4
- ROE Score: Very Favorable at 5
- ROA Score: Very Favorable at 5
- Debt To Equity Score: Very Unfavorable at 1
- Overall Score: Moderate at 3
Which one is the best rated?
Both NVIDIA and QUALCOMM share the same overall rating of B+ and moderate overall scores. QUALCOMM has a higher discounted cash flow score but a significantly weaker debt-to-equity score compared to NVIDIA.
Scores Comparison
The following table compares the Altman Z-Score and Piotroski Score of NVIDIA Corporation and QUALCOMM Incorporated:
NVIDIA Scores
- Altman Z-Score: 69.52, indicating a safe zone with very low bankruptcy risk.
- Piotroski Score: 5, classified as average financial strength.
QUALCOMM Scores
- Altman Z-Score: 6.61, indicating a safe zone with low bankruptcy risk.
- Piotroski Score: 7, classified as strong financial strength.
Which company has the best scores?
QUALCOMM has a lower but still safe Altman Z-Score and a stronger Piotroski Score than NVIDIA, which has an exceptionally high Altman Z-Score but only an average Piotroski Score. Based on these scores, QUALCOMM shows a stronger overall financial strength.
Grades Comparison
Here is a comparison of recent reliable grades for NVIDIA Corporation and QUALCOMM Incorporated:
NVIDIA Corporation Grades
The following table summarizes recent grades assigned to NVIDIA Corporation by reputable grading companies.
| Grading Company | Action | New Grade | Date |
|---|---|---|---|
| Stifel | Buy | Buy | 2025-12-29 |
| Truist Securities | Buy | Buy | 2025-12-29 |
| Bernstein | Maintain | Outperform | 2025-12-26 |
| Baird | Maintain | Outperform | 2025-12-26 |
| B of A Securities | Maintain | Buy | 2025-12-26 |
| Truist Securities | Buy | Buy | 2025-12-19 |
| Tigress Financial | Strong Buy | Strong Buy | 2025-12-18 |
| Morgan Stanley | Maintain | Overweight | 2025-12-01 |
| Baird | Maintain | Outperform | 2025-11-20 |
| Truist Securities | Buy | Buy | 2025-11-20 |
NVIDIA’s grades predominantly show consistent Buy and Outperform ratings, with a notable Strong Buy and Overweight from major firms, reflecting sustained positive analyst sentiment.
QUALCOMM Incorporated Grades
The following table presents recent grades assigned to QUALCOMM Incorporated by recognized grading companies.
| Grading Company | Action | New Grade | Date |
|---|---|---|---|
| Mizuho | Maintain | Outperform | 2025-11-06 |
| Piper Sandler | Maintain | Overweight | 2025-11-06 |
| Wells Fargo | Maintain | Underweight | 2025-11-06 |
| UBS | Maintain | Neutral | 2025-11-06 |
| Rosenblatt | Maintain | Buy | 2025-11-06 |
| B of A Securities | Maintain | Buy | 2025-11-06 |
| JP Morgan | Maintain | Overweight | 2025-11-04 |
| Citigroup | Maintain | Neutral | 2025-10-28 |
| Rosenblatt | Maintain | Buy | 2025-10-28 |
| UBS | Maintain | Neutral | 2025-10-27 |
QUALCOMM’s grades are mixed, ranging from Buy and Outperform to Neutral and Underweight, indicating a more varied analyst outlook compared to NVIDIA.
Which company has the best grades?
NVIDIA Corporation generally holds stronger and more consistent Buy and Outperform grades than QUALCOMM Incorporated, whose ratings show greater divergence. This difference may influence investors by suggesting a clearer consensus on NVIDIA’s positive prospects relative to QUALCOMM’s more cautious view.
Strengths and Weaknesses
Below is a comparison of key strengths and weaknesses of NVIDIA Corporation (NVDA) and QUALCOMM Incorporated (QCOM) based on recent financial and operational data.
| Criterion | NVIDIA Corporation (NVDA) | QUALCOMM Incorporated (QCOM) |
|---|---|---|
| Diversification | Strong diversification with major revenue from Data Center (115B), Gaming (11.35B), Automotive (1.69B), and Professional Visualization (1.88B). | Moderate diversification with main segments QCT (38.37B) and QTL (5.58B). Smaller segments contribute less. |
| Profitability | Very high profitability: net margin 55.85%, ROE 91.87%, ROIC 75.28%. | Good profitability: net margin 12.51%, ROE 26.13%, ROIC 13.19%. |
| Innovation | Demonstrates durable competitive advantage with very favorable moat and growing ROIC (+339%). | Slightly favorable moat with declining ROIC (-52%), indicating challenges in sustaining innovation lead. |
| Global presence | Large global footprint given diverse client base in data centers, gaming, and automotive markets. | Strong global presence in mobile chipsets and licensing, but less diversified geographically. |
| Market Share | Dominant in GPUs for gaming and data centers, rapidly expanding automotive segment. | Leading in mobile chipset market but facing competitive pressures and slowing growth. |
Key takeaways: NVIDIA shows robust diversification, exceptional profitability, and strong innovation momentum, making it a compelling value creator. QUALCOMM remains profitable with solid market presence but faces a declining profitability trend and less diversification, suggesting caution for investors.
Risk Analysis
Below is a comparison table highlighting key risks for NVIDIA Corporation and QUALCOMM Incorporated as of 2025:
| Metric | NVIDIA Corporation (NVDA) | QUALCOMM Incorporated (QCOM) |
|---|---|---|
| Market Risk | High beta of 2.28 indicates higher volatility and market sensitivity. | Moderate beta of 1.21 reflects lower volatility. |
| Debt Level | Low debt-to-equity ratio at 0.13, low debt-to-assets 9.2%. | Moderate debt-to-equity at 0.7, debt-to-assets 29.54%. |
| Regulatory Risk | Exposure to international regulations, especially in China and Taiwan. | Intellectual property and licensing regulations globally. |
| Operational Risk | Complex supply chain and dependence on semiconductor fabrication partners. | Dependence on patent portfolio and licensing agreements. |
| Environmental Risk | Moderate, with growing focus on energy-efficient computing. | Moderate, with initiatives in sustainable technology development. |
| Geopolitical Risk | Significant, due to global supply chain and geopolitical tensions involving Taiwan and China. | Moderate, linked to global trade policies and patent disputes. |
NVIDIA’s greatest risks stem from its high market volatility and geopolitical exposure, especially related to Taiwan-China tensions, which could disrupt supply chains. QUALCOMM faces moderate risks mainly from regulatory and debt-related pressures, but benefits from a more stable market profile. Investors should weigh these factors carefully.
Which Stock to Choose?
NVIDIA Corporation (NVDA) exhibits a strong income evolution with revenue growth of 114.2% in one year and 683% over five years, supported by favorable profitability metrics including a 55.85% net margin and high returns on equity (91.87%) and invested capital (75.28%). The company maintains very low debt (net debt to EBITDA 0.02) and a very favorable rating of B+, reflecting robust financial health and a very favorable economic moat with growing ROIC far exceeding WACC.
QUALCOMM Incorporated (QCOM) shows moderate income growth with 13.66% revenue increase in one year and 32% over five years, alongside favorable profitability indicators such as a 12.51% net margin and returns on equity (26.13%) and invested capital (13.19%). Debt levels are higher (net debt to EBITDA 0.62) but still manageable, and it holds a B+ rating with a slightly favorable moat despite a declining ROIC trend.
For investors focused on growth and strong profitability, NVIDIA’s superior income growth, profitability ratios, and durable competitive advantage might appear more attractive. Conversely, investors prioritizing stable dividends and moderate growth could find QUALCOMM’s consistent income and favorable ratings more aligned with their profile, though its declining profitability trend warrants caution.
Disclaimer: Investment carries a risk of loss of initial capital. The past performance is not a reliable indicator of future results. Be sure to understand risks before making an investment decision.
Go Further
I encourage you to read the complete analyses of NVIDIA Corporation and QUALCOMM Incorporated to enhance your investment decisions: