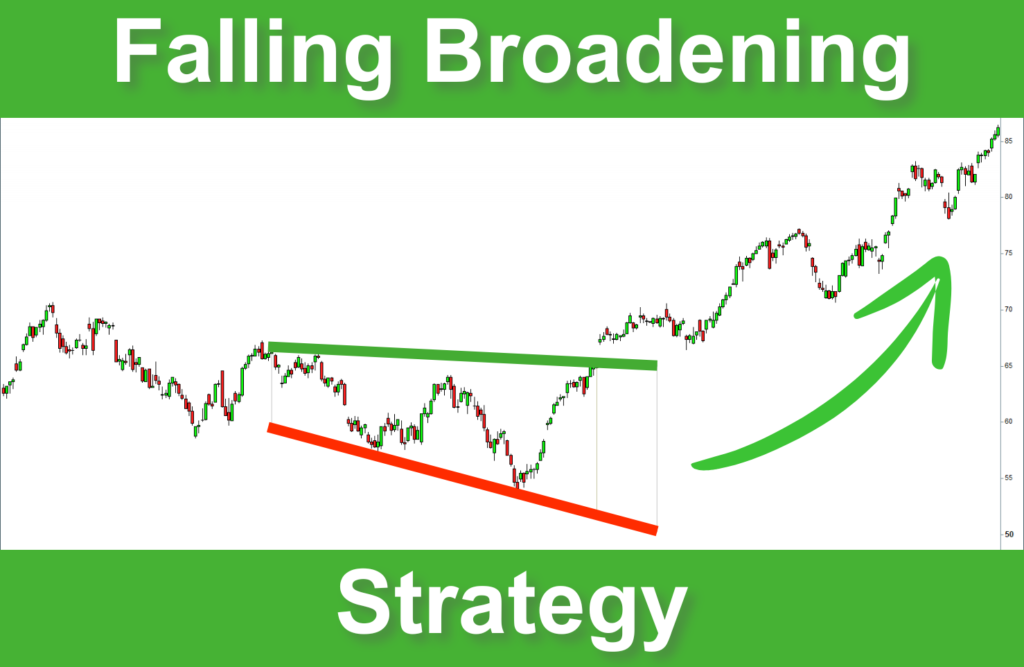
Take advantage of the volatility
Trading in a volatile market, where prices fluctuate significantly, is challenging. It requires a complete mastery of signals and key price levels. The falling broadening pattern will help you to get a clear picture of volatile markets. This figure will provide excellent buying signals and reference points for targets and stop-losses.
In this post, I will demonstrate how to utilize falling broadening to capitalize on volatility. You will learn to recognize this pattern, detect the signals, place the target, and secure your position.
What is the Falling Broadening Wedge Pattern?
A falling broadening wedge, or descending broadening wedge, forms during a downtrend. It comprises two broadening trendlines where the price makes lower lows and lower highs. It looks like a megaphone tilted downwards, where the price action becomes more volatile with each swing.
This pattern reflects increasing indecision in the market. Sellers are trying to push the price lower, but buyers are also stepping in, creating lower highs between each lower low. As volatility increases, the market is priming for a breakout.
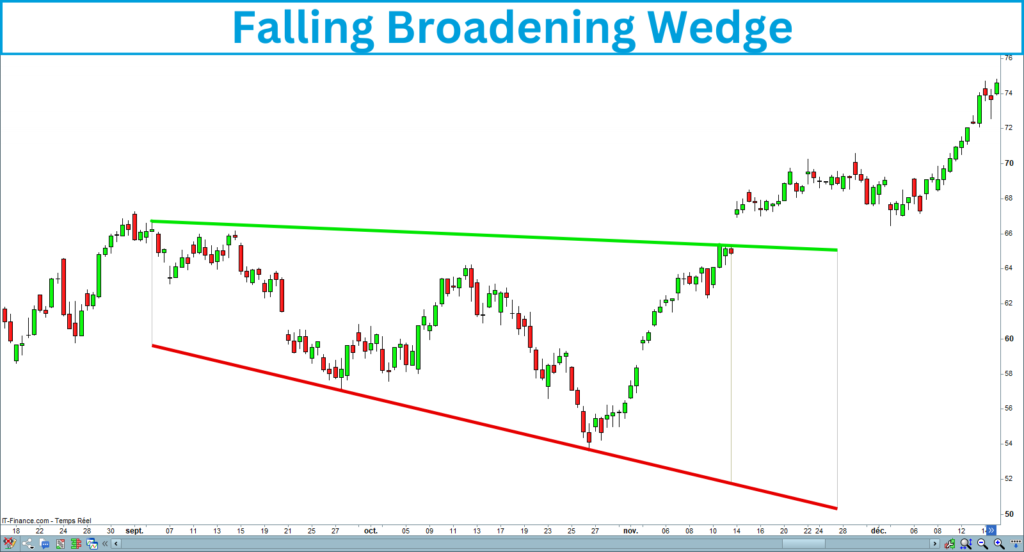
Recognizing this pattern will help you to take advantage of a potential sharp move once the breakout occurs. Here is an example of a falling broadening that happened in the Nasdaq in the 4-hour timeframe:
How to Identify the Falling Broadening Wedge?
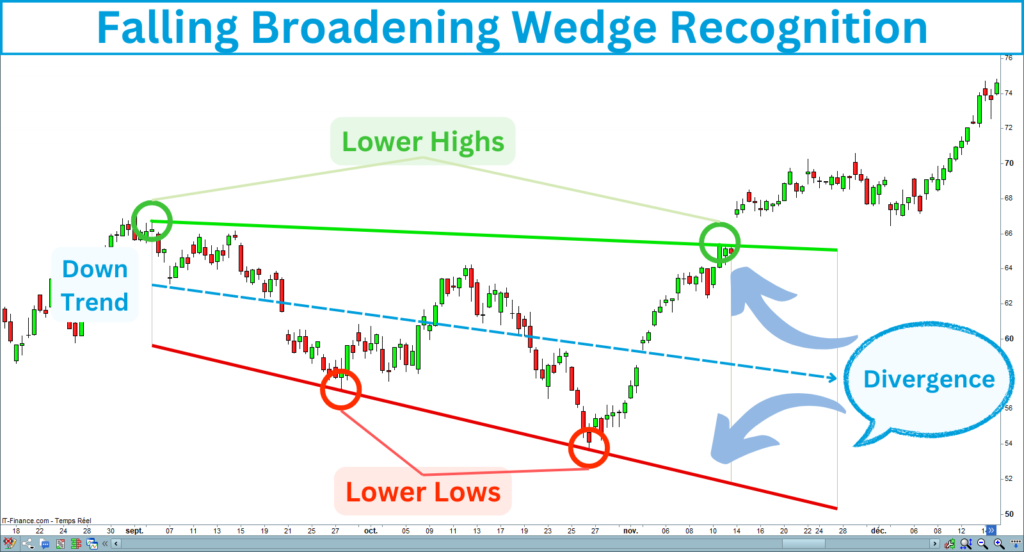
Recognizing the falling broadening wedge pattern is the first step you have to take. This figure is composed of two trendlines: one connecting the highs and another connecting the lows. Here are the properties of the falling broadening you have to check:
Falling Broadening Wedge Recognition
The following chart shows a falling broadening wedge meeting the previous criteria:
Falling Broadening Wedge Inclination
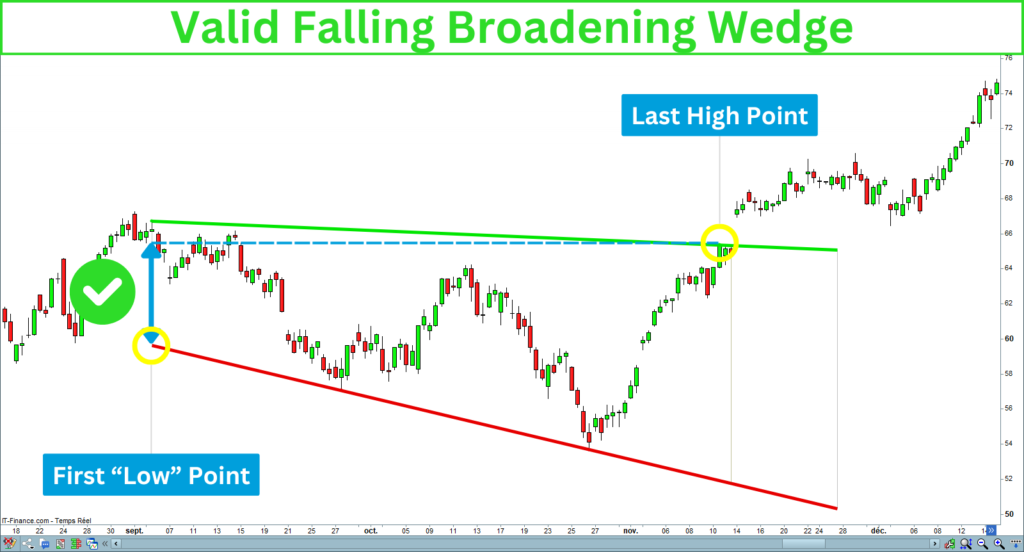
As the descending channel and the falling wedge, the falling broadening is a descending figure indicating a bearish bias. Opening a long entry in a bear market would be too risky. That is why you have to check some details before entering a trade. The falling broadening topline should not be too descending. Verify that the last highest point of the top line is greater than the first lowest point of the bottom line.
The following screenshot illustrates a falling broadening wedge that is not too descending:
What is the Falling Broadening Wedge Breakout?
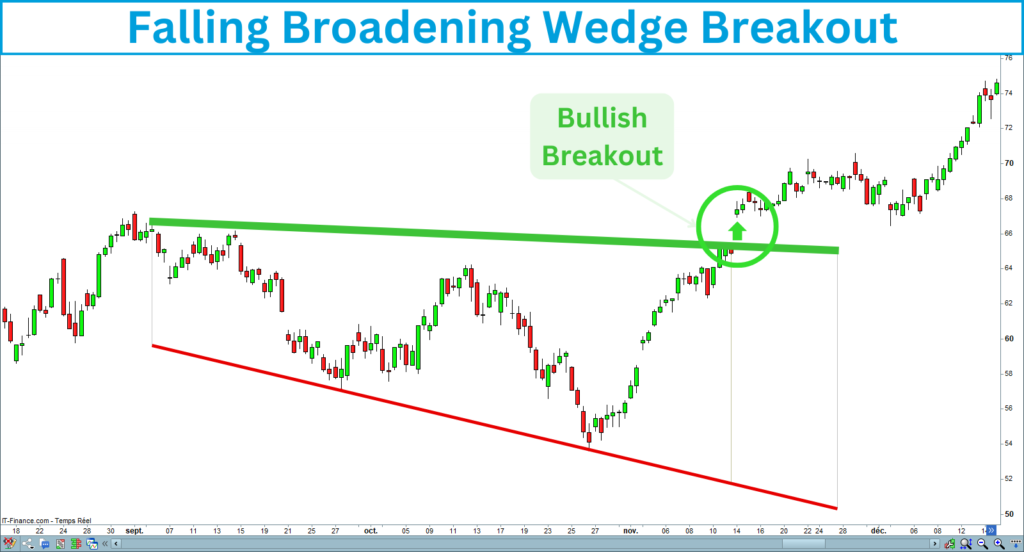
Once you’ve identified the falling broadening wedge characteristics, you can start preparing for the breakout that typically follows. The breakout occurs when the price breaks above the upper trendline of the falling broadening. It suggests that the buyers have gained control, and a reversal is likely to occur. You can consider the breakup of a falling broadening as a bullish reversal signal, presupposing that the uptrend will restart.
Waiting for a clear breakout is essential to avoid false signals. A false breakout happens when the price temporarily breaks above the uptrend line but quickly reverses into the pattern. I will show you later how to confirm a breakout using volume and strength indicators.
Here is a screenshot of a falling broadening breakout:
How to Trade the Falling Broadening Breakout?
Now, I will show you how to correctly trade the falling broadening wedge breakouts. I will present a step-by-step guide that includes everything you need to trade this pattern efficiently. I will show you how to identify and confirm buying signals, how to enhance your success rate with a filter, and where to set your target and stop-loss.
Here are the steps you have to follow to trade the falling broadening wedges breakout:
1. Identify the falling broadening wedge
First, you have to draw the falling broadening wedge. Look for two diverging trendlines connecting lower lows and lower highs. Verify that the price evolves in the pattern and that the wedge is descending:
2. Validate the long-term uptrend
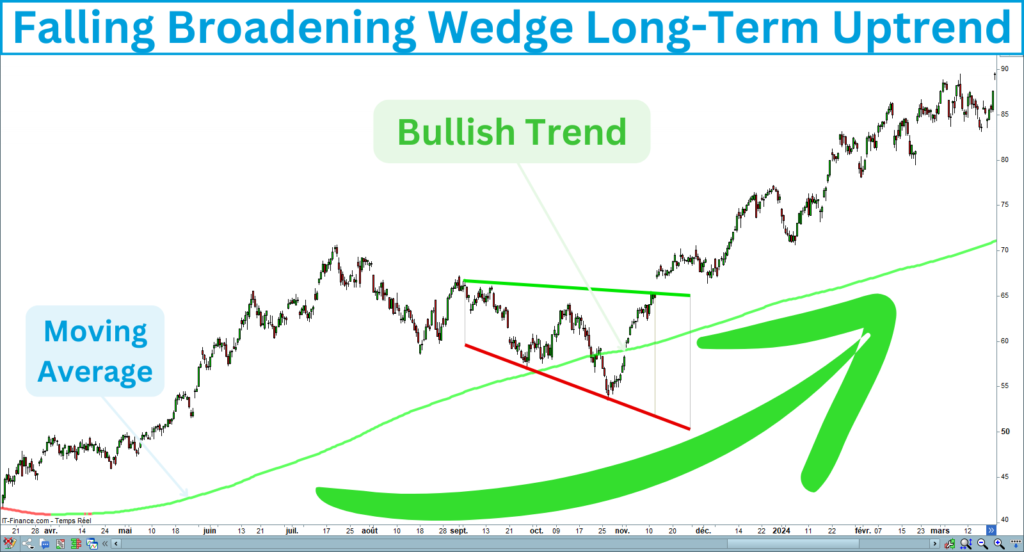
As its name suggests, the falling broadening is a descending figure, indicating a bearish bias. You certainly know that opening a long entry in a bear market is not a good idea. That is why you must ensure the falling broadening wedge appears in a long-term uptrend.
You can use a trend indicator, such as a moving average or linear regression, to verify the long-term trend. Check whether the slope of one of these indicators is positive over a period at least two times the wedge length. For example, if you watch a 50-candle falling broadening wedge, you must evaluate the trend on 100 or 200 candles.
The following chart shows a falling broadening wedge occurring in a long-term uptrend measured with a 300-period moving average:
3. Wait for the upper line breakout
Wait for the price to break the upper line and close above it before opening a long entry. This ensures the breakout is completed and not a temporary fluctuation.
The following chart shows a breakup of a falling broadening wedge:
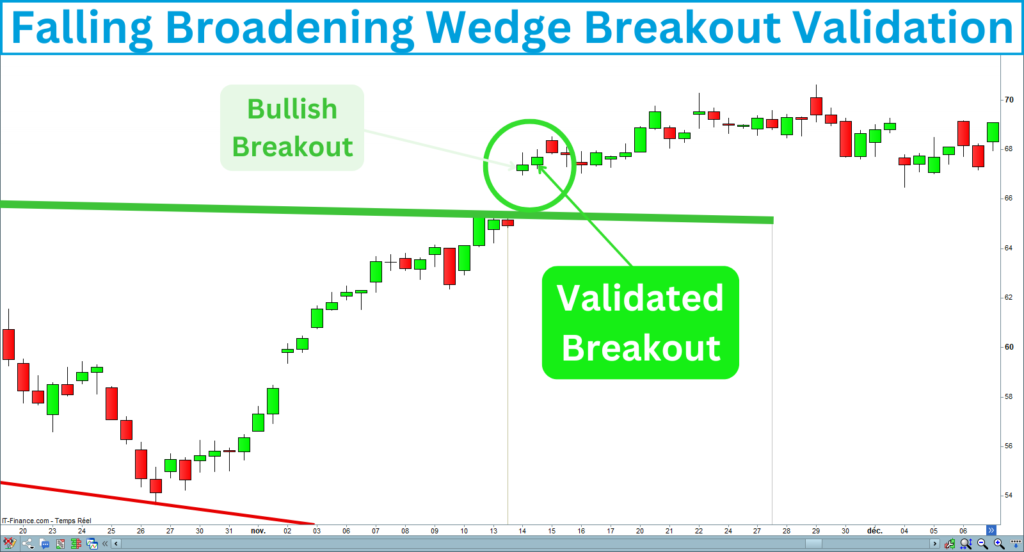
4. Validate the breakout
Waiting for a validated breakout will increase the success rate of your trade. A breakout is valid when the candle following the breakout closes above the top line of the wedge. You will pay a bit more but improve your chances of winning.
The following chart shows a validated breakup of a falling broadening wedge:
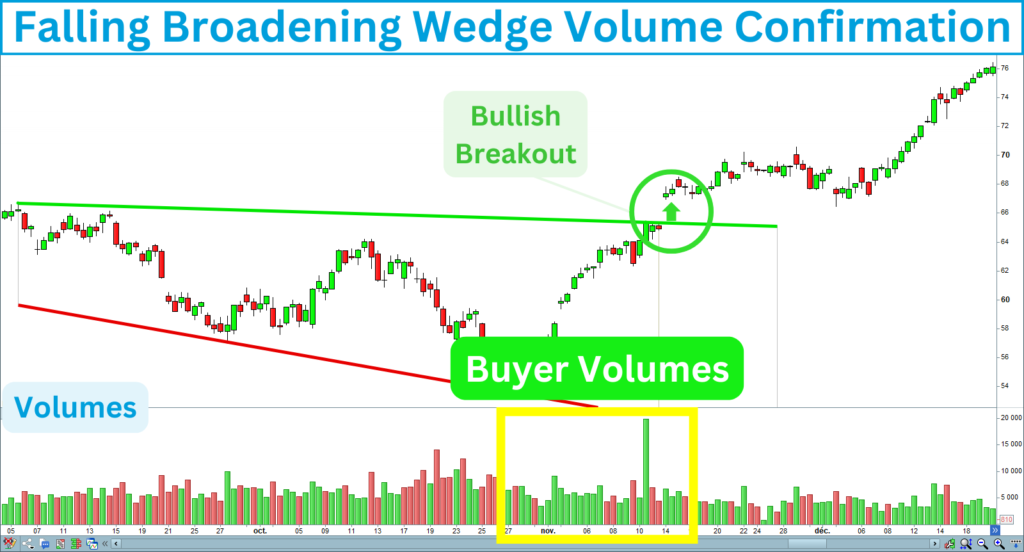
5. Confirm the signal with volumes
Volume is one of the best indicators for confirming a breakout. Verify that the breakup is preceded and supported by buyer volumes. That reveals that most traders agreed with the buying signal.
The following chart shows that buyer volumes occurred during the topline breakup of a falling broadening wedge:
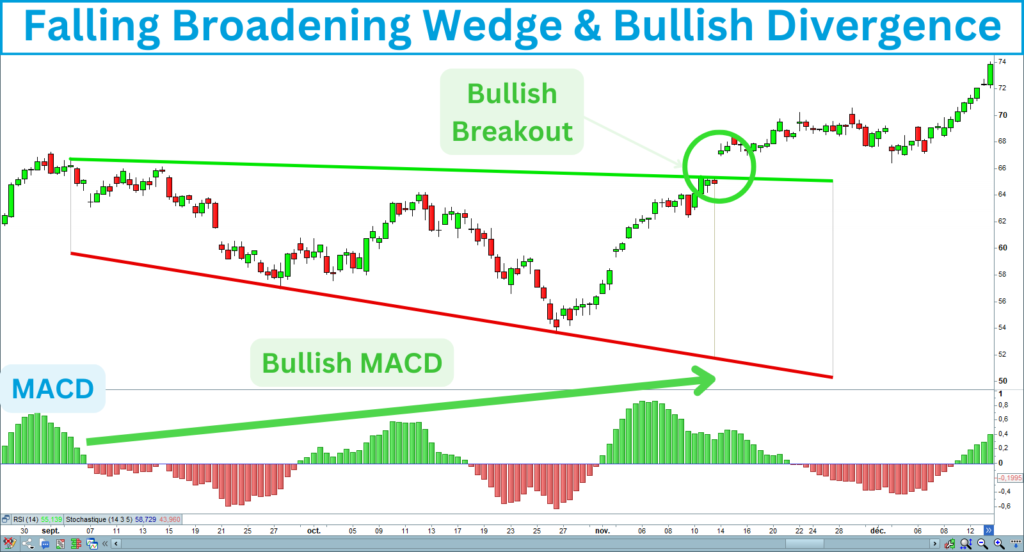
6. Confirm the signal with a bullish divergence
Strength indicators, such as the RSI or the MACD, measure the robustness of the trend. A bullish divergence occurs when market strength increases, despite the trend remaining bearish. It indicates that buyers are returning to the assets. Check for a bullish divergence at the end of the falling broadening wedge and during the breakup. This is an excellent way to prevent false breakouts and bull traps.
The following chart shows a bullish divergence associated with a falling wedge:
7. Open a long entry
Enter a long position once the breakout is confirmed with volumes and a positive divergence. Keep in mind that the falling broadening wedge is a descending figure. While its bearish bias is less than the falling wedge, it’s important to remain cautious and attentive to market conditions.
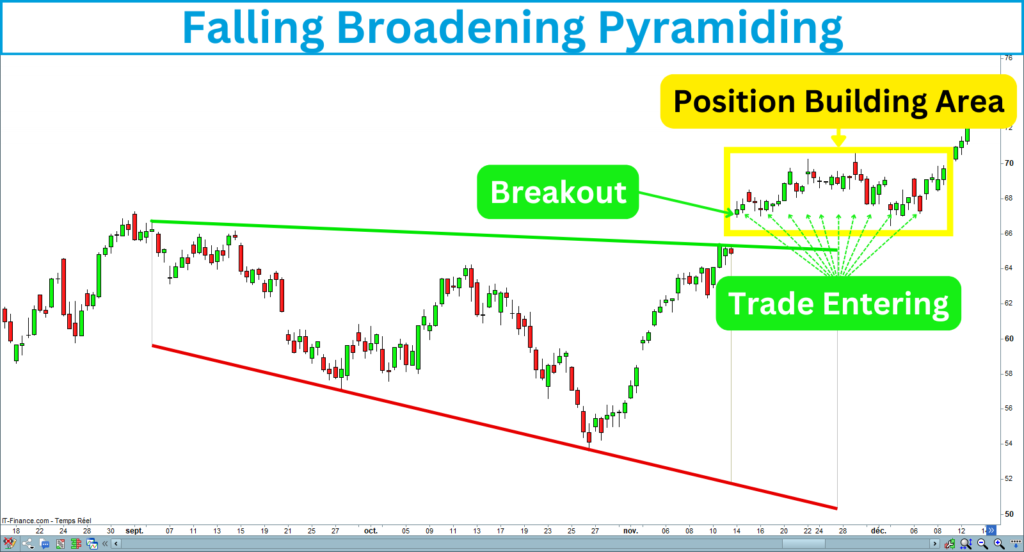
Gradually entering the trade is an excellent way to benefit from the trend restarting without taking too many risks. You can start building a long position from the topline breakup and continue while the market confirms the uptrend.
The following chart shows how you can pyramid a long position after a falling broadening wedge breakout:
8. Set the Stop-Loss
No strategy is complete without risk management. The particularity of the broadening wedge is that this figure corroborates the increase in volatility. That is why placing the stop-loss on a broadening wedge is more challenging than for other figures, such as descending channels.
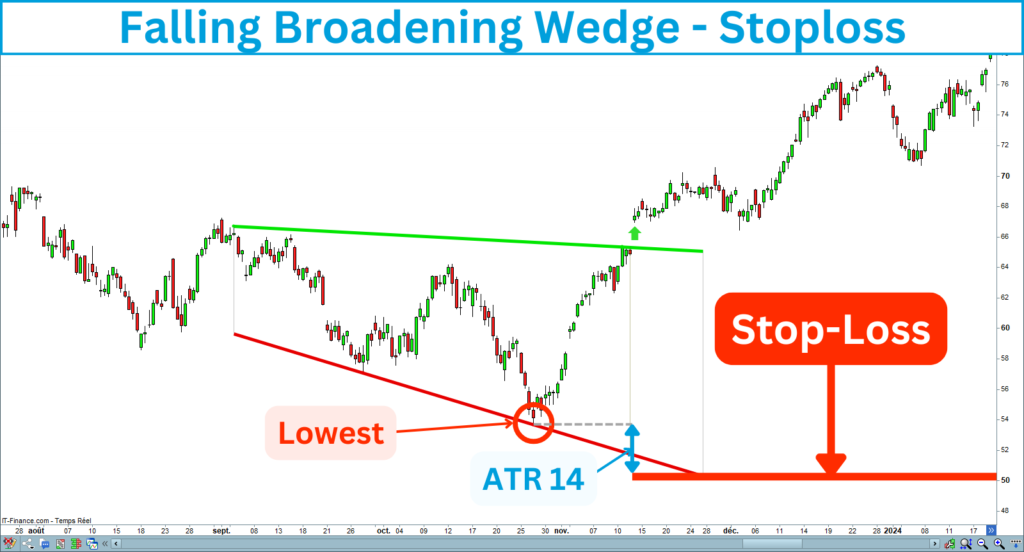
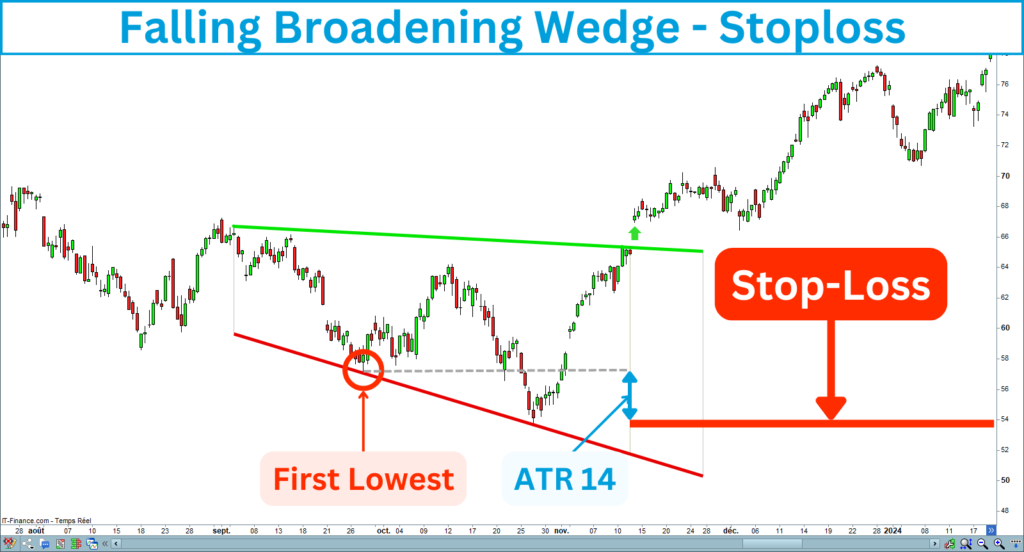
In principle, you should set the stop-loss below the lowest point of the wedge. This level is adapted for swing trading positions. However, since the falling broadening wedge widens and descends, the stop-loss position could be shallow. A stop-loss placed too low could deteriorate the risk/reward ratio. In this case, you could place the stop-loss below the first low point of the broadening wedge.
Regular stop-loss
The following chart shows the stop-loss below the lowest falling broadening wedge point:
Alternative stop-loss
The following chart shows the alternative stop-loss position below the first low of the falling broadening wedge:
9. Set the Take Profits
You have two options for placing the target. That will depend on the technical configuration:
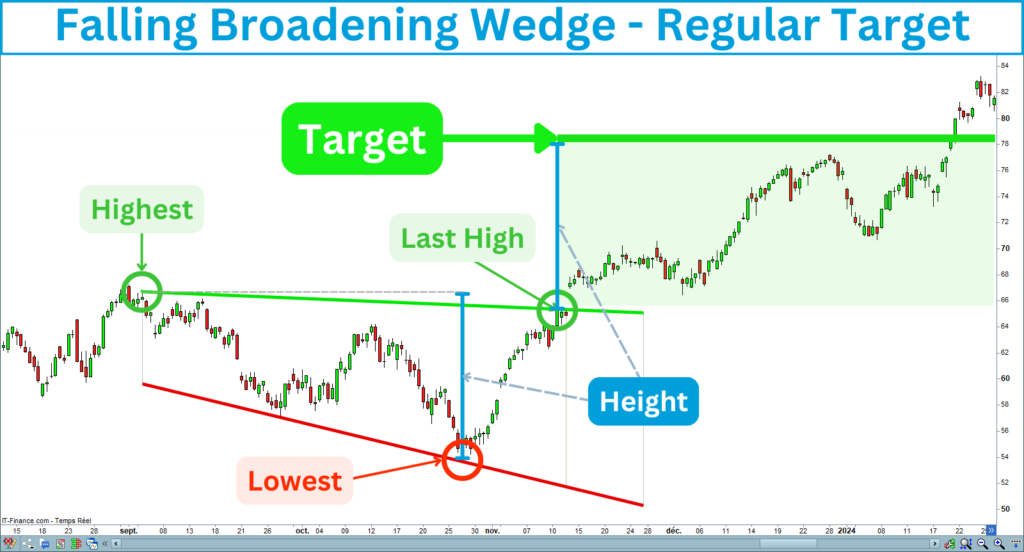
1. Regular case
If you open a long entry from a short-term perspective, you can report the broadening wedge height from its last high point:
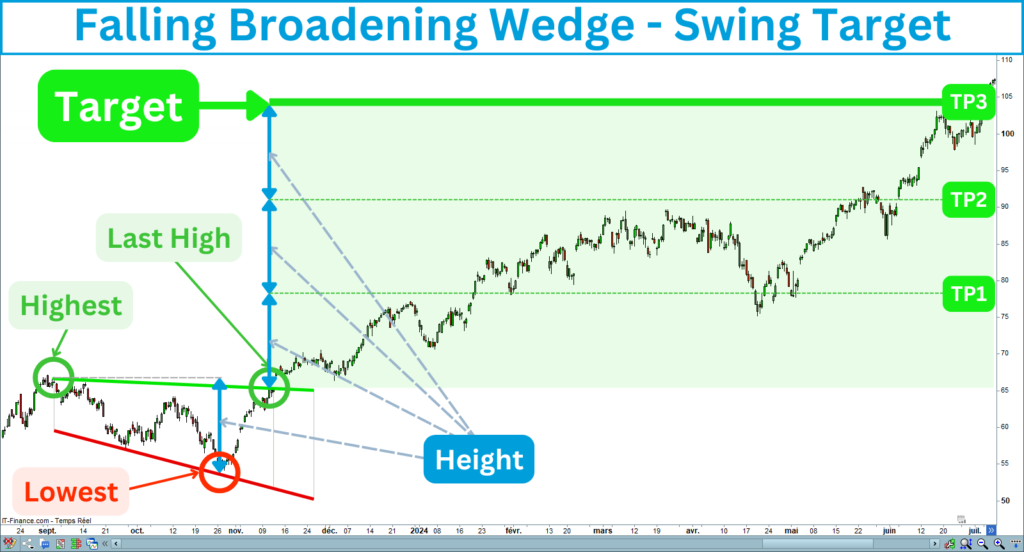
2. Strong momentum case
If you trade breakouts occurring with solid bullish momentum, you can target the broadening wedge height several times. This level is adapted to swing trading. You can also set profit targets at major resistance levels, such as a pivot point or a previous high. I prefer to open long positions only in strongly bullish markets. This increases the success rate and profit expectation. It is preferable to trade less but better.
The following chart shows the target area for a long entry opened after the falling broadening wedge breakup:
Key Points to Remember
Here are the key points you need to keep in mind to trade the breakouts of the falling broadening wedges correctly:
Falling Broadening Wedge Summary
The Falling Broadening Breakout Strategy is a powerful tool for traders looking to capitalize on market volatility.
This figure is more challenging to trade than other figures.
However, you will turn chaotic price movements into favorable opportunities.
You will significantly increase your performance by following the long-term uptrend.
If you are interested in the falling broadening breakout strategy, I created an indicator that recognizes this pattern. It draws trend lines, detects breakouts, and displays the target and stop-loss.
You will find the indicator on the marketplace of Prorealcode:
https://market.prorealcode.com/product/ultimate-breaker
I wish you good trades 😊
Vivien