In the ever-evolving landscape of technology, two companies stand out for their innovative contributions to the software application industry: ServiceTitan, Inc. (TTAN) and Asana, Inc. (ASAN). Both firms focus on enhancing productivity and streamlining operations, albeit in different niches within the market. ServiceTitan specializes in field service management, while Asana offers a comprehensive work management platform. In this article, I will analyze these companies to help you determine which presents a more compelling investment opportunity.
Table of contents
Company Overview
ServiceTitan, Inc. Overview
ServiceTitan, Inc. (TTAN) aims to streamline field service operations by providing a comprehensive software platform tailored for residential and commercial service businesses. Founded in 2008, the company is headquartered in Glendale, CA, and focuses on enhancing efficiency in the installation, maintenance, and servicing of infrastructure systems. With a market capitalization of approximately $8.31B, ServiceTitan is positioned as a leading player in the application software sector, serving a growing customer base that relies on its technology to improve service delivery and operational management.
Asana, Inc. Overview
Asana, Inc. (ASAN) offers a collaborative work management platform designed to assist teams in orchestrating tasks and projects efficiently. Established in 2008 and based in San Francisco, CA, Asana provides tools for managing everything from daily tasks to strategic initiatives across various industries, including technology, healthcare, and non-profit sectors. With a market capitalization of around $2.91B, Asana’s emphasis on enhancing productivity and organizational clarity has solidified its position as a key player in the software application market.
Key similarities between ServiceTitan and Asana include their focus on software solutions tailored to specific industries and their commitment to improving operational efficiency. However, they differ in their target markets; ServiceTitan is more concentrated on field service operations, while Asana caters to a broader range of work management needs across multiple sectors.
Income Statement Comparison
The following table summarizes the most recent income statements for ServiceTitan, Inc. (TTAN) and Asana, Inc. (ASAN), providing insights into their financial performance.
| Metric | ServiceTitan, Inc. (TTAN) | Asana, Inc. (ASAN) |
|---|---|---|
| Revenue | 772M | 724M |
| EBITDA | -141M | -230M |
| EBIT | -221M | -247M |
| Net Income | -239M | -256M |
| EPS | -8.53 | -1.11 |
Interpretation of Income Statement
In the latest fiscal year, both ServiceTitan and Asana reported declines in revenue, with TTAN achieving 772M and ASAN at 724M. Despite some growth in revenue year-over-year, both companies faced increasing losses, reflected in negative net incomes of 239M and 256M, respectively. Margins remained under pressure, indicating that both firms are struggling with operational efficiency. Notably, while TTAN’s losses widened, ASAN’s EPS improved slightly, suggesting a potential for better cost management moving forward. However, caution is warranted as both companies continue to operate at a loss, which raises concerns about their long-term viability without a clear path to profitability.
Financial Ratios Comparison
The table below presents a comparison of the most recent financial metrics for ServiceTitan, Inc. (TTAN) and Asana, Inc. (ASAN).
| Metric | [Company A: TTAN] | [Company B: ASAN] |
|---|---|---|
| ROE | -16.44% | -112.31% |
| ROIC | -14.25% | -54.04% |
| P/E | -18.12 | -19.16 |
| P/B | 2.98 | 21.52 |
| Current Ratio | 3.74 | 1.44 |
| Quick Ratio | 3.74 | 1.44 |
| D/E | 0.11 | 1.18 |
| Debt-to-Assets | 0.09 | 0.30 |
| Interest Coverage | -14.82 | -72.42 |
| Asset Turnover | 0.44 | 0.81 |
| Fixed Asset Turnover | 9.57 | 2.76 |
| Payout Ratio | 0% | 0% |
| Dividend Yield | 0% | 0% |
Interpretation of Financial Ratios
Both companies exhibit significant challenges, as indicated by their negative ROE and ROIC figures, reflecting poor profitability. TTAN shows a stronger liquidity position with a higher current and quick ratio, indicating better short-term financial health compared to ASAN. However, both companies face high debt levels and negative interest coverage ratios, raising concerns about their ability to manage debt obligations effectively. Investors should proceed with caution given these factors.
Dividend and Shareholder Returns
ServiceTitan, Inc. (TTAN) does not pay dividends, and its focus appears to be on reinvestment for growth, as indicated by its negative net income and ongoing high capital expenditures. The company also engages in share buybacks, which can enhance shareholder value if managed prudently. Similarly, Asana, Inc. (ASAN) abstains from dividends, prioritizing investment in research and development. Both companies’ strategies may support long-term value creation; however, the lack of immediate returns necessitates careful monitoring of their financial health and cash flow management.
Strategic Positioning
In the competitive landscape of software applications, ServiceTitan (TTAN) holds a significant market share in the field service management sector, leveraging its specialized platform for residential and commercial services. Asana (ASAN), on the other hand, competes in the work management domain, targeting a broader audience across various industries. Both companies face competitive pressure from emerging technologies and established players, necessitating continuous innovation and adaptation to technological disruptions to maintain their market positions.
Stock Comparison
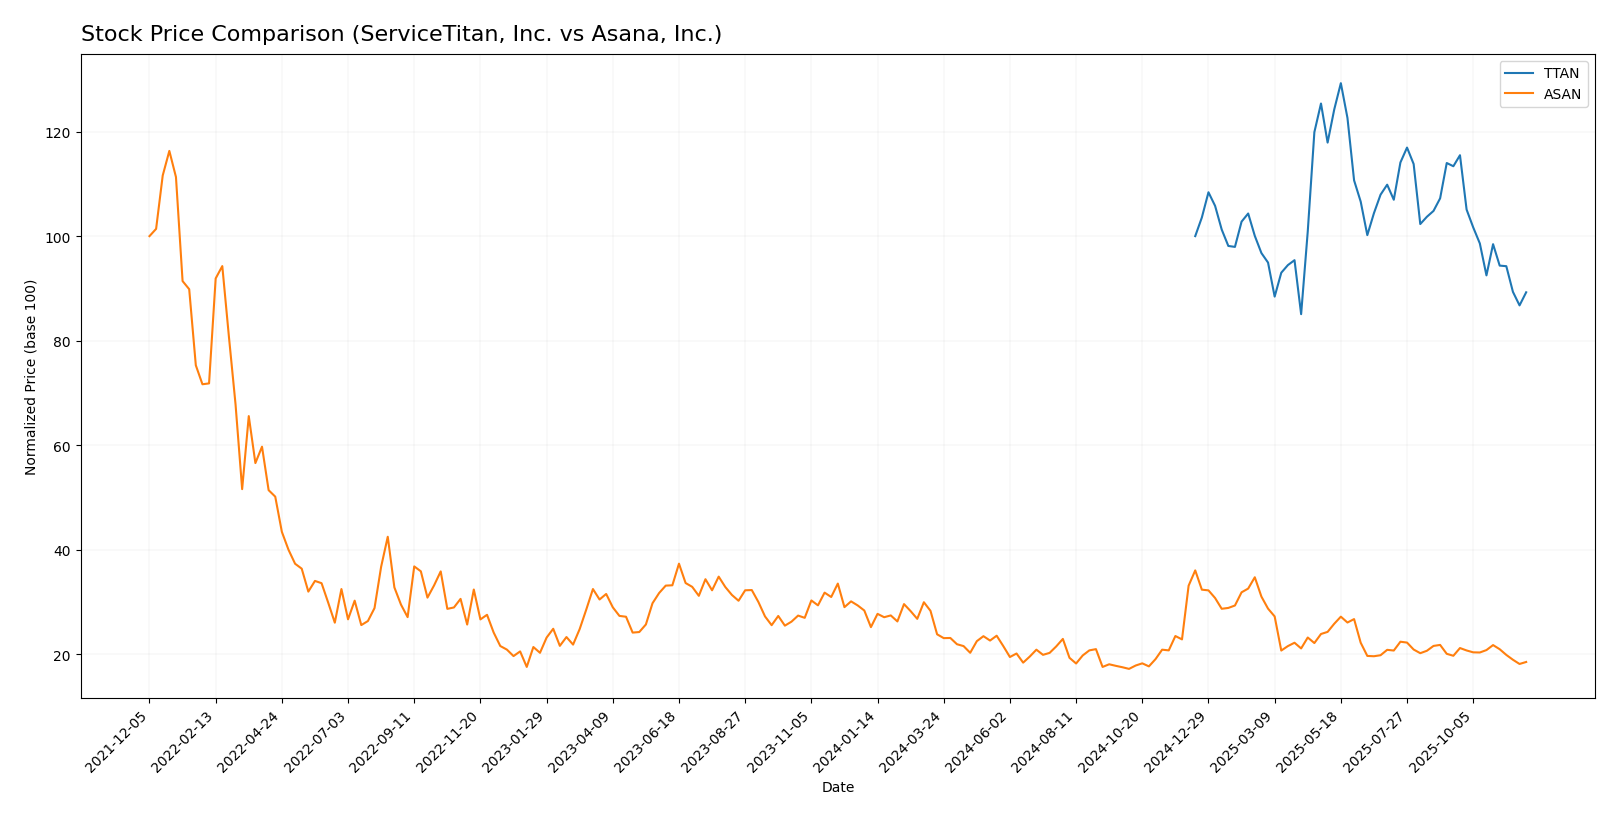
In this section, I will provide an analysis of the weekly stock price movements for ServiceTitan, Inc. (TTAN) and Asana, Inc. (ASAN), highlighting key price fluctuations and trading dynamics observed over the past year.
Trend Analysis
ServiceTitan, Inc. (TTAN) Over the past year, TTAN has experienced a percentage change of -10.75%, indicating a bearish trend. The stock has seen notable highs of 129.26 and lows of 85.07. The trend shows signs of deceleration, and the standard deviation of 10.29 suggests a moderate level of volatility. In the recent period from September 14, 2025, to November 30, 2025, the stock price decreased by -21.27%, further emphasizing the bearish sentiment with a trend slope of -2.37.
Asana, Inc. (ASAN) ASAN’s performance has been more pronounced, with a percentage change of -26.45% over the past year, also reflecting a bearish trend. The stock has reached a high of 24.15 and a low of 11.53. Similar to TTAN, the trend is in deceleration, and the standard deviation of 2.93 indicates lower volatility. In the recent analysis period from September 14, 2025, to November 30, 2025, ASAN’s price decreased by -6.02%, with a trend slope of -0.12, reinforcing the bearish outlook.
Both stocks are currently facing headwinds, and careful consideration is advised for potential investors.
Analyst Opinions
Recent analyst ratings for ServiceTitan, Inc. (TTAN) suggest a cautious stance with a rating of C-. Analysts highlight concerns regarding the company’s return on equity and earnings potential. Conversely, Asana, Inc. (ASAN) has received a D+ rating, indicating significant challenges in financial performance, particularly in debt management and profitability. Overall, the consensus for both companies leans toward a sell for the current year, reflecting the analysts’ concerns regarding their financial stability and growth prospects.
Stock Grades
The following stock ratings provide insights into the current sentiment surrounding ServiceTitan, Inc. (TTAN) and Asana, Inc. (ASAN).
ServiceTitan, Inc. Grades
| Grading Company | Action | New Grade | Date |
|---|---|---|---|
| BMO Capital | Maintain | Outperform | 2025-11-20 |
| Wells Fargo | Maintain | Overweight | 2025-09-19 |
| Stifel | Maintain | Buy | 2025-09-19 |
| Canaccord Genuity | Maintain | Buy | 2025-09-19 |
| Piper Sandler | Maintain | Overweight | 2025-09-19 |
| Citigroup | Maintain | Neutral | 2025-09-09 |
| Piper Sandler | Maintain | Overweight | 2025-09-05 |
| Needham | Maintain | Buy | 2025-09-05 |
| Morgan Stanley | Maintain | Equal Weight | 2025-09-05 |
| Truist Securities | Maintain | Buy | 2025-09-05 |
Asana, Inc. Grades
| Grading Company | Action | New Grade | Date |
|---|---|---|---|
| Baird | Maintain | Neutral | 2025-09-04 |
| Morgan Stanley | Maintain | Underweight | 2025-09-04 |
| Piper Sandler | Maintain | Overweight | 2025-09-04 |
| Baird | Maintain | Neutral | 2025-06-04 |
| UBS | Maintain | Neutral | 2025-06-04 |
| Jefferies | Maintain | Hold | 2025-06-04 |
| RBC Capital | Maintain | Underperform | 2025-06-04 |
| Morgan Stanley | Maintain | Underweight | 2025-06-04 |
| JMP Securities | Maintain | Market Outperform | 2025-06-04 |
| B of A Securities | Maintain | Buy | 2025-06-04 |
Overall, both ServiceTitan and Asana show a tendency towards stability with maintained grades across multiple grading firms. Notably, ServiceTitan has a strong backing from several “Buy” and “Overweight” ratings, indicating a positive outlook, while Asana has mixed sentiments with a blend of neutral and underweight assessments suggesting caution.
Target Prices
The consensus target prices for the selected companies suggest varied analyst expectations.
| Company | Target High | Target Low | Consensus |
|---|---|---|---|
| ServiceTitan, Inc. | 145 | 115 | 132.57 |
| Asana, Inc. | 88 | 10 | 23.41 |
Analysts expect ServiceTitan, Inc. to reach a consensus target of 132.57, significantly above its current price of 89.38, indicating strong growth potential. In contrast, Asana, Inc.’s consensus of 23.41 is still above its current price of 12.34, suggesting a more cautious outlook.
Strengths and Weaknesses
The following table outlines the strengths and weaknesses of ServiceTitan, Inc. (TTAN) and Asana, Inc. (ASAN), based on the most recent data.
| Criterion | ServiceTitan, Inc. (TTAN) | Asana, Inc. (ASAN) |
|---|---|---|
| Diversification | Moderate | Moderate |
| Profitability | Negative margins | Negative margins |
| Innovation | Strong presence | Strong presence |
| Global presence | Limited | Moderate |
| Market Share | Niche player | Growing |
| Debt level | Low (debt-to-equity: 0.11) | High (debt-to-equity: 1.18) |
Key takeaways: ServiceTitan demonstrates lower debt levels and a strong innovation focus, whereas Asana shows significant market growth potential but faces challenges with profitability and higher debt.
Risk Analysis
Below is a comprehensive overview of the risks associated with ServiceTitan, Inc. (TTAN) and Asana, Inc. (ASAN).
| Metric | ServiceTitan, Inc. (TTAN) | Asana, Inc. (ASAN) |
|---|---|---|
| Market Risk | High | Moderate |
| Regulatory Risk | Moderate | High |
| Operational Risk | Moderate | High |
| Environmental Risk | Low | Moderate |
| Geopolitical Risk | Low | Moderate |
Both companies face significant operational and regulatory risks, particularly Asana, which is under scrutiny for its governance practices. With TTAN’s recent market fluctuations and ASAN’s high debt levels, I recommend investors stay cautious.
Which one to choose?
When comparing ServiceTitan, Inc. (TTAN) and Asana, Inc. (ASAN), we observe that both companies are struggling with profitability as indicated by their negative net profit margins of -30.98% and -35.30%, respectively. TTAN has a higher gross profit margin (64.9%) compared to ASAN (89.3%), yet ASAN shows a better current ratio (1.44 vs. 3.74), indicating stronger short-term liquidity. Analyst ratings favor TTAN with a grade of C- versus ASAN’s D+, which reflects better overall fundamentals.
Both companies are in a bearish trend, with recent declines in stock prices of -21.27% for TTAN and -6.02% for ASAN. Given these insights, investors looking for potential stability might prefer TTAN, while those seeking growth opportunities may consider ASAN despite its current challenges.
Specific risks to consider include market dependence and intense competition in their respective sectors.
Disclaimer: This article is not financial advice. Each investor is responsible for their own investment decisions.
Go further
I encourage you to read the complete analyses of ServiceTitan, Inc. and Asana, Inc. to enhance your investment decisions: