In the ever-evolving landscape of software applications, two companies stand out: ServiceNow, Inc. (NOW) and Asana, Inc. (ASAN). Both operate within the same industry, focusing on enhancing productivity and efficiency in enterprises. While ServiceNow is renowned for its comprehensive cloud-based solutions that automate workflows across various sectors, Asana excels in providing a user-friendly work management platform tailored for team collaboration. As we delve into their respective strengths and strategies, I invite you to discover which of these companies presents the most compelling investment opportunity.
Table of contents
Company Overview
ServiceNow, Inc. Overview
ServiceNow, Inc. is a leader in enterprise cloud computing solutions, focused on automating and managing digital workflows for organizations globally. With a market capitalization of approximately $171.3B, the company provides a robust platform that encompasses IT service management, performance analytics, and artificial intelligence-driven automation tools. Founded in 2004 and headquartered in Santa Clara, California, ServiceNow serves a diverse range of sectors, including healthcare, finance, and government, with a commitment to enhancing operational efficiency through its advanced technology solutions.
Asana, Inc. Overview
Asana, Inc. operates a work management platform designed to streamline task orchestration for teams, helping them manage everything from daily activities to large-scale strategic initiatives. With a market cap of around $2.93B, Asana caters to various industries, including technology and healthcare, by offering tools that facilitate collaboration and project management. Established in 2008 and based in San Francisco, California, Asana serves as an essential resource for organizations aiming to enhance productivity and achieve their goals.
Both companies operate within the software application industry, focusing on improving workflows and efficiency. However, ServiceNow is more enterprise-oriented, providing comprehensive IT service management solutions, while Asana is tailored for team collaboration and project management, catering to a broader audience of individual users and organizations alike.
Income Statement Comparison
The following table compares the income statements of ServiceNow, Inc. (NOW) and Asana, Inc. (ASAN) for their most recent fiscal years, highlighting key financial metrics.
| Metric | ServiceNow, Inc. (NOW) | Asana, Inc. (ASAN) |
|---|---|---|
| Revenue | 10.98B | 723.88M |
| EBITDA | 2.23B | -229.55M |
| EBIT | 1.76B | -247.09M |
| Net Income | 1.43B | -255.54M |
| EPS | 6.92 | -1.11 |
Interpretation of Income Statement
In the latest fiscal year, ServiceNow demonstrated strong revenue growth, climbing to 10.98B, while Asana recorded a revenue of 723.88M. ServiceNow’s net income stood at 1.43B, reflecting robust profitability, whereas Asana continues to face challenges, posting a net loss of 255.54M. Margins for ServiceNow improved, showcasing effective cost management, while Asana’s EBITDA remained negative, indicating ongoing operational issues. Overall, ServiceNow’s performance highlights its market strength, while Asana’s struggles suggest a need for strategic adjustments to enhance profitability.
Financial Ratios Comparison
The following table provides a comparative overview of key financial ratios for ServiceNow, Inc. (NOW) and Asana, Inc. (ASAN). This analysis will help you assess their financial health and operational efficiency.
| Metric | NOW | ASAN |
|---|---|---|
| ROE | 14.83% | -1.12% |
| ROIC | 9.22% | -54.04% |
| P/E | 153.13 | -19.16 |
| P/B | 22.71 | 21.52 |
| Current Ratio | 1.10 | 1.44 |
| Quick Ratio | 1.10 | 1.44 |
| D/E | 0.24 | 1.18 |
| Debt-to-Assets | 11.18% | 30.11% |
| Interest Coverage | 59.30 | -72.42 |
| Asset Turnover | 0.54 | 0.81 |
| Fixed Asset Turnover | 4.47 | 2.76 |
| Payout Ratio | 0% | 0% |
| Dividend Yield | 0% | 0% |
Interpretation of Financial Ratios
In comparing the two companies, ServiceNow demonstrates strong profitability with a positive ROE and ROIC, whereas Asana’s negative figures indicate financial struggles. While both firms maintain healthy current and quick ratios, Asana’s high debt levels (D/E of 1.18) and negative interest coverage raise concerns about its financial stability. ServiceNow appears to be in a stronger position, making it a more attractive option for investors focused on financial health and operational efficiency.
Dividend and Shareholder Returns
ServiceNow, Inc. (NOW) does not pay dividends, which is typical for growth-oriented companies investing heavily in expansion and innovation. Their focus currently seems to be on optimizing cash flow and pursuing share buybacks to enhance shareholder value, despite the absence of dividends. Conversely, Asana, Inc. (ASAN) also refrains from dividend payments due to negative net income and a strong emphasis on reinvesting in their platform. Both companies’ strategies align with long-term value creation, but the sustainability of their approaches warrants careful monitoring as market conditions evolve.
Strategic Positioning
ServiceNow, Inc. (NOW) holds a substantial market share in the enterprise cloud computing space, focusing on automation and IT service management. Its competitive edge stems from advanced technologies, including AI and machine learning, but it faces increasing pressure from agile competitors like Asana, Inc. (ASAN), which offers a versatile work management platform. Asana’s focus on task orchestration and strategic initiatives positions it well among smaller firms, although it lacks the extensive offerings of ServiceNow. Both companies must navigate potential technological disruptions to maintain their market positions.
Stock Comparison
In this analysis, I will examine the weekly stock price movements of ServiceNow, Inc. (NOW) and Asana, Inc. (ASAN) over the past year, highlighting critical price dynamics and trading patterns that may influence your investment decisions.
Trend Analysis
ServiceNow, Inc. (NOW)
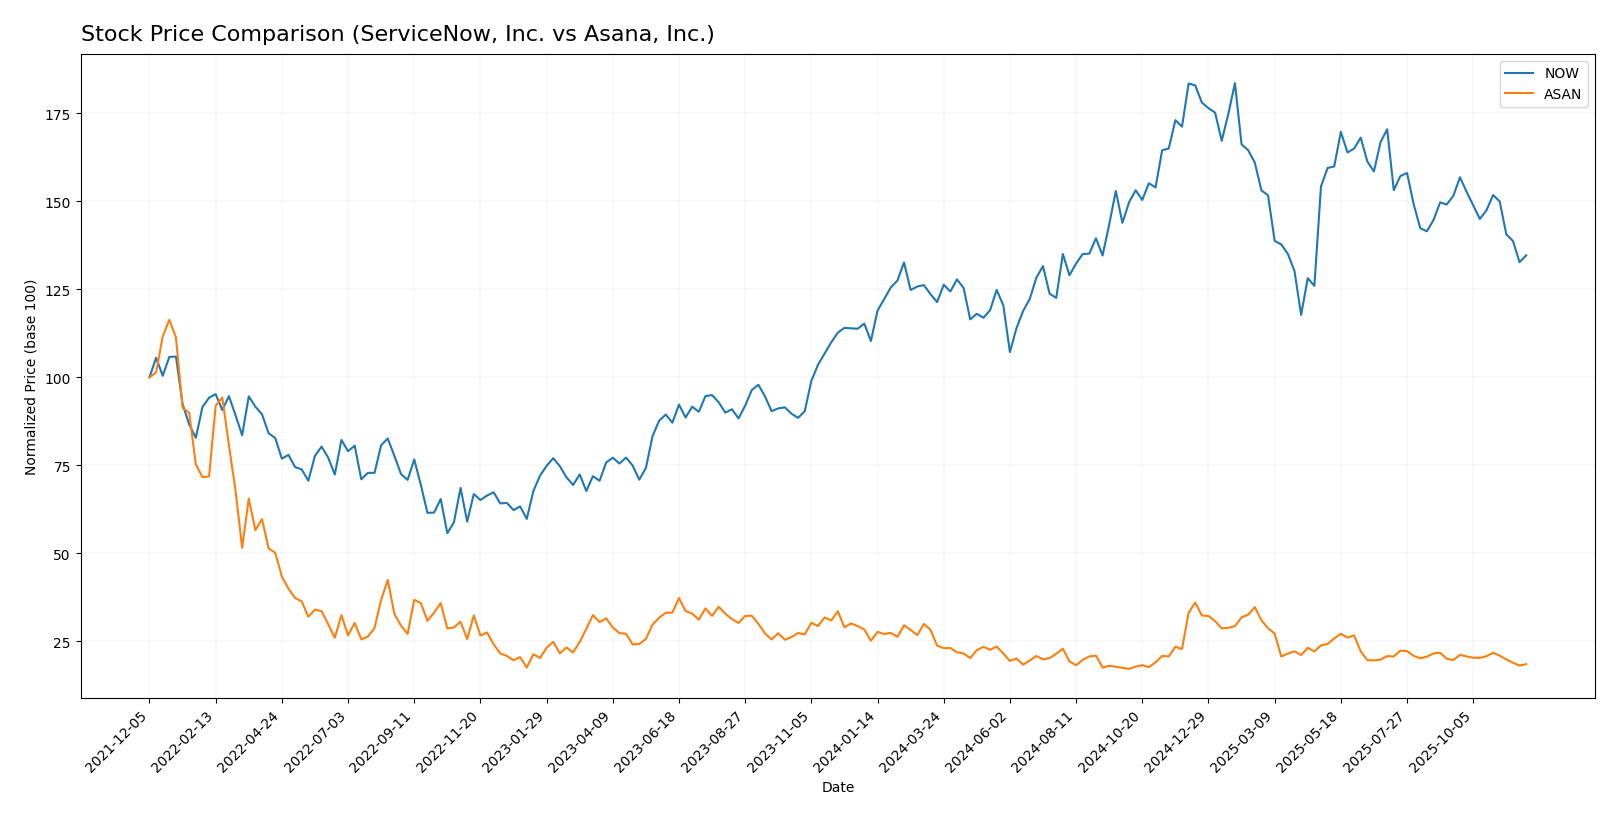
- Over the past year, NOW has experienced a percentage change of +22.06%. This indicates a bullish trend, despite a recent decline of -11.16% over the last 2.5 months (from September 14, 2025, to November 30, 2025).
- The stock reached a notable high of 1,124.98 and a low of 656.93. Although the overall trend is bullish, the acceleration status reveals deceleration, suggesting that upward momentum may be slowing. The standard deviation of 116.38 indicates a relatively high level of price volatility.
Asana, Inc. (ASAN)
- In contrast, ASAN has recorded a percentage change of -26.42% over the past year, indicating a bearish trend. The recent decline of -5.98% from September 14, 2025, to November 30, 2025, aligns with this trend.
- The stock’s highest price was 24.15, and the lowest was 11.53. The trend shows deceleration, suggesting that the rate of price change is lessening, although it remains firmly in a bearish trajectory. The standard deviation of 2.93 reflects relatively low volatility compared to NOW.
In summary, while NOW demonstrates a positive long-term outlook tempered by recent declines, ASAN continues to face challenges that could warrant caution for potential investors.
Analyst Opinions
Recent analyst recommendations for ServiceNow, Inc. (NOW) suggest a “Buy” rating, reflecting a strong performance in metrics such as return on equity and assets. Analysts highlight its robust discounted cash flow score as a key driver for positive sentiments. Conversely, Asana, Inc. (ASAN) has received a “Sell” rating, with analysts citing poor financial health indicated by low scores across multiple metrics. For the current year, the consensus leans towards a “Buy” for NOW and a “Sell” for ASAN, underscoring significant divergence in investor outlooks for these companies.
Stock Grades
In this section, I present the latest stock ratings for ServiceNow, Inc. and Asana, Inc., based on reliable data from recognized grading companies.
ServiceNow, Inc. Grades
| Grading Company | Action | New Grade | Date |
|---|---|---|---|
| JP Morgan | maintain | Overweight | 2025-10-30 |
| Canaccord Genuity | maintain | Buy | 2025-10-30 |
| TD Cowen | maintain | Buy | 2025-10-30 |
| UBS | maintain | Buy | 2025-10-30 |
| Wells Fargo | maintain | Overweight | 2025-10-30 |
| Barclays | maintain | Overweight | 2025-10-30 |
| Citigroup | maintain | Buy | 2025-10-30 |
| UBS | maintain | Buy | 2025-10-14 |
| Morgan Stanley | upgrade | Overweight | 2025-09-24 |
| JMP Securities | maintain | Market Outperform | 2025-08-04 |
Asana, Inc. Grades
| Grading Company | Action | New Grade | Date |
|---|---|---|---|
| Baird | maintain | Neutral | 2025-09-04 |
| Morgan Stanley | maintain | Underweight | 2025-09-04 |
| Piper Sandler | maintain | Overweight | 2025-09-04 |
| Baird | maintain | Neutral | 2025-06-04 |
| UBS | maintain | Neutral | 2025-06-04 |
| Jefferies | maintain | Hold | 2025-06-04 |
| RBC Capital | maintain | Underperform | 2025-06-04 |
| Morgan Stanley | maintain | Underweight | 2025-06-04 |
| JMP Securities | maintain | Market Outperform | 2025-06-04 |
| B of A Securities | maintain | Buy | 2025-06-04 |
Overall, the trend for ServiceNow appears strong, with multiple maintain ratings at “Overweight” and “Buy.” In contrast, Asana’s grades indicate a more cautious sentiment, with a mix of “Neutral” and “Underweight” ratings, suggesting a need for investors to be vigilant regarding its performance.
Target Prices
The current analyst consensus provides insightful target prices for two companies.
| Company | Target High | Target Low | Consensus |
|---|---|---|---|
| ServiceNow, Inc. (NOW) | 1315 | 860 | 1172.71 |
| Asana, Inc. (ASAN) | 88 | 10 | 23.41 |
For ServiceNow, the consensus target price of 1172.71 suggests significant upside potential compared to its current price of 825.31. In contrast, Asana’s target consensus of 23.41 indicates a potential recovery, though it remains close to its current price of 12.42.
Strengths and Weaknesses
The following table summarizes the strengths and weaknesses of ServiceNow, Inc. (NOW) and Asana, Inc. (ASAN) based on the most recent data.
| Criterion | ServiceNow, Inc. (NOW) | Asana, Inc. (ASAN) |
|---|---|---|
| Diversification | High | Moderate |
| Profitability | Strong (Net Margin: 12.97%) | Negative (Net Margin: -35.30%) |
| Innovation | High | Moderate |
| Global presence | Extensive | Limited |
| Market Share | Leading | Growing |
| Debt level | Low (Debt/Equity: 0.24) | High (Debt/Equity: 1.18) |
Key takeaways: ServiceNow shows strong profitability and low debt levels, making it a solid choice for investors. In contrast, Asana faces challenges with profitability and higher debt, indicating higher risk.
Risk Analysis
In this section, I present a comparative analysis of the risks associated with ServiceNow, Inc. (NOW) and Asana, Inc. (ASAN).
| Metric | ServiceNow, Inc. | Asana, Inc. |
|---|---|---|
| Market Risk | Moderate | High |
| Regulatory Risk | Low | Moderate |
| Operational Risk | Moderate | High |
| Environmental Risk | Low | Low |
| Geopolitical Risk | Low | Moderate |
Both companies face significant market and operational risks, particularly ASAN, which has been struggling with profitability. ServiceNow maintains a stronger position but still contends with volatility in the tech sector. Investors should remain cautious, especially given ASAN’s negative profit margins and higher operational risks.
Which one to choose?
In comparing ServiceNow, Inc. (NOW) and Asana, Inc. (ASAN), ServiceNow presents a more favorable investment profile with a market capitalization of approximately $218B and a strong gross profit margin of 79.2%, compared to Asana’s 89.3% but with negative profitability metrics. ServiceNow also boasts a solid overall rating of B, while Asana is rated D+, reflecting its struggles with profitability and higher debt levels. Analysts have noted a bullish trend for NOW, whereas ASAN shows a bearish trend with a significant price drop of 26.4%.
For growth-focused investors, I recommend considering ServiceNow due to its solid fundamentals and growth potential. Conversely, investors prioritizing speculative opportunities may find Asana’s low price attractive but should be cautious of its substantial risks related to ongoing losses and market dependence.
Disclaimer: This article is not financial advice. Each investor is responsible for their own investment decisions.
Go further
I encourage you to read the complete analyses of ServiceNow, Inc. and Asana, Inc. to enhance your investment decisions: