In the ever-evolving semiconductor industry, two major players stand out: Intel Corporation (INTC) and Texas Instruments Incorporated (TXN). Both companies share a commitment to innovation and technology, yet they approach the market with distinct strategies. Intel focuses on high-performance computing and advanced AI solutions, while Texas Instruments excels in analog and embedded processing. As we delve into this comparison, I invite you to consider which of these companies presents the more compelling investment opportunity for your portfolio.
Table of contents
Company Overview
Intel Corporation Overview
Intel Corporation (ticker: INTC), headquartered in Santa Clara, California, is a leading player in the semiconductor industry, specializing in designing, manufacturing, and selling advanced computer products and technologies. Founded in 1968, Intel’s mission is to power the world’s innovations through its cutting-edge platforms, including CPUs, chipsets, and system-on-chip solutions. The company operates in multiple segments, providing high-performance computing solutions tailored for various industries, including automotive and healthcare. With a market capitalization of approximately $158B and a workforce of about 109K employees, Intel remains at the forefront of technological advancements, including partnerships focused on artificial intelligence and autonomous driving solutions.
Texas Instruments Incorporated Overview
Texas Instruments Incorporated (ticker: TXN), based in Dallas, Texas, is another significant entity in the semiconductor sector, with a focus on designing and manufacturing semiconductors that cater to electronics designers and manufacturers globally. Established in 1930, Texas Instruments operates primarily in two segments: Analog and Embedded Processing. The company is committed to delivering innovative solutions that manage power and enhance signal processing across various industries, including automotive and personal electronics. With a market cap around $147B and a workforce of 34K, Texas Instruments emphasizes a diversified product portfolio, including microcontrollers and DLP products.
Key similarities between Intel and Texas Instruments include their strong positions within the semiconductor industry and their commitment to innovation. However, their business models differ, as Intel focuses on high-performance computing solutions while Texas Instruments specializes in analog and embedded processing products, targeting different segments of the electronics market.
Income Statement Comparison
The following table compares the latest income statements of Intel Corporation (INTC) and Texas Instruments Incorporated (TXN) for the fiscal year 2024, highlighting key financial metrics.
| Metric | Intel Corporation (INTC) | Texas Instruments (TXN) |
|---|---|---|
| Revenue | 53.1B | 15.6B |
| EBITDA | 1.2B | 7.5B |
| EBIT | -10.2B | 5.9B |
| Net Income | -18.8B | 4.8B |
| EPS | -4.38 | 5.24 |
Interpretation of Income Statement
In 2024, Intel Corporation faced significant challenges, with a decline in revenue to 53.1B and a net loss of 18.8B, reflecting ongoing operational difficulties. Conversely, Texas Instruments maintained a strong performance with a revenue of 15.6B and a net income of 4.8B, although their revenue also decreased from the previous year. The stark contrast in their earnings before interest and taxes (EBIT) highlights Intel’s operational struggles, while TXN’s margins have remained relatively stable. Overall, Intel’s financial troubles indicate a need for strategic reassessment, while TXN demonstrates resilience amidst industry fluctuations.
Financial Ratios Comparison
The following table provides a comparative overview of key financial metrics for Intel Corporation (INTC) and Texas Instruments Incorporated (TXN).
| Metric | INTC | TXN |
|---|---|---|
| ROE | -18.89% | 28.39% |
| ROIC | -12.18% | 14.75% |
| P/E | -4.63 | 23.78 |
| P/B | 0.88 | 9.16 |
| Current Ratio | 1.33 | 4.12 |
| Quick Ratio | 0.98 | 2.88 |
| D/E | 0.50 | 0.80 |
| Debt-to-Assets | 25.45% | 38.29% |
| Interest Coverage | -14.17 | 10.76 |
| Asset Turnover | 0.27 | 0.44 |
| Fixed Asset Turnover | 0.49 | 1.38 |
| Payout ratio | -8.53% | 99.92% |
| Dividend yield | 1.84% | 2.80% |
Interpretation of Financial Ratios
In assessing the financial health of both companies, TXN appears stronger with a positive ROE and robust P/E ratio, indicating effective profitability and investor confidence. In contrast, INTC’s negative ratios raise concerns about its profitability and debt management. The significantly higher current and quick ratios for TXN suggest better liquidity, whereas INTC’s high debt levels relative to its assets could pose risks. Overall, cautious investors may prefer TXN for its stability and growth potential.
Dividend and Shareholder Returns
Intel Corporation (INTC) has faced significant challenges, reflected in its negative net income and unsustainable dividend payout ratio of -8.53% in 2024, despite distributing $0.37 per share. Texas Instruments (TXN), on the other hand, maintains a solid dividend yield of 2.8% with a payout ratio of 99.92%, indicating strong shareholder returns through consistent dividends. Both companies engage in share buybacks, but TXN’s approach aligns better with sustainable long-term value creation for shareholders.
Strategic Positioning
In the semiconductor industry, Intel Corporation (INTC) holds a significant market share primarily through its central processing units (CPUs) and related technologies. However, it faces intense competitive pressure from Texas Instruments (TXN), which excels in analog and embedded processing segments. Both companies are experiencing technological disruptions, notably in AI and energy-efficient products. Intel’s broad portfolio contrasts with Texas Instruments’ specialized offerings, creating distinct competitive strategies in the evolving market landscape.
Stock Comparison
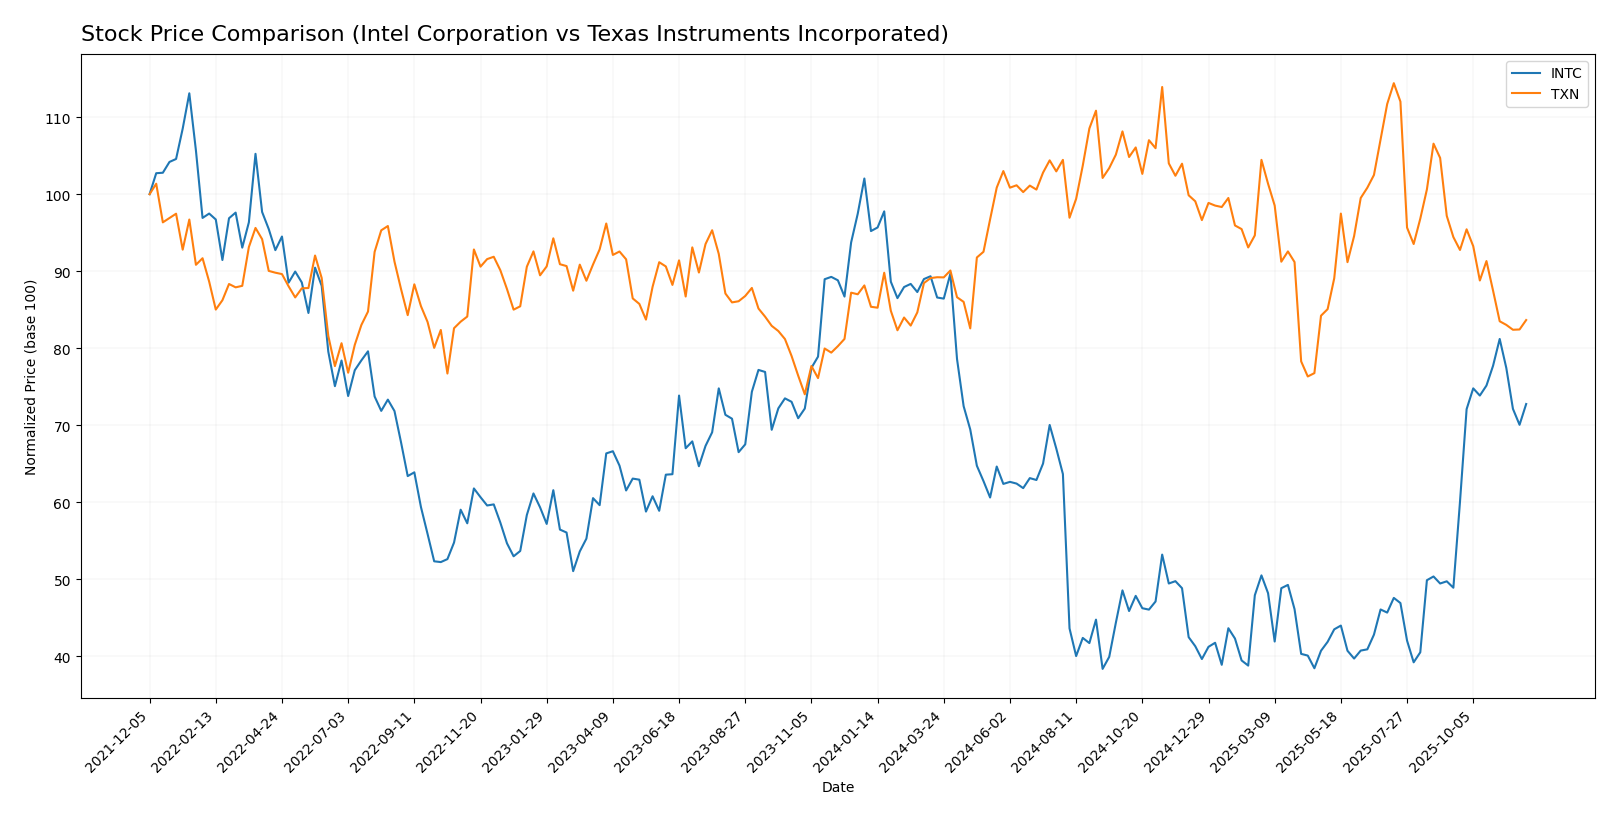
In this section, I will analyze the stock price movements of Intel Corporation (INTC) and Texas Instruments Incorporated (TXN) over the past year, highlighting key price dynamics and trends.
Trend Analysis
Intel Corporation (INTC) Over the past year, INTC has experienced a price change of -23.59%, indicating a bearish trend. The stock has shown signs of acceleration in this downward movement, with notable highs at 48.15 and lows at 18.89. The standard deviation of 8.47 reflects significant volatility in its price movements.
In a more recent trend analysis from September 14, 2025, to November 30, 2025, INTC demonstrated a price increase of 48.8%, with a standard deviation of 4.13, suggesting some recovery. The trend slope of 0.67 indicates a positive momentum during this period, although the overall long-term trend remains bearish.
Texas Instruments Incorporated (TXN) TXN’s stock has also experienced a price change of -2.02% over the past year, categorizing it as bearish. The trend has shown signs of deceleration, with highs at 221.25 and lows at 147.6, and a higher standard deviation of 16.96, pointing to considerable volatility.
In the recent analysis from September 14, 2025, to November 30, 2025, TXN has recorded a price decrease of 11.41%, with a standard deviation of 9.42. The trend slope of -2.53 further indicates a downward momentum in this period.
In summary, both stocks are currently in bearish trends, with INTC showing some short-term recovery potential, while TXN continues to face challenges in maintaining its price levels.
Analyst Opinions
Recent analyst recommendations for Intel Corporation (INTC) show a cautious stance with a rating of C+. Analysts highlight concerns over its discounted cash flow and price-to-earnings metrics, suggesting a hold position. In contrast, Texas Instruments Incorporated (TXN) received a more favorable rating of B, with strong scores in return on equity and assets, leading analysts to recommend a buy. As of now, the consensus leans towards a hold for INTC and a buy for TXN, reflecting varying investor sentiment.
Stock Grades
As of late 2025, I have reviewed the most current stock grades for Intel Corporation (INTC) and Texas Instruments Incorporated (TXN). Here’s a summary of their ratings from reputable grading companies.
Intel Corporation Grades
| Grading Company | Action | New Grade | Date |
|---|---|---|---|
| Tigress Financial | maintain | Buy | 2025-11-04 |
| Barclays | maintain | Equal Weight | 2025-10-27 |
| Mizuho | maintain | Neutral | 2025-10-24 |
| Wedbush | maintain | Neutral | 2025-10-24 |
| Wells Fargo | maintain | Equal Weight | 2025-10-24 |
| Cantor Fitzgerald | maintain | Neutral | 2025-10-24 |
| Morgan Stanley | maintain | Equal Weight | 2025-10-24 |
| Truist Securities | maintain | Hold | 2025-10-24 |
| Rosenblatt | maintain | Sell | 2025-10-24 |
| JP Morgan | maintain | Underweight | 2025-10-24 |
Texas Instruments Incorporated Grades
| Grading Company | Action | New Grade | Date |
|---|---|---|---|
| Susquehanna | maintain | Positive | 2025-10-22 |
| Rosenblatt | maintain | Buy | 2025-10-22 |
| Truist Securities | maintain | Hold | 2025-10-22 |
| Wells Fargo | maintain | Equal Weight | 2025-10-22 |
| Goldman Sachs | maintain | Buy | 2025-10-22 |
| JP Morgan | maintain | Overweight | 2025-10-22 |
| Cantor Fitzgerald | maintain | Neutral | 2025-10-22 |
| Stifel | maintain | Hold | 2025-10-22 |
| TD Cowen | maintain | Buy | 2025-10-22 |
| Mizuho | downgrade | Underperform | 2025-10-20 |
Overall, Intel’s grades reflect a consistent sentiment of maintaining positions, with a notable diversity in opinions, while Texas Instruments displays a generally positive outlook with a mix of “Buy” and “Hold” recommendations, despite a recent downgrade from Mizuho. This suggests a stable but cautious approach to both stocks in the current market environment.
Target Prices
The consensus target prices for Intel Corporation (INTC) and Texas Instruments Incorporated (TXN) suggest potential upside from their current trading prices.
| Company | Target High | Target Low | Consensus |
|---|---|---|---|
| Intel Corporation (INTC) | 52 | 20 | 35.22 |
| Texas Instruments (TXN) | 245 | 145 | 190.45 |
Intel’s consensus target price of 35.22 indicates a slight upside potential, while Texas Instruments shows a significant upside from its current price of 161.77, with a consensus target of 190.45. This suggests overall positive expectations from analysts for both companies.
Strengths and Weaknesses
The following table outlines the strengths and weaknesses of Intel Corporation (INTC) and Texas Instruments Incorporated (TXN).
| Criterion | Intel Corporation (INTC) | Texas Instruments (TXN) |
|---|---|---|
| Diversification | Limited; focused on semiconductors | Strong; diversified across analog and embedded processing |
| Profitability | Low profitability; net margin at 3.1% | High profitability; net margin at 37.2% |
| Innovation | Strong R&D but facing competition | Consistent innovation and product development |
| Global presence | Strong presence in North America and Asia | Established global footprint, especially in automotive and industrial sectors |
| Market Share | Declining market share in CPUs | Growing market share in analog semiconductors |
| Debt level | Moderate; debt-to-equity ratio at 0.47 | Higher; debt-to-equity ratio at 0.80 |
Key takeaways indicate that while Texas Instruments showcases robust profitability and a strong diversified portfolio, Intel faces challenges in profitability and market share amidst stiff competition. Investors should consider these factors when evaluating investment opportunities in these companies.
Risk Analysis
In the following table, I’ve outlined key risks associated with Intel Corporation (INTC) and Texas Instruments Incorporated (TXN).
| Metric | Intel Corporation (INTC) | Texas Instruments Incorporated (TXN) |
|---|---|---|
| Market Risk | High | Moderate |
| Regulatory Risk | Moderate | Low |
| Operational Risk | High | Moderate |
| Environmental Risk | Moderate | Low |
| Geopolitical Risk | High | Moderate |
Both companies face significant market and operational risks, particularly Intel, which has been experiencing a downturn in profitability. Recent shifts in technology demand and geopolitical tensions could further impact their stock performance.
Which one to choose?
When comparing Intel Corporation (INTC) and Texas Instruments Incorporated (TXN), the fundamentals indicate a distinct divergence in performance and outlook. TXN boasts a higher net profit margin of 30.68% compared to INTC’s -35.32%, reflecting better operational efficiency. Moreover, TXN has a stronger rating of B versus INTC’s C+, suggesting greater analyst confidence. While INTC’s recent stock trend shows a recovery with a 48.8% increase, TXN’s trend indicates a downturn of 11.41%.
For growth-oriented investors, INTC may present a speculative opportunity despite its volatility. Conversely, conservative investors prioritizing stability might find TXN more appealing due to its consistent profitability, solid market presence, and robust financial ratios.
However, both companies face risks such as competition and market dependence, which could affect their performance.
Disclaimer: This article is not financial advice. Each investor is responsible for their own investment decisions.
Go further
I encourage you to read the complete analyses of Intel Corporation and Texas Instruments Incorporated to enhance your investment decisions: