In the rapidly evolving semiconductor industry, two companies stand out: Intel Corporation (INTC) and CEVA, Inc. (CEVA). While both operate within the same sector, their approaches to innovation and market focus differ significantly. Intel is a giant known for its comprehensive range of computing technologies, while CEVA specializes in wireless connectivity and smart sensing solutions. In this comparison, I will help you determine which company presents the more compelling investment opportunity.
Table of contents
Company Overview
Intel Corporation Overview
Intel Corporation (ticker: INTC) is a leading player in the semiconductor industry, specializing in the design, manufacture, and sale of computer products and technologies globally. Founded in 1968 and headquartered in Santa Clara, California, Intel offers a broad range of products, including central processing units (CPUs), chipsets, and advanced solutions for cloud service providers and various targeted verticals. The company is also at the forefront of innovations in artificial intelligence and autonomous driving technologies, making it a crucial partner for original equipment manufacturers (OEMs) and cloud service providers. With a market cap of approximately $158B, Intel continues to navigate a competitive landscape marked by rapid technological advancements.
CEVA, Inc. Overview
CEVA, Inc. (ticker: CEVA) operates as a licensor of advanced wireless connectivity and smart sensing technologies, catering primarily to semiconductor and OEM companies. Established in 1999 and based in Rockville, Maryland, CEVA designs and licenses digital signal processors (DSPs), AI processors, and software solutions for various applications, including computer vision and sensor fusion. The company excels in providing integrated IP solutions for mobile and IoT markets, with a focus on enabling next-generation connectivity through its DSP-based platforms. CEVA’s market cap stands at around $486M, underscoring its specialized role in the semiconductor ecosystem.
Key Similarities and Differences
Both Intel and CEVA operate in the semiconductor industry, focusing on technology development and licensing. Intel emphasizes a comprehensive range of hardware solutions and direct manufacturing, while CEVA specializes in licensing DSP technologies and providing tailored software solutions for connectivity and sensing applications. This distinction illustrates their different approaches in serving their respective markets, with Intel having a broader portfolio compared to CEVA’s targeted technology licensing model.
Income Statement Comparison
The following table presents a comparison of the most recent income statements for Intel Corporation (INTC) and CEVA, Inc. (CEVA), highlighting key financial metrics for each company.
| Metric | Intel Corporation | CEVA, Inc. |
|---|---|---|
| Revenue | 53.1B | 106.9M |
| EBITDA | 1.2B | -3.4M |
| EBIT | -10.2B | -7.5M |
| Net Income | -18.8B | -8.8M |
| EPS | -4.38 | -0.37 |
Interpretation of Income Statement
In the most recent fiscal year, Intel’s revenue declined to 53.1B from 54.2B the previous year, indicating a downward trend. The net income also nosedived from a profit of 1.7B to a loss of 18.8B, signaling significant operational challenges. CEVA, in contrast, experienced a slight increase in revenue from 97.4M to 106.9M, yet continued to report losses. Both companies face tight margins, with Intel’s EBIT showing profound negative performance, while CEVA’s EBITDA remains in the red. This trend suggests a need for strategic shifts to enhance profitability and operational efficiency in the coming periods.
Financial Ratios Comparison
The following table presents a comparison of key financial ratios for Intel Corporation (INTC) and CEVA, Inc. (CEVA) based on the most recent data.
| Metric | Intel Corporation (INTC) | CEVA, Inc. (CEVA) |
|---|---|---|
| ROE | -18.89% | -3.30% |
| ROIC | -12.18% | -8.56% |
| P/E | -4.63 | -84.79 |
| P/B | 0.88 | 2.79 |
| Current Ratio | 1.33 | 7.09 |
| Quick Ratio | 0.98 | 7.09 |
| D/E | 0.50 | 0.02 |
| Debt-to-Assets | 25.45% | 1.79% |
| Interest Coverage | -14.17 | N/A |
| Asset Turnover | 0.27 | 0.34 |
| Fixed Asset Turnover | 0.49 | 8.43 |
| Payout Ratio | -8.53% | 0% |
| Dividend Yield | 1.84% | 0% |
Interpretation of Financial Ratios
Intel’s ratios indicate significant financial distress, as evidenced by negative returns on equity (ROE) and investment (ROIC), alongside a notably low P/E ratio. CEVA also shows weaknesses, particularly in profitability and returns, reflected by its negative P/E and high debt levels. However, CEVA’s current and quick ratios suggest strong liquidity, which may offer some resilience against operational challenges. Both companies present considerable risks for investors.
Dividend and Shareholder Returns
Intel Corporation (INTC) continues to pay dividends, with a current yield of 1.84% and a payout ratio of approximately 1.83, indicating a robust commitment to shareholder returns despite recent financial challenges. However, its dividend sustainability is a concern due to ongoing net losses. CEVA, Inc. does not pay dividends, prioritizing reinvestment for growth instead. It actively engages in share buybacks, which reflects a commitment to returning capital to shareholders. Overall, both companies’ strategies reflect different approaches to long-term value creation, with INTC facing potential risks in dividend sustainability, while CEVA focuses on growth opportunities.
Strategic Positioning
Intel Corporation (INTC) holds a commanding market share in the semiconductor industry, leveraging its diverse product segments to fend off competitive pressures. With a market cap of $158B, it operates in various high-growth areas, including AI and edge computing. CEVA, Inc. (CEVA) focuses on niche wireless connectivity and smart sensing technologies, facing intense competition from larger firms. Both companies must navigate technological disruptions, particularly in AI and 5G, to maintain their market positions effectively.
Stock Comparison
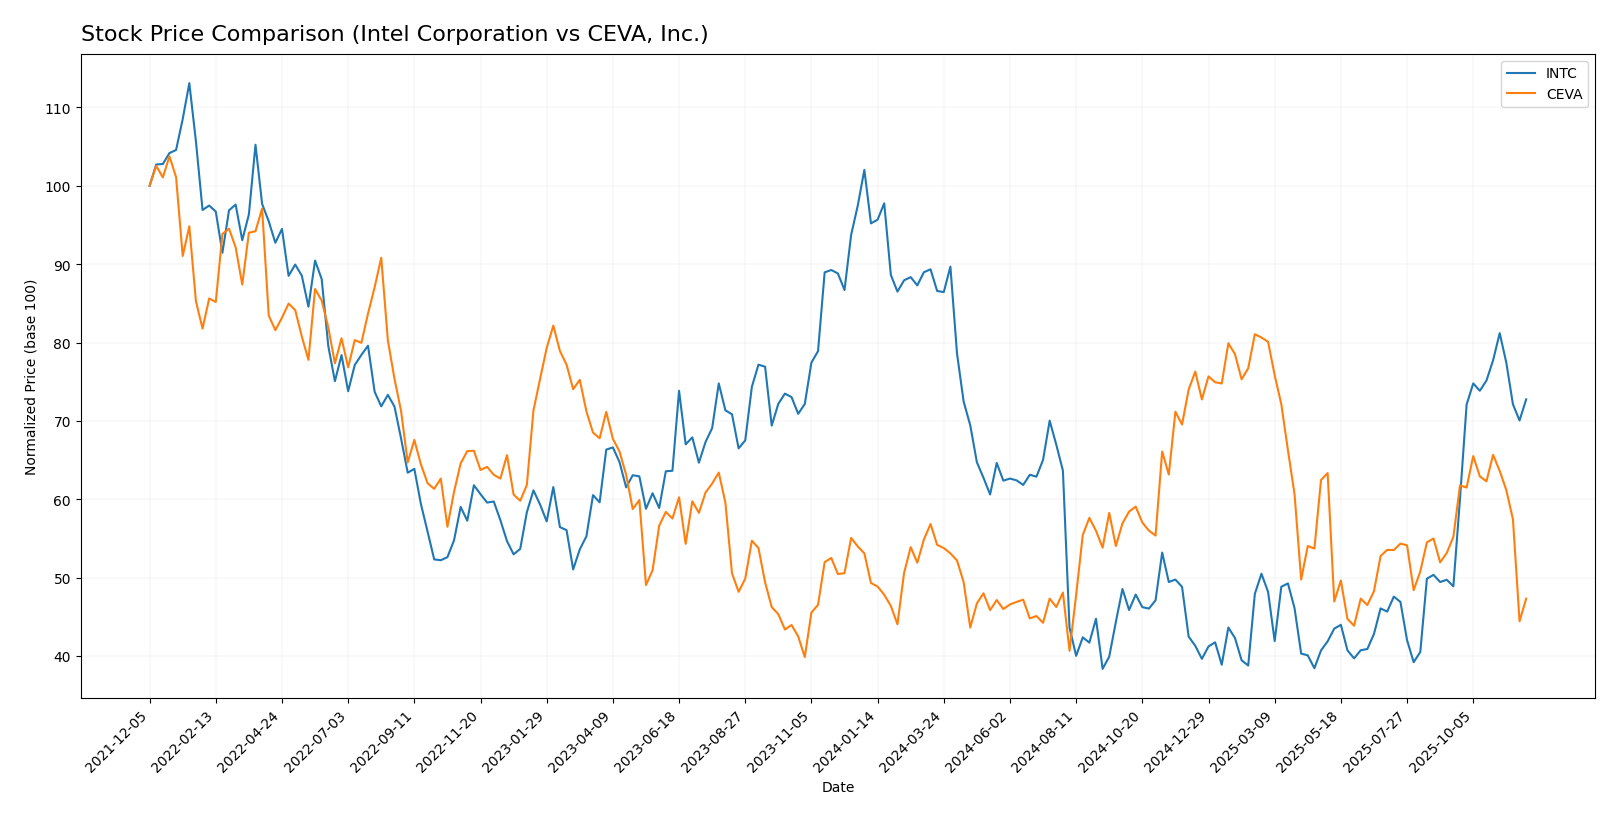
In this section, I will summarize the key price movements and trading dynamics of Intel Corporation (INTC) and CEVA, Inc. (CEVA) over the past year, highlighting significant price fluctuations and trends.
Trend Analysis
Intel Corporation (INTC) Over the past year, INTC’s stock has experienced a price change of -23.59%, indicating a bearish trend. The trend shows acceleration, with notable price fluctuations ranging from a high of 48.15 to a low of 18.89. The standard deviation of 8.47 suggests moderate volatility in the stock’s price movements.
CEVA, Inc. (CEVA) In contrast, CEVA’s stock has seen a price change of -4.03%, also reflecting a bearish trend, but with deceleration. The stock’s price fluctuated between a high of 34.67 and a low of 17.39. The standard deviation of 4.48 indicates lower volatility compared to INTC.
In summary, both stocks are currently in a bearish trend, with INTC showing greater price decline and volatility than CEVA. Investors should exercise caution and consider these trends when making investment decisions.
Analyst Opinions
Recent analyst recommendations for Intel Corporation (INTC) and CEVA, Inc. both reflect a cautious stance, with both companies receiving a rating of C+. Analysts highlight concerns regarding their return on equity and price-to-earnings ratios. For Intel, analysts suggest a hold position, citing its strong price-to-book score, while CEVA’s mixed performance leads to a similar hold recommendation. Overall, the consensus for both companies is a cautious hold for the current year, reflecting uncertainty in their growth prospects.
Stock Grades
In evaluating the latest stock grades, we find that both Intel Corporation (INTC) and CEVA, Inc. (CEVA) have received consistent ratings from reputable grading companies.
Intel Corporation Grades
| Grading Company | Action | New Grade | Date |
|---|---|---|---|
| Tigress Financial | maintain | Buy | 2025-11-04 |
| Barclays | maintain | Equal Weight | 2025-10-27 |
| Mizuho | maintain | Neutral | 2025-10-24 |
| Wedbush | maintain | Neutral | 2025-10-24 |
| Wells Fargo | maintain | Equal Weight | 2025-10-24 |
| Cantor Fitzgerald | maintain | Neutral | 2025-10-24 |
| Morgan Stanley | maintain | Equal Weight | 2025-10-24 |
| Truist Securities | maintain | Hold | 2025-10-24 |
| Rosenblatt | maintain | Sell | 2025-10-24 |
| JP Morgan | maintain | Underweight | 2025-10-24 |
CEVA, Inc. Grades
| Grading Company | Action | New Grade | Date |
|---|---|---|---|
| Barclays | maintain | Overweight | 2025-11-12 |
| Rosenblatt | maintain | Buy | 2025-11-11 |
| Rosenblatt | maintain | Buy | 2025-08-14 |
| Oppenheimer | maintain | Outperform | 2025-05-09 |
| Barclays | maintain | Overweight | 2025-05-08 |
| Rosenblatt | maintain | Buy | 2025-05-08 |
| Rosenblatt | maintain | Buy | 2025-04-23 |
| Rosenblatt | maintain | Buy | 2025-02-14 |
| Barclays | maintain | Overweight | 2025-02-14 |
| Rosenblatt | maintain | Buy | 2025-02-11 |
Overall, the trend in grades for both companies indicates stability, with multiple maintain ratings from respected analysts. Notably, CEVA has shown a stronger bias towards buy and outperform ratings, suggesting a more favorable outlook compared to Intel’s mixed ratings. As always, I recommend considering these grades within the broader context of market conditions and your investment strategy.
Target Prices
For Intel Corporation (INTC), reliable target price data indicates a consensus among analysts.
| Company | Target High | Target Low | Consensus |
|---|---|---|---|
| Intel Corporation | 52 | 20 | 35.22 |
The overall analyst expectations suggest a target price of 35.22, which is slightly below the current stock price of 35.83, indicating a cautious outlook. Unfortunately, no verified target price data is available for CEVA, Inc. (CEVA).
Strengths and Weaknesses
The following table outlines the strengths and weaknesses of Intel Corporation (INTC) and CEVA, Inc. (CEVA) based on their most recent performance metrics.
| Criterion | Intel Corporation (INTC) | CEVA, Inc. (CEVA) |
|---|---|---|
| Diversification | High (multiple segments) | Moderate (focused on DSPs) |
| Profitability | Low (negative margins) | Low (negative margins) |
| Innovation | Strong (AI partnerships) | Moderate (growing DSP market) |
| Global presence | Strong (global operations) | Moderate (limited to tech sector) |
| Market Share | High (semiconductor market) | Low (niche market) |
| Debt level | Moderate (debt to equity: 0.47) | Low (debt to equity: 0.02) |
Key takeaways indicate that while Intel demonstrates a strong market presence and diversification, it faces significant profitability challenges. CEVA, although less diversified and with a smaller market share, maintains a low debt level, which may appeal to risk-averse investors.
Risk Analysis
In this section, I will present a comprehensive overview of the key risks associated with Intel Corporation (INTC) and CEVA, Inc. (CEVA).
| Metric | Intel Corporation (INTC) | CEVA, Inc. (CEVA) |
|---|---|---|
| Market Risk | High – Fluctuations in semiconductor demand and competition | Moderate – Niche market but susceptible to tech demand changes |
| Regulatory Risk | Moderate – Compliance with tech regulations | Low – Limited regulatory exposure |
| Operational Risk | High – Supply chain disruptions | Moderate – Dependence on third-party manufacturers |
| Environmental Risk | Moderate – Environmental regulations impact operations | Low – Minimal environmental impact |
| Geopolitical Risk | High – Global trade tensions affect supply chain | Moderate – Limited international exposure |
Both companies face significant market and operational risks, particularly in the semiconductor industry. Intel’s exposure to global trade tensions and CEVA’s niche market demand fluctuations are crucial factors to consider for investors.
Which one to choose?
In comparing Intel Corporation (INTC) and CEVA, Inc. (CEVA), both companies exhibit challenges. Intel’s recent financials show a market cap of $86.8B and a net income of -$18.8B for FY 2024, reflecting ongoing profitability issues, evidenced by a net profit margin of -35.3%. In contrast, CEVA, with a market cap of $744.99M, reported revenue of $106.9M but also incurred net losses, with a negative net income margin of -8.2%. Both companies hold a rating of C+, indicating that neither stands out significantly.
For growth-oriented investors, Intel may seem appealing due to its extensive market presence, while those focused on stability might lean towards CEVA, given its smaller operational footprint and lower debt levels. However, both face risks related to competition and market dependence.
Disclaimer: This article is not financial advice. Each investor is responsible for their own investment decisions.
Go further
I encourage you to read the complete analyses of Intel Corporation and CEVA, Inc. to enhance your investment decisions: