In today’s dynamic tech landscape, EPAM Systems, Inc. and ServiceTitan, Inc. stand out as innovative players within the Information Technology Services and Software Application sectors, respectively. Both companies are at the forefront of digital transformation, serving overlapping markets that prioritize efficiency and automation. As we delve into their business models, growth strategies, and market positions, I invite you to explore which of these companies may present the most compelling investment opportunity for your portfolio.
Table of contents
Company Overview
EPAM Overview
EPAM Systems, Inc. is a leader in digital platform engineering and software development services, founded in 1993 and based in Newtown, Pennsylvania. The company specializes in a wide array of engineering services, including platform selection, customization, and integration. EPAM caters to diverse industries such as financial services, healthcare, and technology, providing solutions that extend from application development to smart automation and consulting. With a market capitalization of approximately $10.2B, EPAM is positioned as a key player in the information technology services sector and is known for its extensive global reach and innovation-driven approach.
ServiceTitan Overview
ServiceTitan, Inc., established in 2008 and headquartered in Glendale, California, focuses on optimizing field service management for residential and commercial infrastructure. The company offers a comprehensive software solution that streamlines installation, maintenance, and service activities. With a market cap of about $8.4B, ServiceTitan serves various trades, positioning itself as a pivotal player in the software application industry. The firm’s emphasis on enhancing operational efficiency for service providers sets it apart in a competitive market.
Key similarities between EPAM and ServiceTitan include their technological focus and commitment to serving specific industry needs. However, they differ significantly in their business models: EPAM offers a broad range of IT services across multiple sectors, while ServiceTitan specializes in field service management solutions for specific trades.
Income Statement Comparison
The table below summarizes the most recent income statement metrics for EPAM Systems, Inc. and ServiceTitan, Inc., providing a clear comparison of their financial performance.
| Metric | EPAM Systems, Inc. | ServiceTitan, Inc. |
|---|---|---|
| Revenue | 4.73B | 771.88M |
| EBITDA | 671.69M | -141.04M |
| EBIT | 544.58M | -221.26M |
| Net Income | 454.53M | -239.09M |
| EPS | 7.93 | -8.53 |
Interpretation of Income Statement
In the most recent fiscal year, EPAM showed a slight increase in revenue to 4.73B, alongside a net income of 454.53M, indicating a stable performance. Margins have remained robust, with EBITDA improving to 671.69M. In contrast, ServiceTitan is facing challenges, reporting a revenue of 771.88M but a significant net loss of 239.09M. The negative EBITDA of -141.04M suggests ongoing operational difficulties, highlighting a need for strategic adjustments to improve profitability and stabilize their financial position.
Financial Ratios Comparison
Below is a comparative table showing the most recent revenue and key financial ratios for EPAM Systems, Inc. and ServiceTitan, Inc.
| Metric | EPAM | ServiceTitan |
|---|---|---|
| ROE | 12.52% | -16.44% |
| ROIC | 10.67% | -14.25% |
| P/E | 29.47 | -18.12 |
| P/B | 3.69 | 2.98 |
| Current Ratio | 2.96 | 3.74 |
| Quick Ratio | 2.96 | 3.74 |
| D/E | 0.045 | 0.114 |
| Debt-to-Assets | 0.034 | 0.093 |
| Interest Coverage | N/A | N/A |
| Asset Turnover | 0.995 | 0.436 |
| Fixed Asset Turnover | 14.07 | 9.57 |
| Payout ratio | 0% | 0% |
| Dividend yield | 0% | 0% |
Interpretation of Financial Ratios
EPAM shows stronger financial health with a positive ROE and ROIC, indicating effective use of equity and capital. Its P/E and P/B ratios suggest it is more favorably valued compared to ServiceTitan. The latter, however, faces significant challenges reflected in negative profitability ratios, highlighting concerns around operational efficiency and debt management. Investors should approach ServiceTitan with caution due to its ongoing financial struggles.
Dividend and Shareholder Returns
EPAM Systems, Inc. does not pay dividends, opting instead to reinvest earnings into growth opportunities. This aligns with its expansion strategy, as demonstrated by consistent revenue growth. The company engages in share buybacks, reflecting confidence in its stock valuation. In contrast, ServiceTitan, Inc. also refrains from dividend payments due to negative net income and prioritizes R&D. However, its financial health raises concerns. Both companies’ lack of dividends does not hinder long-term value creation, but caution is warranted as they navigate their growth trajectories.
Strategic Positioning
EPAM Systems, Inc. (EPAM) holds a significant market share in the Information Technology Services sector, specializing in digital platform engineering and software development. With a market cap of $10.2B, it faces competitive pressure from emerging technologies and established companies. Conversely, ServiceTitan, Inc. (TTAN), valued at $8.4B, focuses on field service management software, competing in a niche market. Both companies must navigate technological disruptions to maintain their competitive edge and market positions.
Stock Comparison
In this section, I will provide a comparative analysis of the stock price movements and trading dynamics of EPAM Systems, Inc. (EPAM) and ServiceTitan, Inc. (TTAN) over the past year, highlighting key price fluctuations.
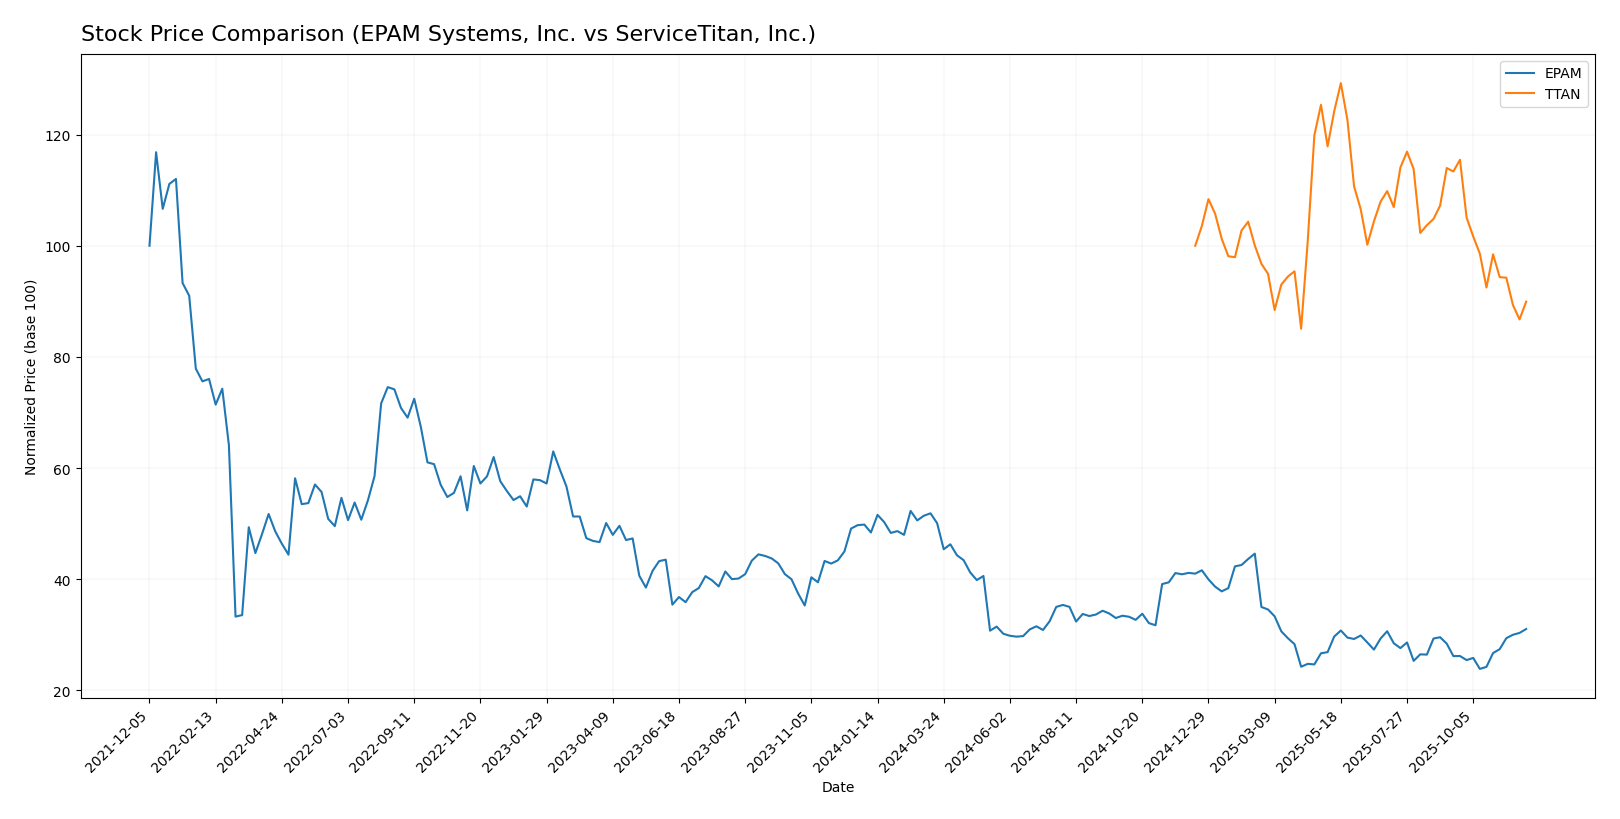
Trend Analysis
EPAM Systems, Inc. (EPAM) Over the past year, EPAM’s stock has experienced a significant decline, with a percentage change of -35.89%. This indicates a bearish trend, characterized by acceleration. The stock reached a notable high of 311.98 and a low of 142.38. The standard deviation of 46.0 suggests considerable volatility in its price movements. However, in the recent period from September 14, 2025, to November 30, 2025, the stock has shown a positive short-term change of 18.64%, with a trend slope of 3.21, indicating a potential recovery.
ServiceTitan, Inc. (TTAN) TTAN has also faced challenges, with an overall percentage change of -10.06%, reflecting a bearish trend with deceleration. The stock has fluctuated between a high of 129.26 and a low of 85.07. The standard deviation of 10.27 points to some volatility. In the recent period from September 14, 2025, to November 30, 2025, TTAN’s stock has declined by -20.67%, with a trend slope of -2.34, suggesting a continued downward trajectory.
Analyst Opinions
Recent analyst recommendations indicate a divided outlook for EPAM Systems, Inc. and ServiceTitan, Inc. Analysts have rated EPAM as a “B+” with a consensus to buy, highlighting strong fundamentals like a solid return on assets and equity, despite a lower price-to-earnings score. In contrast, ServiceTitan has received a “C-” rating, suggesting a sell, as analysts point to weak performance across key metrics, including discounted cash flow and return on equity. Therefore, the consensus for EPAM is a buy, while ServiceTitan leans towards a sell for this year.
Stock Grades
In this section, we will review the latest stock grades for two companies: EPAM Systems, Inc. and ServiceTitan, Inc. Both companies have received consistent ratings from reliable grading firms.
EPAM Systems, Inc. Grades
| Grading Company | Action | New Grade | Date |
|---|---|---|---|
| Mizuho | maintain | Outperform | 2025-11-11 |
| JP Morgan | maintain | Overweight | 2025-11-07 |
| Morgan Stanley | maintain | Equal Weight | 2025-09-09 |
| JP Morgan | maintain | Overweight | 2025-08-20 |
| Barclays | maintain | Overweight | 2025-05-12 |
| Needham | maintain | Buy | 2025-05-09 |
| Guggenheim | maintain | Buy | 2025-05-09 |
| Piper Sandler | maintain | Neutral | 2025-05-09 |
| Morgan Stanley | maintain | Equal Weight | 2025-05-09 |
| Stifel | maintain | Buy | 2025-05-02 |
ServiceTitan, Inc. Grades
| Grading Company | Action | New Grade | Date |
|---|---|---|---|
| BMO Capital | maintain | Outperform | 2025-11-20 |
| Wells Fargo | maintain | Overweight | 2025-09-19 |
| Stifel | maintain | Buy | 2025-09-19 |
| Canaccord Genuity | maintain | Buy | 2025-09-19 |
| Piper Sandler | maintain | Overweight | 2025-09-19 |
| Citigroup | maintain | Neutral | 2025-09-09 |
| Piper Sandler | maintain | Overweight | 2025-09-05 |
| Needham | maintain | Buy | 2025-09-05 |
| Morgan Stanley | maintain | Equal Weight | 2025-09-05 |
| Truist Securities | maintain | Buy | 2025-09-05 |
Overall, the trend in grades for both companies shows a strong emphasis on maintaining positive ratings, with several firms reiterating their “Outperform” and “Buy” recommendations. This indicates a generally favorable sentiment towards both EPAM and ServiceTitan in the current market environment.
Target Prices
The current consensus target prices for EPAM Systems, Inc. and ServiceTitan, Inc. reflect optimistic expectations from analysts.
| Company | Target High | Target Low | Consensus |
|---|---|---|---|
| EPAM Systems, Inc. | 185 | 175 | 180 |
| ServiceTitan, Inc. | 145 | 115 | 132.57 |
The target consensus for EPAM is slightly above its current price of 184.56, suggesting a potential for growth. Meanwhile, ServiceTitan’s consensus target of 132.57 indicates a significant upside from its current price of 90.08.
Strengths and Weaknesses
The following table outlines the strengths and weaknesses of EPAM Systems, Inc. (EPAM) and ServiceTitan, Inc. (TTAN), providing a clear comparison of their performance metrics.
| Criterion | EPAM Systems, Inc. | ServiceTitan, Inc. |
|---|---|---|
| Diversification | High | Medium |
| Profitability | Moderate | Low |
| Innovation | Strong | Moderate |
| Global presence | Strong | Limited |
| Market Share | 5.5% | 2.1% |
| Debt level | Low (3.4%) | Moderate (16.2%) |
Key takeaways indicate that EPAM has a robust global presence and lower debt level, which may offer a more stable investment compared to ServiceTitan, which is currently struggling with profitability and higher debt.
Risk Analysis
In the following table, I summarize the key risks associated with two companies, EPAM Systems, Inc. and ServiceTitan, Inc., based on the most recent data available.
| Metric | EPAM Systems, Inc. | ServiceTitan, Inc. |
|---|---|---|
| Market Risk | Moderate | High |
| Regulatory Risk | Moderate | High |
| Operational Risk | Low | High |
| Environmental Risk | Low | Moderate |
| Geopolitical Risk | Moderate | Moderate |
EPAM faces moderate market and regulatory risks, while ServiceTitan exhibits higher operational and regulatory concerns, reflected in its negative profit margins. Recent reports indicate ServiceTitan’s operational challenges may impact its growth trajectory significantly.
Which one to choose?
When comparing EPAM Systems, Inc. (EPAM) and ServiceTitan, Inc. (TTAN), EPAM seems to present a stronger profile for investors. EPAM boasts a market cap of 13.4B and a solid gross profit margin of approximately 31%, alongside a favorable B+ rating from analysts. Its recent stock trend shows a 18.64% rebound, indicating potential recovery after previous bearish behavior. In contrast, TTAN has struggled, with a C- rating and negative profit margins. Its revenue growth is hindered by high operational costs, reflected in its significant losses.
For growth-oriented investors, EPAM appears to be the more promising option. However, those seeking stability might favor TTAN for its lower volatility, despite its current challenges.
Investors should be cautious of industry competition and potential market fluctuations affecting both companies.
Disclaimer: This article is not financial advice. Each investor is responsible for their own investment decisions.
Go further
I encourage you to read the complete analyses of EPAM Systems, Inc. and ServiceTitan, Inc. to enhance your investment decisions: