In a world where productivity is paramount, Asana, Inc. revolutionizes how teams collaborate and achieve their goals. With its innovative work management platform, Asana empowers individuals and organizations across various sectors—from technology to healthcare—to streamline their workflows and elevate performance. Renowned for its commitment to quality and user-centric design, Asana continues to shape the software application landscape. As we delve into this analysis, I invite you to consider whether Asana’s strong fundamentals and growth trajectory still justify its current market valuation.

Table of contents
Company Description
Asana, Inc. is a leading player in the software application sector, specializing in work management solutions for teams and organizations. Founded in 2008 and headquartered in San Francisco, California, Asana offers a robust platform that facilitates the organization of tasks, strategic initiatives, and project management across various industries, including technology, healthcare, and education. With a market capitalization of approximately $2.92B, the company has established a strong presence in both U.S. and international markets. Asana’s innovative approach empowers teams to enhance productivity and collaboration, positioning it as a key influencer in shaping modern work ecosystems.
Fundamental Analysis
In this section, I will analyze Asana, Inc.’s income statement, financial ratios, and dividend payout policy to assess its financial health and investment potential.
Income Statement
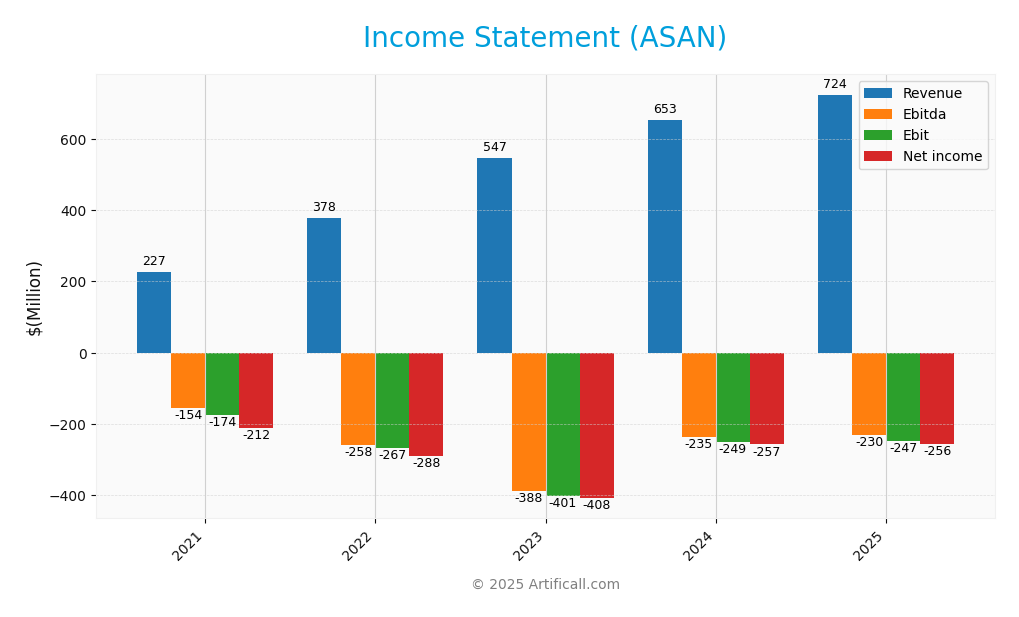
The following table summarizes Asana, Inc.’s income statement for the fiscal years 2021 to 2025, highlighting key financial metrics.
| Metric | 2021 | 2022 | 2023 | 2024 | 2025 |
|---|---|---|---|---|---|
| Revenue | 227M | 378M | 547M | 653M | 724M |
| Cost of Revenue | 29M | 39M | 57M | 65M | 77M |
| Operating Expenses | 374M | 605M | 898M | 858M | 913M |
| Gross Profit | 198M | 340M | 491M | 588M | 647M |
| EBITDA | -154M | -258M | -388M | -235M | -230M |
| EBIT | -174M | -267M | -401M | -249M | -247M |
| Interest Expense | 36M | 18M | 2M | 4M | 4M |
| Net Income | -212M | -288M | -408M | -257M | -256M |
| EPS | -1.31 | -1.63 | -2.04 | -1.17 | -1.11 |
| Filing Date | 2021-03-30 | 2022-03-24 | 2023-03-24 | 2024-03-14 | 2025-03-18 |
Interpretation of Income Statement
Asana, Inc. has shown consistent revenue growth over the past five years, increasing from 227M in 2021 to 724M in 2025. However, net income remains negative, reflecting ongoing challenges, with losses slightly decreasing from -288M in 2022 to -256M in 2025. The gross profit margin has remained relatively stable, while operating expenses have fluctuated, indicating ongoing investments in growth. The most recent year shows a modest improvement in EPS and a reduction in net losses, suggesting potential for future profitability if revenue growth continues and costs can be effectively managed.
Financial Ratios
The following table summarizes the key financial ratios for Asana, Inc. (ticker: ASAN) over the last few fiscal years.
| Ratios | 2021 | 2022 | 2023 | 2024 | 2025 |
|---|---|---|---|---|---|
| Net Margin | -93.26% | -76.19% | -74.52% | -39.39% | -35.30% |
| ROE | -1,655.41% | -141.46% | -114.36% | -78.75% | -112.31% |
| ROIC | -30.70% | -56.23% | -63.28% | -44.62% | -54.04% |
| P/E | -27.05 | -32.11 | -7.60 | -14.94 | -19.16 |
| P/B | -447.74 | 45.42 | 8.70 | 11.76 | 21.52 |
| Current Ratio | 2.73 | 1.61 | 1.99 | 1.80 | 1.44 |
| Quick Ratio | 2.73 | 1.61 | 1.99 | 1.80 | 1.44 |
| D/E | -45.81 | 1.25 | 0.76 | 0.85 | 1.18 |
| Debt-to-Assets | 80.13% | 36.15% | 28.43% | 28.89% | 30.11% |
| Interest Coverage | -4.85 | -14.42 | -203.91 | -68.32 | -72.42 |
| Asset Turnover | 0.31 | 0.54 | 0.57 | 0.68 | 0.81 |
| Fixed Asset Turnover | 0.88 | 1.38 | 2.02 | 2.34 | 2.76 |
| Dividend Yield | 0% | 0% | 0% | 0% | 0% |
Interpretation of Financial Ratios
Asana, Inc. (ASAN) shows mixed financial health based on its ratios for FY 2025. The liquidity ratios indicate a current ratio of 1.44 and a quick ratio of 1.44, suggesting adequate short-term liquidity. However, the solvency ratio stands at -0.36, raising concerns about long-term financial stability. Profitability ratios are significantly weak, with a net profit margin of -35.3% and an EBIT margin of -34.1%, reflecting ongoing losses. Efficiency ratios like receivables turnover (8.27) are decent, but the debt-to-equity ratio of 1.18 and high price-to-book ratio (21.52) indicate potential overvaluation and high leverage. Overall, while there are strengths in liquidity and efficiency, the weak profitability and solvency ratios present substantial risks for investors.
Evolution of Financial Ratios
Over the past five years, Asana’s financial ratios have shown a declining trend in profitability, with net profit margins worsening from -76.1% in 2022 to -35.3% in 2025. Liquidity ratios have remained relatively stable, suggesting some resilience amidst increasing operational challenges.
Distribution Policy
Asana, Inc. (ASAN) does not currently pay dividends, reflecting its focus on reinvestment strategies and a high growth phase. The company is channeling funds into research and development and acquisitions to enhance its competitive positioning. Although there are no dividends, ASAN is engaging in share buybacks, which may support shareholder value. This strategy aligns with long-term growth potential, but investors should be cautious about the risks of continued losses and cash flow challenges. Overall, the lack of dividends appears to support sustainable long-term value creation if managed effectively.
Sector Analysis
Asana, Inc. operates in the software application industry, offering a work management platform that enhances team collaboration and productivity. Its competitive advantages include strong integration capabilities and a diverse customer base across various sectors.
Strategic Positioning
Asana, Inc. (ticker: ASAN) holds a competitive position within the software application industry, focusing on work management platforms. With a market cap of approximately $2.92B, it faces significant competitive pressure from established players and emerging startups. Currently, Asana’s market share is impacted by growing technological disruption, particularly in AI-driven project management tools. Benchmarking against competitors indicates a need for innovation and enhanced user experience to maintain its foothold as a leader in this space. Asana’s current price of $12.375 reflects these market dynamics, underscoring the importance of strategic positioning in navigating the ever-evolving landscape.
Key Products
Asana, Inc. offers a range of products designed to enhance productivity and collaboration within organizations. Below is a summary of their key products:
| Product | Description |
|---|---|
| Asana Basic | A free version of the platform allowing individuals and small teams to manage tasks and projects effectively. |
| Asana Premium | A paid tier offering advanced features like timeline views, reporting, and priority support for teams looking to enhance their productivity. |
| Asana Business | This version includes all Premium features plus advanced integrations, custom rules, and enhanced security features, ideal for larger organizations. |
| Asana Enterprise | Tailored for large enterprises, this product provides custom solutions, dedicated support, and enhanced compliance features to meet specific organizational needs. |
| Asana for Education | A specialized version designed for educational institutions, helping teachers and students manage projects and assignments effectively. |
These products illustrate Asana’s commitment to providing flexible solutions for varied user needs in different sectors, enhancing collaboration and efficiency.
Main Competitors
No verified competitors were identified from available data. Asana, Inc. is currently positioned in the software application sector with an estimated market share that reflects its role as a significant player in work management solutions. The company operates primarily in the United States but also caters to an international clientele across various industries, suggesting a strong competitive position and potential for sector dominance within its niche.
Competitive Advantages
Asana, Inc. possesses several competitive advantages that position it well for future growth. Its robust work management platform caters to diverse industries, allowing teams to efficiently manage tasks and strategic initiatives. This versatility opens up opportunities for new product features and integrations, enhancing user experience. Furthermore, Asana’s focus on scalability positions it to tap into emerging markets, particularly in sectors such as healthcare and education, which are increasingly adopting digital solutions. With a solid market cap of 2.92B and potential for expansion, Asana is well-placed for future success.
SWOT Analysis
This SWOT analysis evaluates Asana, Inc. to identify its strengths, weaknesses, opportunities, and threats, aiding in strategic decision-making.
Strengths
- Strong brand recognition
- Diverse customer base
- Innovative platform features
Weaknesses
- No dividend payments
- Dependence on subscription revenue
- Competitive market
Opportunities
- Growing demand for remote work solutions
- Expansion into new markets
- Partnerships with tech firms
Threats
- Intense competition
- Economic downturns
- Rapid technological changes
Overall, Asana’s strengths and opportunities position it well for growth, but it must address its weaknesses and navigate potential threats to maintain its competitive edge. Strategic focus on innovation and market expansion will be critical for its success.
Stock Analysis
Asana, Inc. (ASAN) has experienced significant price movements over the past year, with a notable downturn in its stock value. This analysis will delve into the key dynamics influencing its trading activities.

Trend Analysis
Over the past year, Asana’s stock has seen a percentage change of -26.69%. This indicates a bearish trend in the stock price, characterized by a substantial decline from its highest price of 24.15 to a lowest price of 11.53. The trend is also showing signs of deceleration, suggesting that the downward momentum may be weakening despite the overall negative outlook. The standard deviation of 2.93 indicates a moderate level of volatility in the stock’s price movements.
Volume Analysis
In the last three months, Asana’s trading volume has been 1.65B, with seller-driven activity dominating the market, as indicated by a seller volume of 916.18M compared to a buyer volume of 721.30M. The overall volume trend is increasing, which suggests heightened market participation. However, the buyer dominance percentage is only 43.8%, reflecting a prevailing sentiment among investors that leans more towards selling, potentially indicating caution in future price movements.
Analyst Opinions
Recent analyst recommendations for Asana, Inc. (ASAN) have generally been cautious, with a consensus rating of “sell.” Analysts have highlighted concerns over the company’s financial metrics, including a disappointing D+ rating from several sources. Key arguments from analysts suggest that Asana’s return on equity and assets remain weak, which raises red flags about its profitability and growth potential. Given these evaluations, I advise investors to carefully consider their positions in ASAN and monitor for any significant changes in the company’s performance.
Stock Grades
Asana, Inc. (ASAN) has recently received evaluations from several reputable grading companies. Below is a summary of the latest stock grades:
| Grading Company | Action | New Grade | Date |
|---|---|---|---|
| Baird | Maintain | Neutral | 2025-09-04 |
| Morgan Stanley | Maintain | Underweight | 2025-09-04 |
| Piper Sandler | Maintain | Overweight | 2025-09-04 |
| Baird | Maintain | Neutral | 2025-06-04 |
| UBS | Maintain | Neutral | 2025-06-04 |
| Jefferies | Maintain | Hold | 2025-06-04 |
| RBC Capital | Maintain | Underperform | 2025-06-04 |
| Morgan Stanley | Maintain | Underweight | 2025-06-04 |
| JMP Securities | Maintain | Market Outperform | 2025-06-04 |
| B of A Securities | Maintain | Buy | 2025-06-04 |
The overall trend in grades for Asana shows a predominance of “Maintain” ratings, indicating a cautious sentiment among analysts. Notably, the presence of both “Underweight” and “Overweight” grades reflects a divergence in outlook, suggesting a mixed perspective on the stock’s future performance.
Target Prices
The consensus target prices for Asana, Inc. indicate a range of expectations among analysts.
| Target High | Target Low | Consensus |
|---|---|---|
| 88 | 10 | 23.41 |
Analysts anticipate a significant potential upside, with a consensus target price of 23.41, reflecting varied expectations in the market.
Consumer Opinions
Consumer sentiment around Asana, Inc. (ASAN) reflects a mix of enthusiasm for its productivity tools and concerns regarding its pricing structure.
| Positive Reviews | Negative Reviews |
|---|---|
| “Asana has transformed our team’s workflow!” | “The pricing is a bit steep for small teams.” |
| “Excellent user interface and features.” | “Customer support could be improved.” |
| “Great for project management and collaboration.” | “Some features feel overwhelming and complex.” |
Overall, consumer feedback highlights Asana’s effective project management capabilities and user-friendly interface, while concerns about pricing and customer support persist.
Risk Analysis
In this section, I will outline key risks associated with investing in Asana, Inc. (ASAN) that could affect your investment decisions.
| Category | Description | Probability | Impact |
|---|---|---|---|
| Market Volatility | Fluctuations in the tech sector can affect stock prices. | High | High |
| Competition | Intense competition from other project management tools. | High | Medium |
| Regulatory Risks | Potential changes in data privacy laws impacting operations. | Medium | High |
| Financial Health | Dependence on continued revenue growth and profitability. | Medium | High |
| Technological Changes | Rapid tech advancements could outpace Asana’s developments. | Medium | Medium |
As of 2025, Asana faces high competition in a volatile market, with significant impacts on its financial stability and growth potential. Staying informed about these dynamics is crucial for sound investment decisions.
Should You Buy Asana, Inc.?
Asana, Inc. is currently experiencing negative profitability with a net income of -255.54M, indicating a negative net margin of -35.30%. The company has a total debt of 268.39M, which contributes to a debt-to-equity ratio of 0.95, suggesting a moderate level of financial leverage. The company’s fundamentals show a bearish long-term trend, with a recent overall rating of D+.
Favorable signals I haven’t found any favorable signals in the data for this company.
Unfavorable signals Asana is facing significant challenges, including a negative net margin of -35.30%, indicating persistent losses. The company has a debt-to-equity ratio of 0.95, which suggests a relatively high level of debt compared to its equity. The overall long-term trend is bearish, with a price change of -26.69%. Additionally, the recent selling volume exceeds the buying volume, showing a lack of buyer interest.
Conclusion Given the negative net margin and the unfavorable trend, it might be more prudent to wait for signs of recovery before considering any investment in Asana, Inc.
Additional Resources
- Asana to Announce Third Quarter Fiscal Year 2026 Financial Results on Tuesday, December 2, 2025 – Asana (Nov 03, 2025)
- Asana, Inc. $ASAN Shares Purchased by Neo Ivy Capital Management – MarketBeat (Nov 22, 2025)
- FedRAMP Push Could Be a Game Changer for Asana’s (ASAN) Public Sector Ambitions – Yahoo Finance Singapore (Nov 22, 2025)
- Asana (NYSE: ASAN) Debuts Asana Gov FedRAMP Platform for U.S. Public Sector Agencies – Stock Titan (Nov 19, 2025)
- Asana Inc – Announces Asana Gov, A Fedramp-In-Process Platform – TradingView (Nov 19, 2025)
For more information about Asana, Inc., please visit the official website: asana.com