
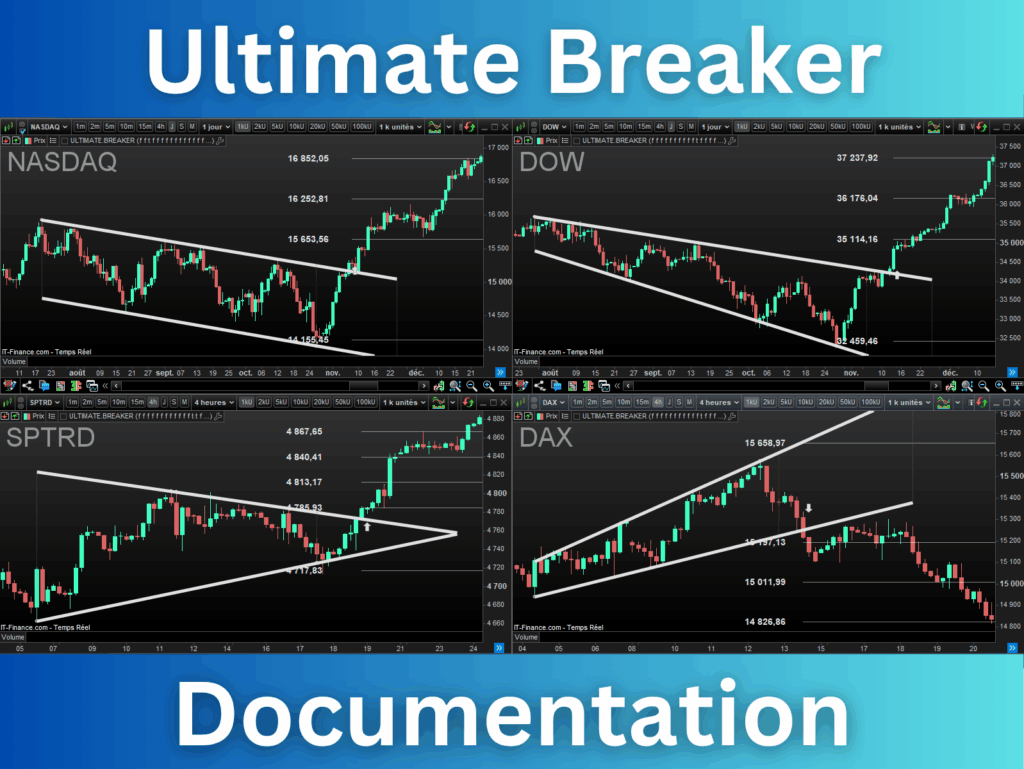
Ultimate Breaker Documentation
The Ultimate Breaker is an indicator that works on the ProRealTime platform. It detects the bullish and bearish breakouts on the leading trading figures. The indicator displays buying and selling signals on the price chart, along with their targets and stop-loss levels.
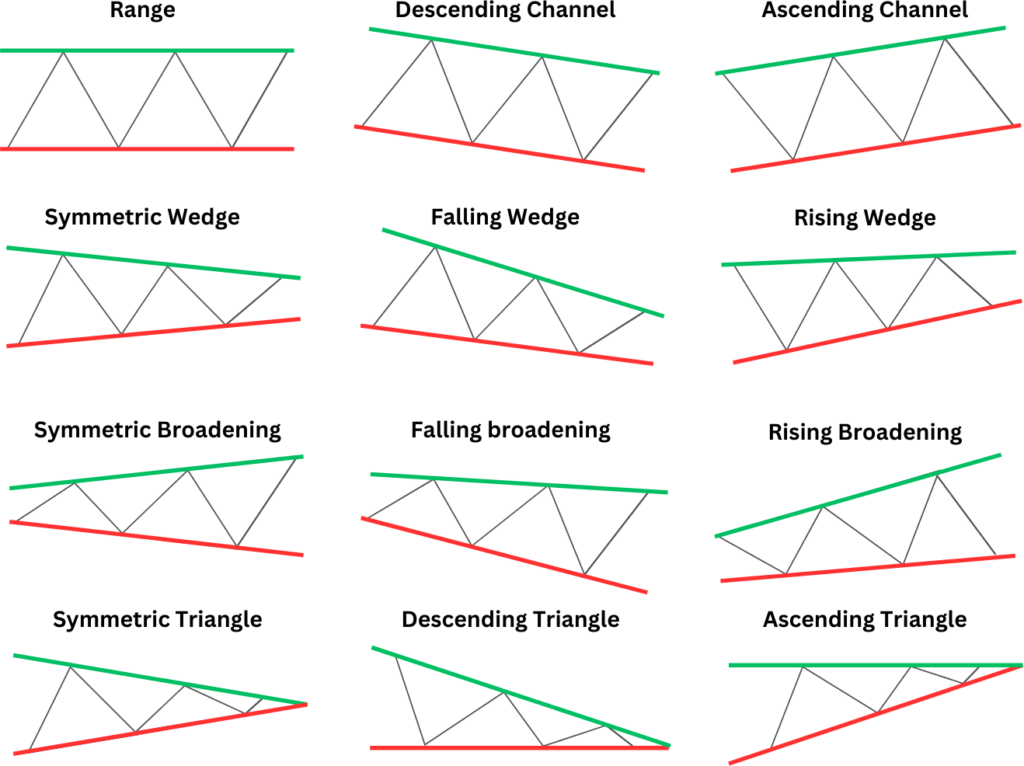
What patterns does the indicator recognize?
The indicator recognizes the twelve most commonly used figures by traders. They are derived from the four main patterns: channels, wedges, broadening, and triangles. These figures can be horizontal, descending, or ascending:
Indicator installation
The installation of the indicator on the Prorealtime platform is easy and quick. Here are the installation steps:
1. Get the Ultimate Breaker
The Ultimate Breaker is available on the Prorealcode Marketplace. You can get the indicator on this page:
https://market.prorealcode.com/product/ultimate-breaker
2. Get the license number
- go into your “My Account” page
- click on “My Products” tab
- copy the license number
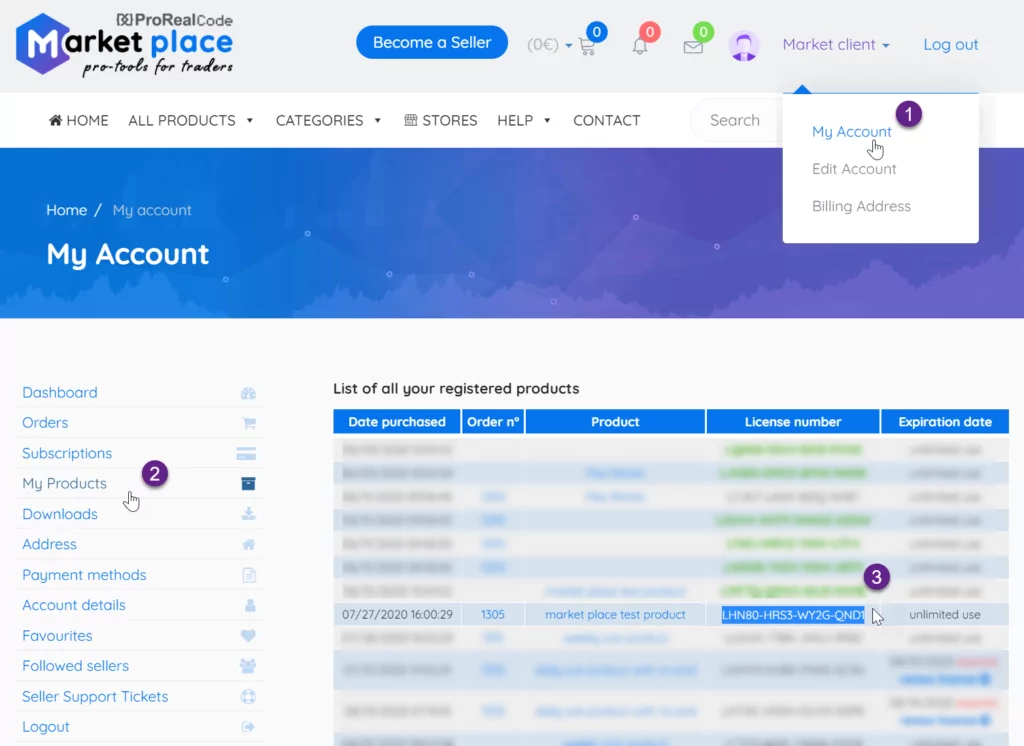
Note: Your license is also sent to you by email, check your “spam” folder if necessary.
3. Install the license in ProRealTime
Adding products to your trading platform is easy!
- open the indicators & trading systems window and click on the “MarketPlace” button
- paste or retype the license number in the text field and click on OK
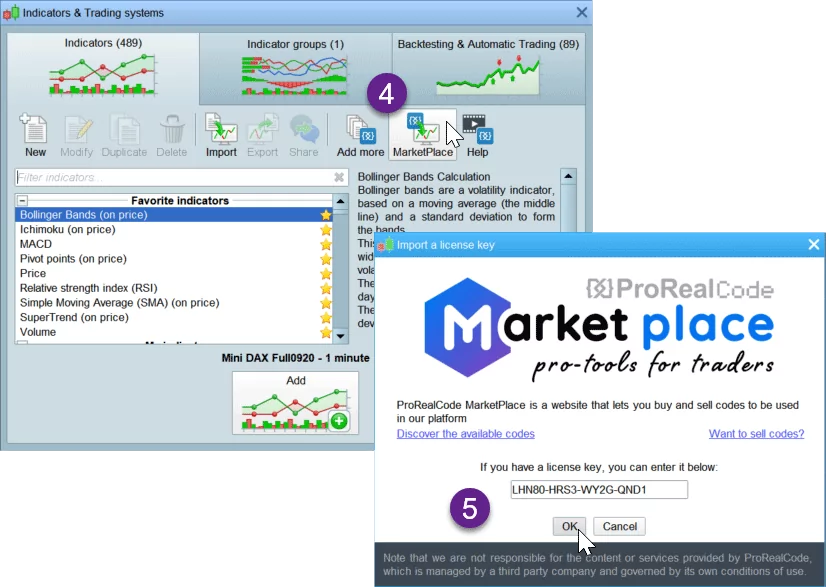
Find your newly installed product in the “ProRealCode MarketPlace” indicators list.
Why does the price chart become flattened after loading the indicator?
The indicator returns buy and sell signals. This allows you to use the indicator to create alerts and backtests. It returns 1 for buy signals and -1 for sell signals.
These values are displayed by default on the price chart. This automatically adjusts the chart size, making it flattened.
To avoid having to readjust the price chart, follow these steps:
- Open the indicator configuration window
- Scroll to the bottom of the window
- Uncheck the box corresponding to the signal (which can be named “Signal”, “Breakout”, “Crossing”, etc.)
If the problem persists, you can uncheck the stoploss and targets. The indicator already displays these.
Indicator starting
You can use the indicator on any asset as a stock, index, or ETF. The following steps show you how to start the Ultimate Breaker indicator:
- Open the price chart of an asset
You need to open the price window of the asset on which you want to run the indicator. To do so, click on an asset in your list to open the price chart on the Prorealtime platform.
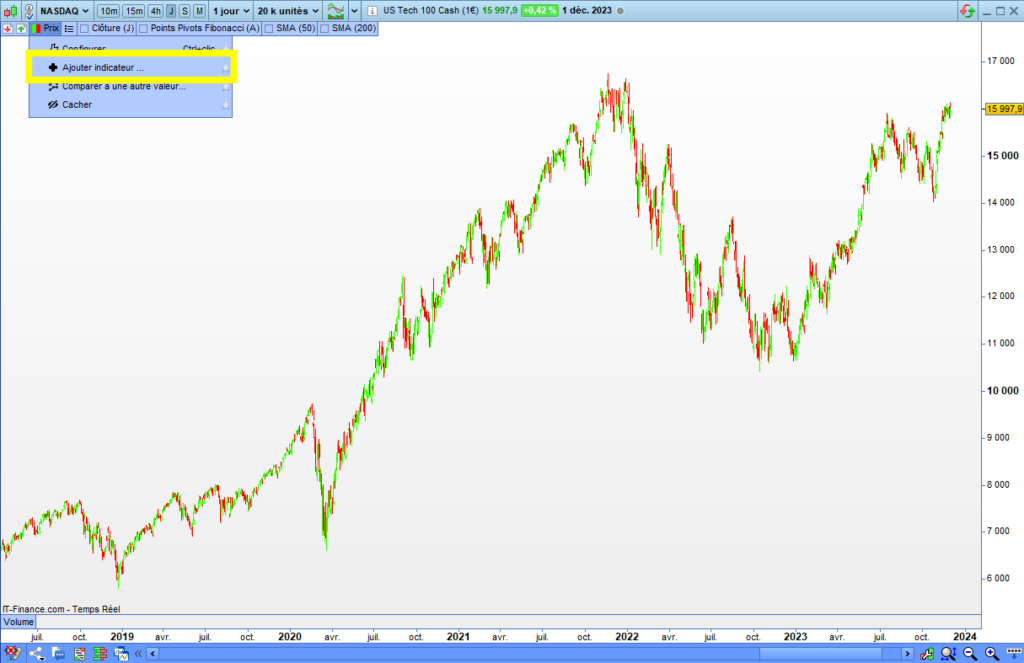
- Click on the “Price” icon
The Ultimate Breaker will display data on the price chart. You must run it in the graphical mode. To do so, you must click on the “Price” icon on the top-left of the price chart window:
- Click on “Add an indicator”
A drop-down list will appear after clicking the “Price” icon. Click on “Add an indicator“:
- Type “ULTIMATE.BREAKER” in the search bar
A window will appear after clicking on “Add an indicator“.
Start to type “Ultimate Breaker” in the search bar on the top-right of the window:
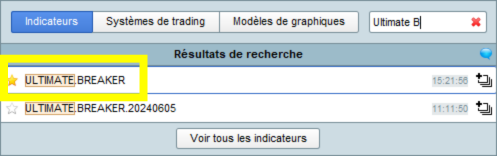
Click on the “ULTIMATE.BREAKER” indicator to run it on the price chart.
Indicator setting
Setting panel
The setting panel will allow you to make sure the indicator meets your requirements. You will choose the figures you want to trade, tweak the signals, and define the target and stoploss levels.
Setting panel access
To access the setting panel, click on the tab with the indicator’s name on the top-left of the price chart, then click on “Configure…“:
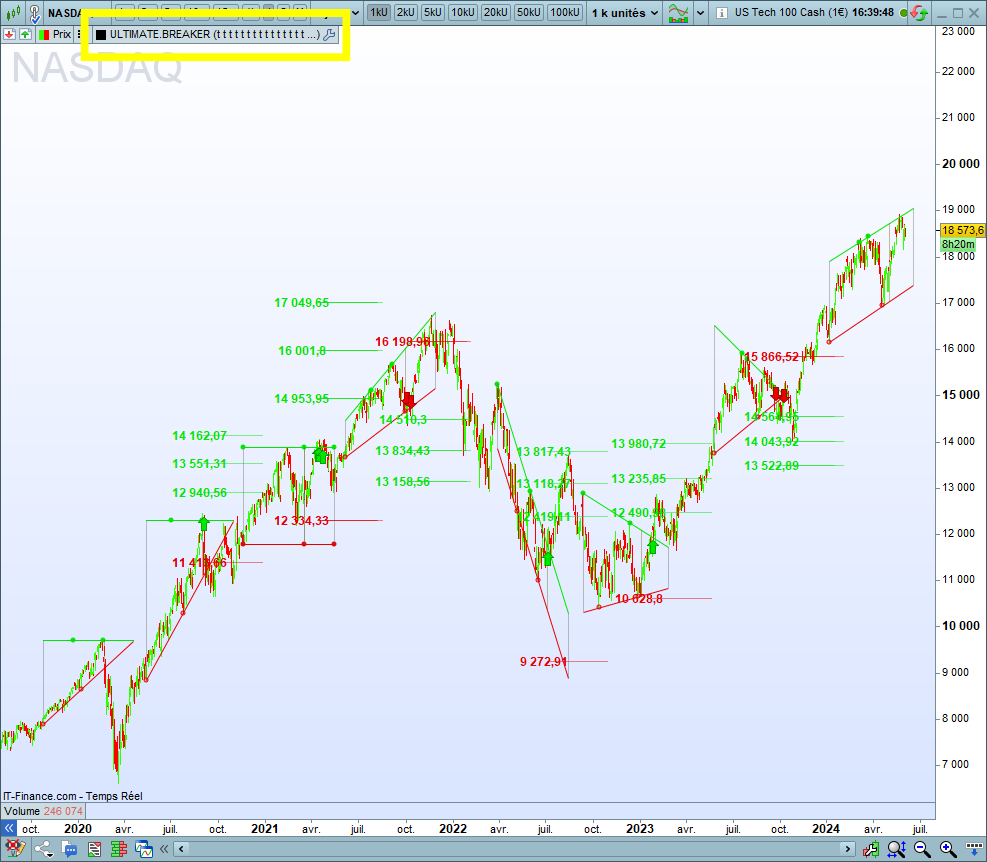
Here is the setting window of the Ultimate Breaker indicator:
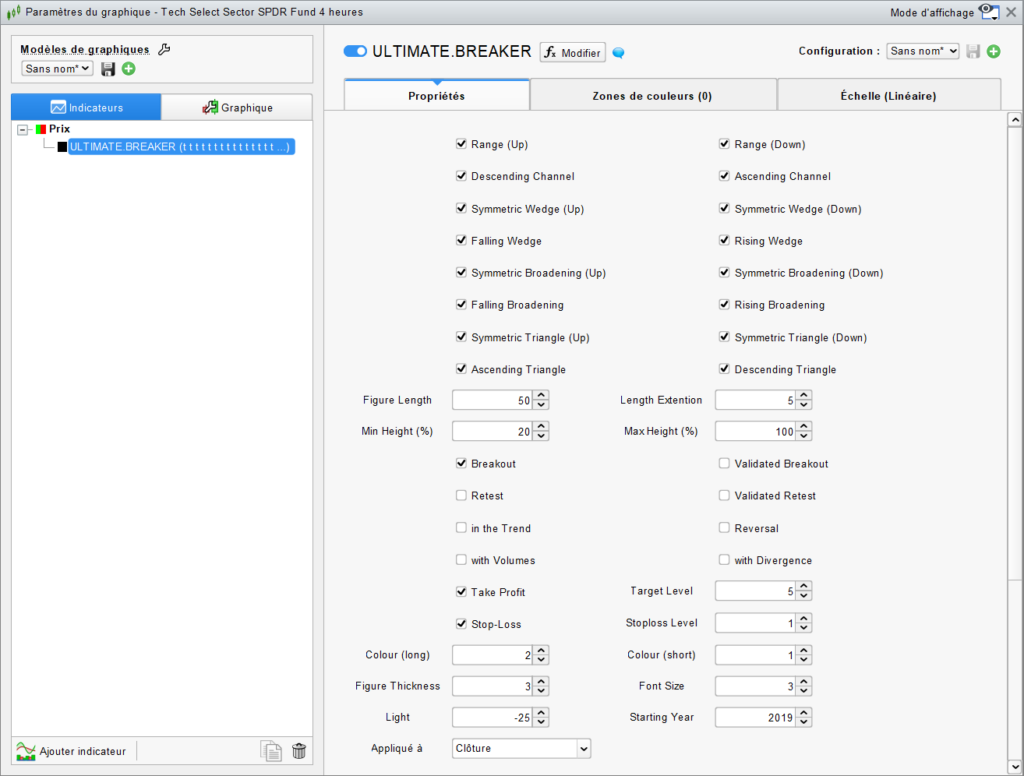
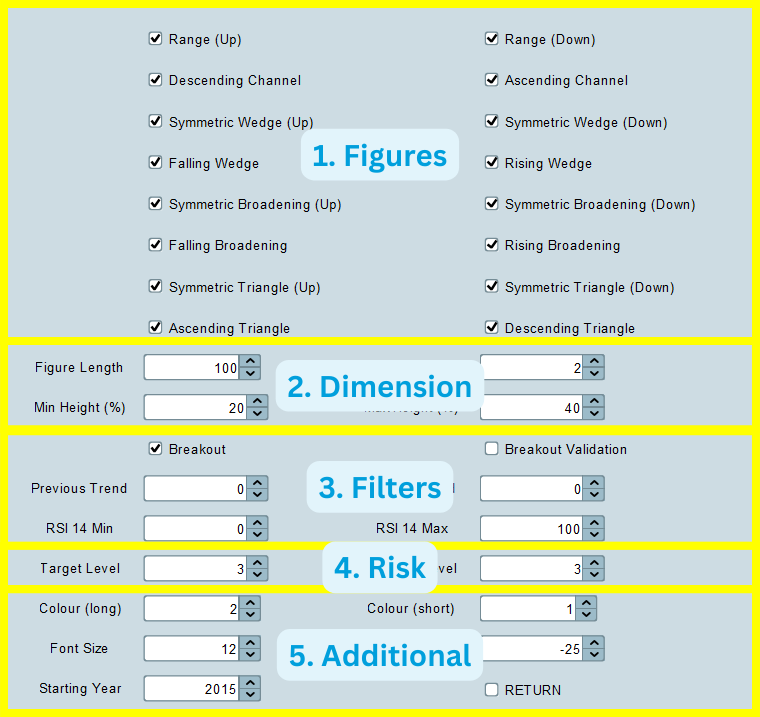
Description of the setting panel
The setting panel is made of several areas containing checkboxes and textboxes, allowing you to activate and set options:
- Figures selection
- Figures dimension
- Signal filters
- Risk Management
- Additional options
- Display setting
1. Figure selection
Figure selector
You can select the figures of your choice by clicking on the corresponding checkbox on the settings panel. You can select several figures:
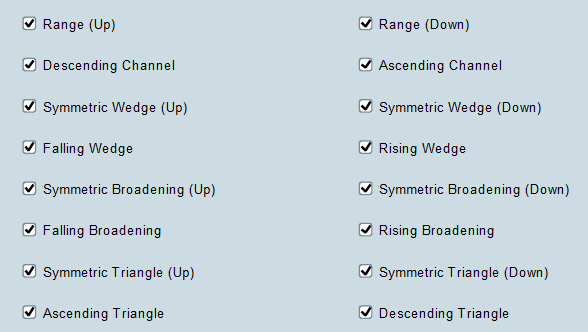
Buying and sell-shorting
The figures on the left columns allow opening long entries, and those on the right columns allow sell-short entries:
- The right column figures will send buying signals when the price breaks up their resistances.
- The left column figures will send sell-short signals when the price breaks down their resistances.
2. Figure dimensions
You can set the dimensions of the figures, such as the length and height:
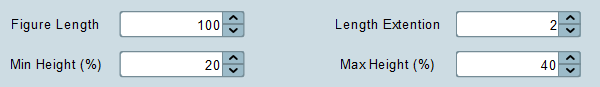
Figure size
The size of a figure is composed of the length and its extension.
Length
The length corresponds to the number of candles composing the figure. The algorithm will use this value to recognize the figures.
Extension
The length extension allows the figure to expand. The indicator will use this extended value to detect breakouts, which will extend the figure length without impacting the recognition.
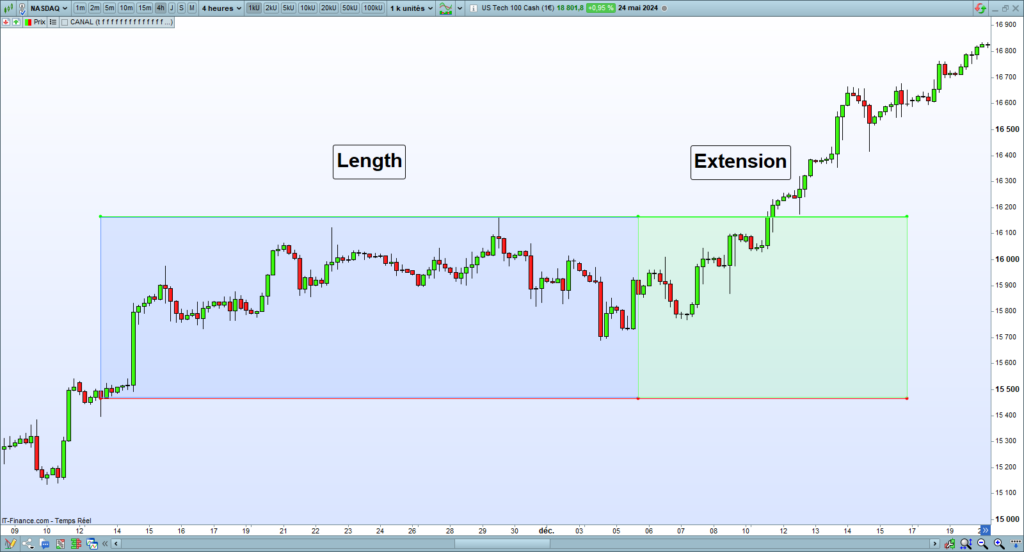
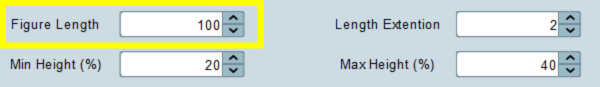
Figure length
You can set the length of the figure with the “Figure Length” parameter:
Length Extension
You can expand the length of the figure with the “Length Exetension” parameter:
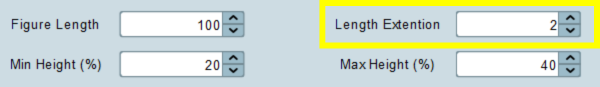
Figure height
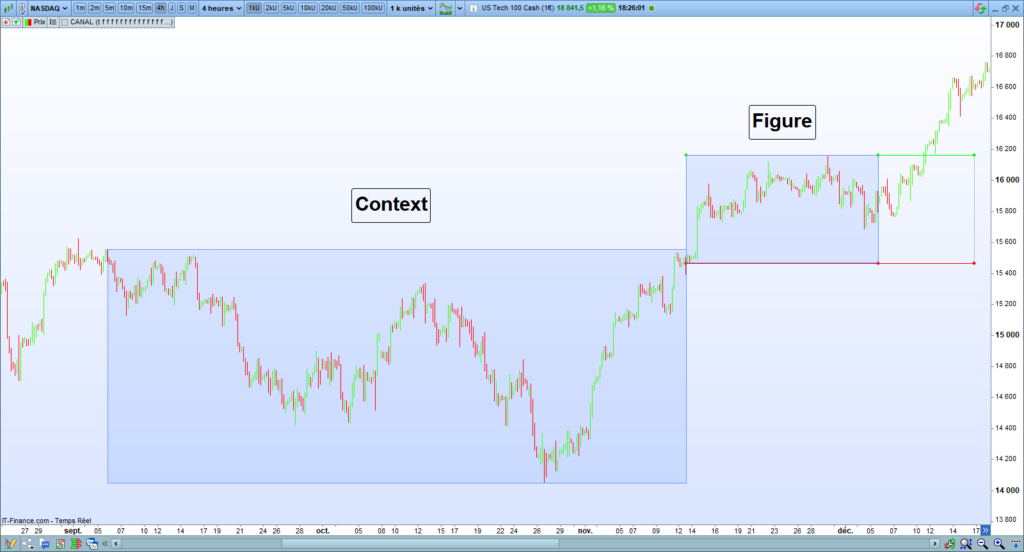
The figure height corresponds to the difference between the highest and the lowest price along the length of the figure. The height is indicated by a segment separating the length of a figure with its extension:
You can set the minimum and maximum height of the figures. These values are defined in percentage of the context. The context corresponds to four times the length of the figure:
Minimum height
You can set the minimum height of the figures with the “Min Height (%)” option:
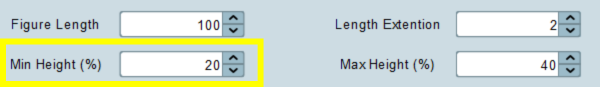
If you set 20 to the minimum height parameter for a 100-candle figure, the minimum height will be 20% of the height of the 400 last candles.
Maximum height
You can set the maximum height of the figures with the “Max Height (%)” option:
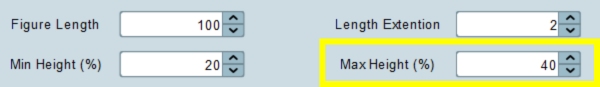
If you set 40 to the maximum height parameter for a 100-candle figure, the maximum height will be 40% of the height of the 400 last candles.
3. Signals selecting
The indicator provides several options allowing the filtering of figures and signals. You will enhance the quality of the signals and improve the success rate of your trades:
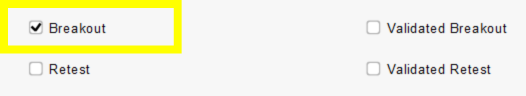
Figures breakout
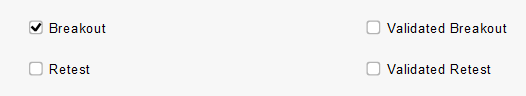
This option will display the bullish and bearish breakouts, indicating the long and short entry openings:
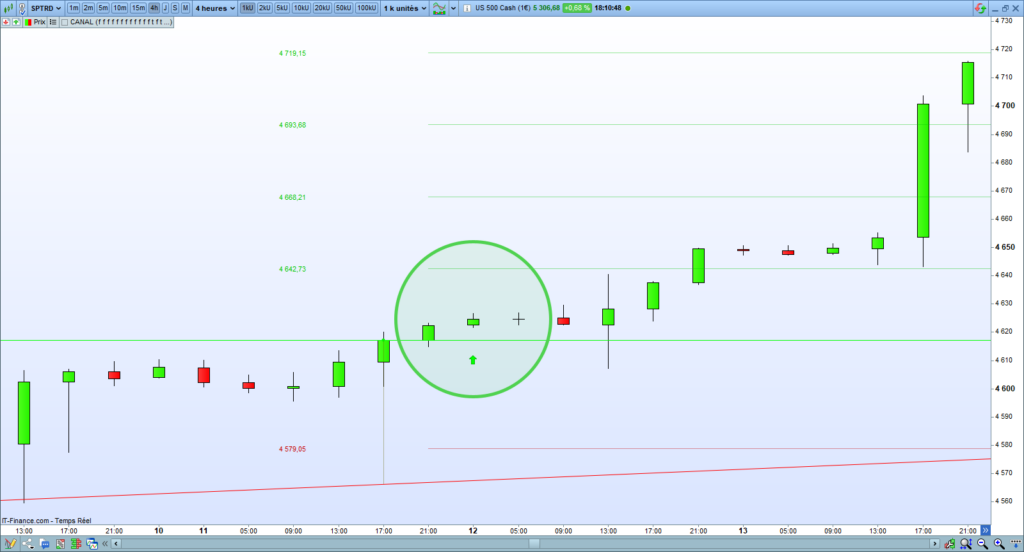
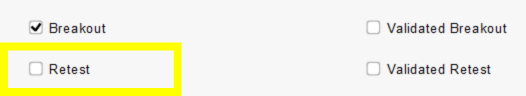
You must check the “Breakout” checkbox to activate breakout detections:
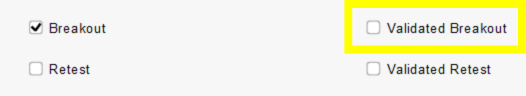
Breakout validation
The indicator allows only keeping the validated breakouts:
- A bullish breakout is validated when the price breaks up the resistance and the next candle closes above it.
- A bearish breakout is validated when the price breaks down the support and the next candle closes under it.
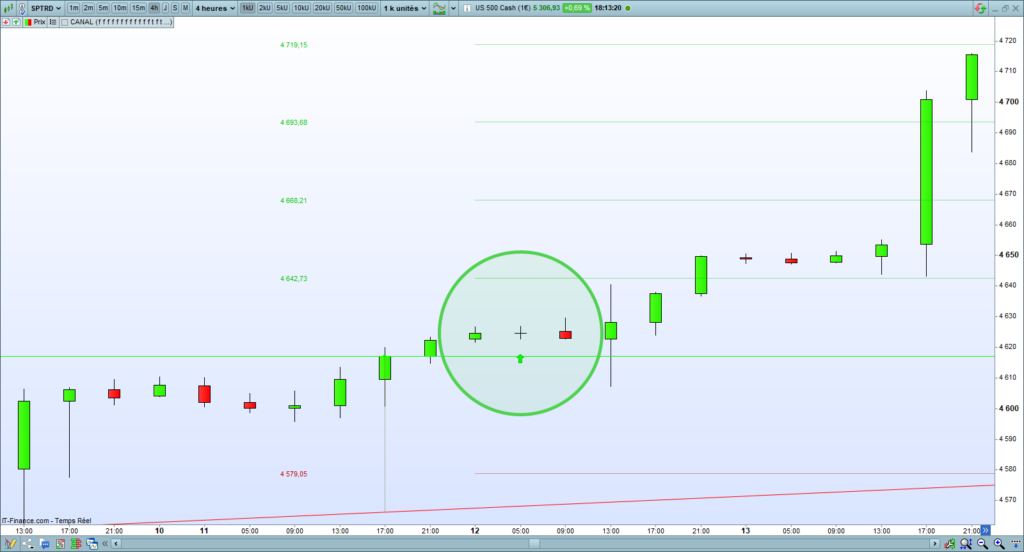
You must check the “Validated Breakout” checkbox to activate the breakout validation:
Retest
A retest occurs when the price returns to the resistance or support after a breakout. You must check the “Retest” checkbox to activate the retest signals:
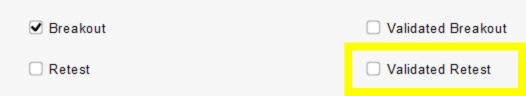
Validated retest
The retest is validated when the price rebounds after the retest. You must check the “Validated Retest” checkbox to activate the retest signals:
4. Trend and Strength filters
You can apply trend and strength filters. This will allow you to improve the quality of signals and increase the success rate of your trades:
Trend filter
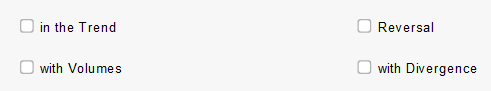
You can filter the trend preceding the formation of a pattern with the “in the Trend” and “Reversal” options.
The “in the Trend” option allows you to filter patterns within the trend. Bullish patterns will only appear in an uptrend, and bearish patterns will only appear in a downtrend:

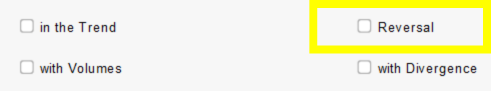
The “Reversal” option allows you to filter patterns against the trend. Bullish patterns will only appear in a downtrend, and bearish patterns will only appear in an uptrend:
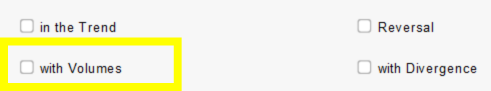
Volumes
You can filter the signals depending on the volumes with the “with Volumes” option. If you check this box, the indicator will filter buy signals accompanied by buying volumes and short-sell signals accompanied by selling volumes.
Market strength
You can filter the signals appearing in a divergence with the “with Divergence” option. Buy signals will be displayed if there is a bullish divergence and short-sell signals will be displayed if there is a bearish divergence:
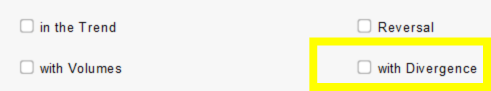
This option is helpful if you have activated the “Reversal” trend filter to take trend reversal signals.
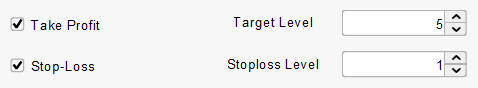
5. Risk management
The Ultimate Breaker provides risk management options. You can define the target and stop loss levels associated with each signal. The target and stop loss positions are calculated from the figure height:
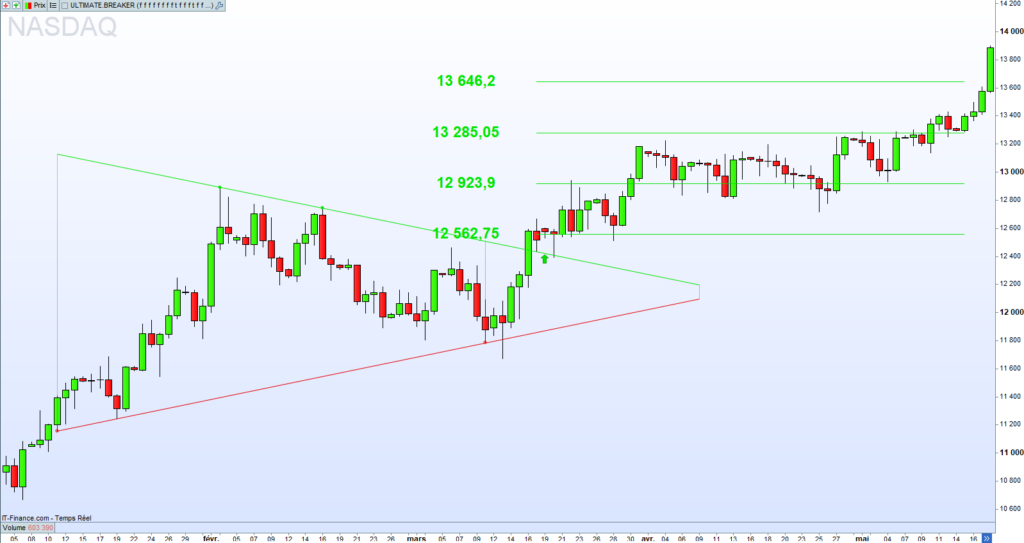
Target level
The target corresponds to the price at which you want to close your position to concretize your latent gain. The indicator displays several target levels. Each level corresponds to one half-height of the figure.
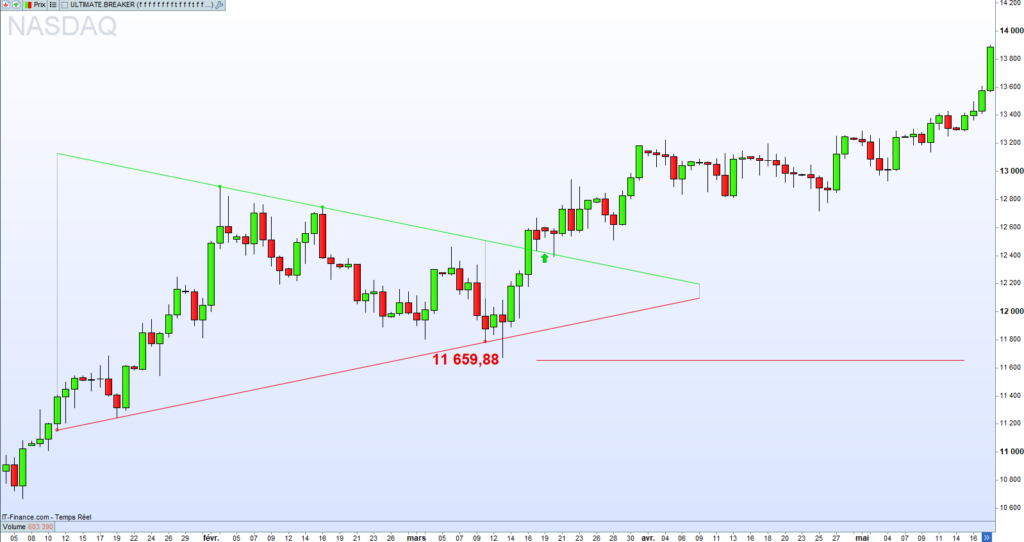
You can define the number of targets with the “Target Level” option:
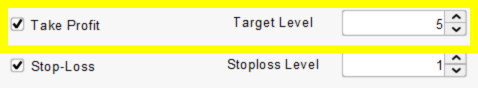
You must set 1 to the indicator prints the first level, 2 to display the two first levels, etc. You can turn off the targets by setting 0 to this option. The following example shows the four first target levels:
Stoploss level
The stoploss corresponds to the price at which you want to close your position to limit your latent loss. The indicator allows displaying one stoploss. Each level corresponds to one quart of the figure height.
You can define the number of stoploss with the “Stoploss Level” option:
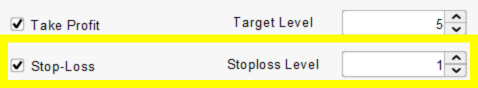
You must set 1 to the indicator prints the first level, 2 to display the second stoploss levels, etc. You can turn off the stoploss by setting 0 to this option. The following example shows the third first target levels:
6. Additional options
The indicator provides additional options for displaying and returning the data:
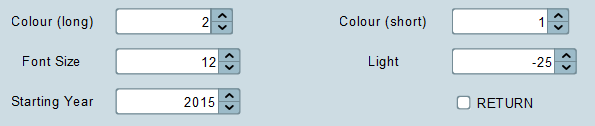
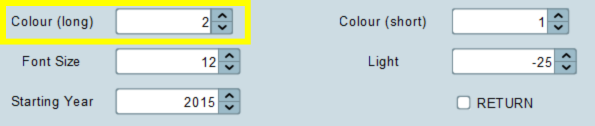
Colours
You can set the colours of the displayed figures and texts with the “Colour (long)” and “Colour (short)” options. These two options accept positive and negative values. The positive values allow you to choose a colour, and the negative values a grey level. You have access to a palette of 15 colours and 5 grey levels.
Colour (long)
The “Colour (long)” option concerns the resistance and target colours:
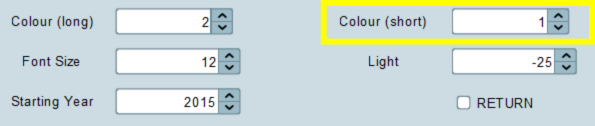
Colour (short)
The “Colour (short)” option concerns the support and stoploss colours:
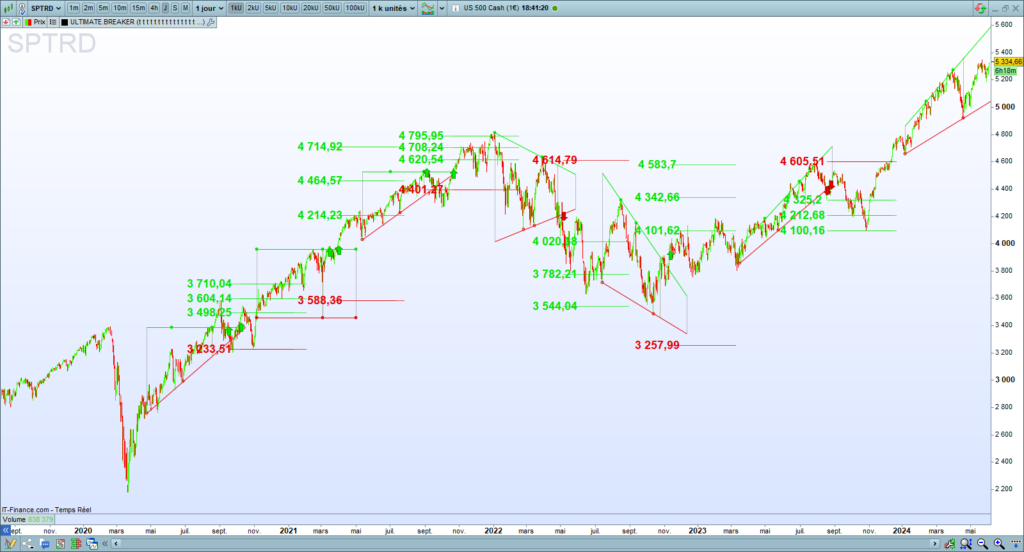
Example of colours
Standard colours (Green-Red)
Personalized colours (White) with dark them
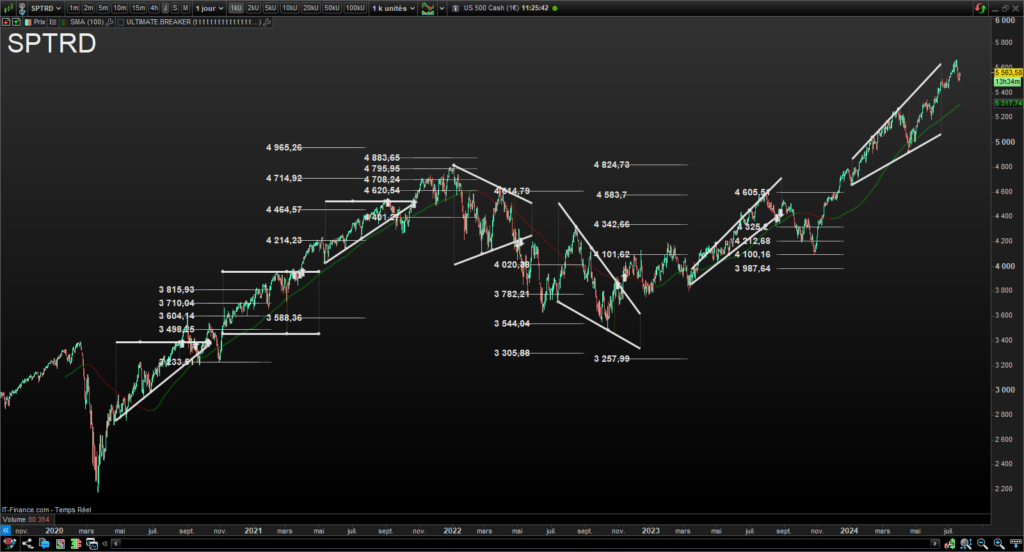
Figure Thickness
You can set the figure’s thickness with the Figure Thickness parameter. The accepted values for this parameter start from 1 until 5:
- Set 1 to display thin segments.
- Set 5 to display thick segments.
Thin figure segments
Thick figure segments
Font size
You can set the font size of the targets and stoploss with the ‘Font Size” option :
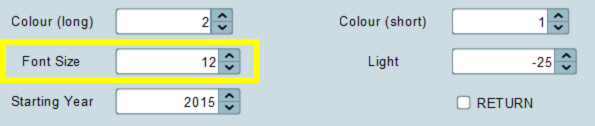
The font size impacts the segment’s weight, tracing the targets and stoploss. You can use a negative value to display the segment without text.
Note: Since the PRT v11 v12 compatibility update, the “Font Size” parameter values range from 0 to 10.
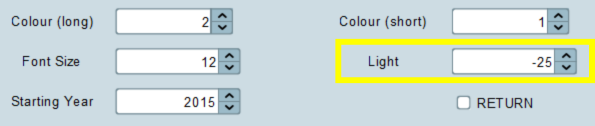
Light
You can increase or decrease the brightness of the figures, targets, and stoploss with the “Light” option. The available values come from -255 to 255:
Starting year
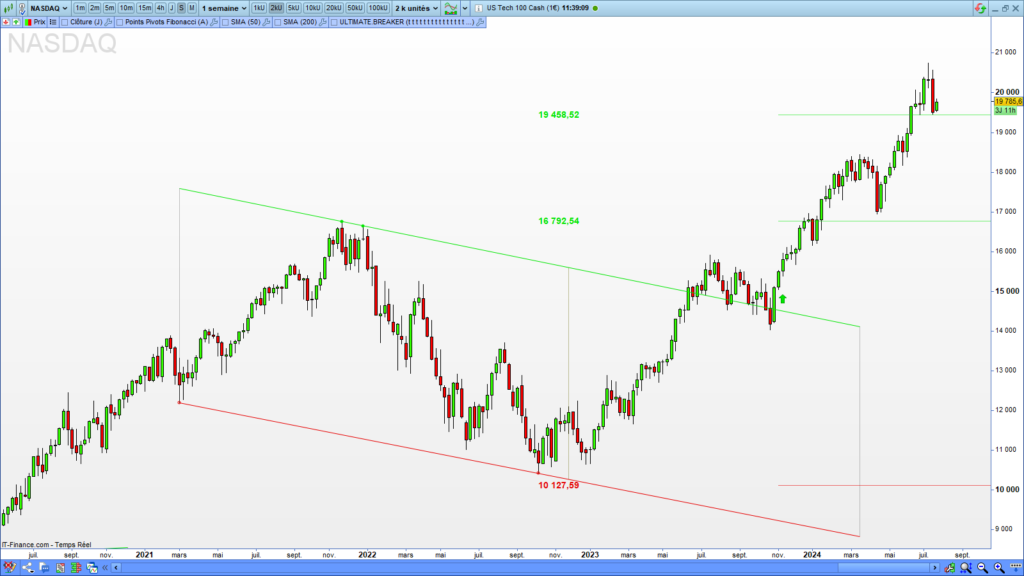
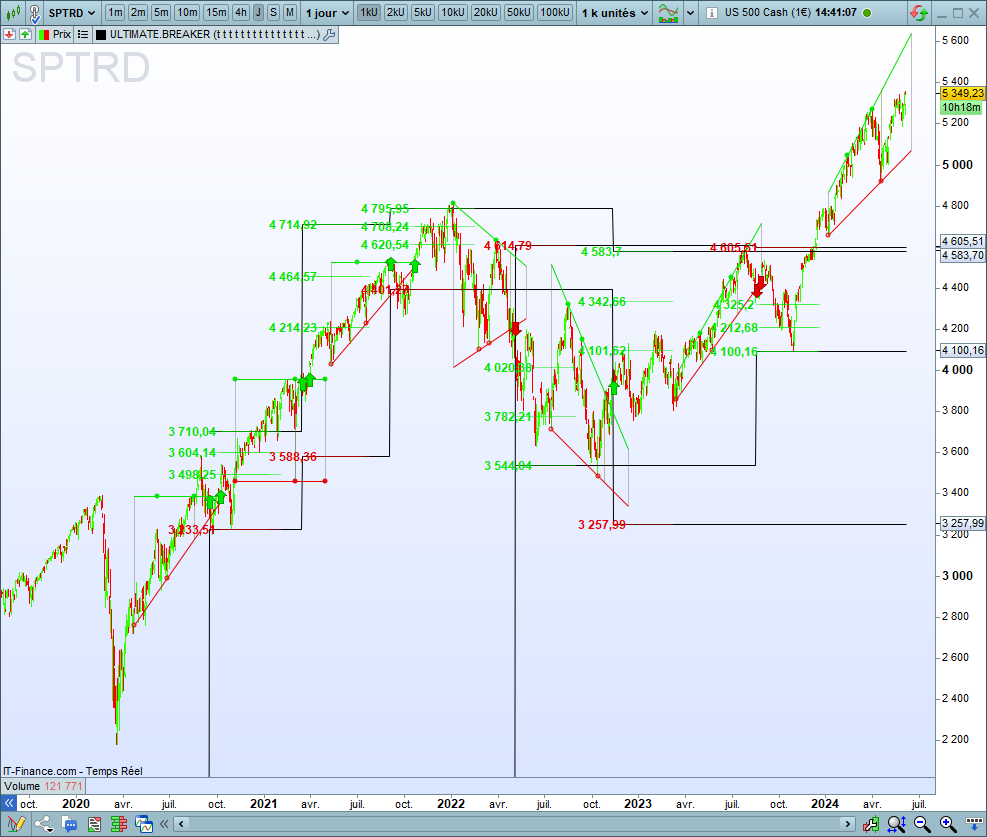
You can choose the year from which the indicator will start to search figures with the “Starting Year” option. That will alleviate your chart and reduce the calculation time:
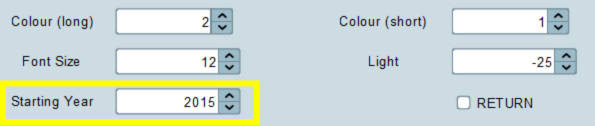
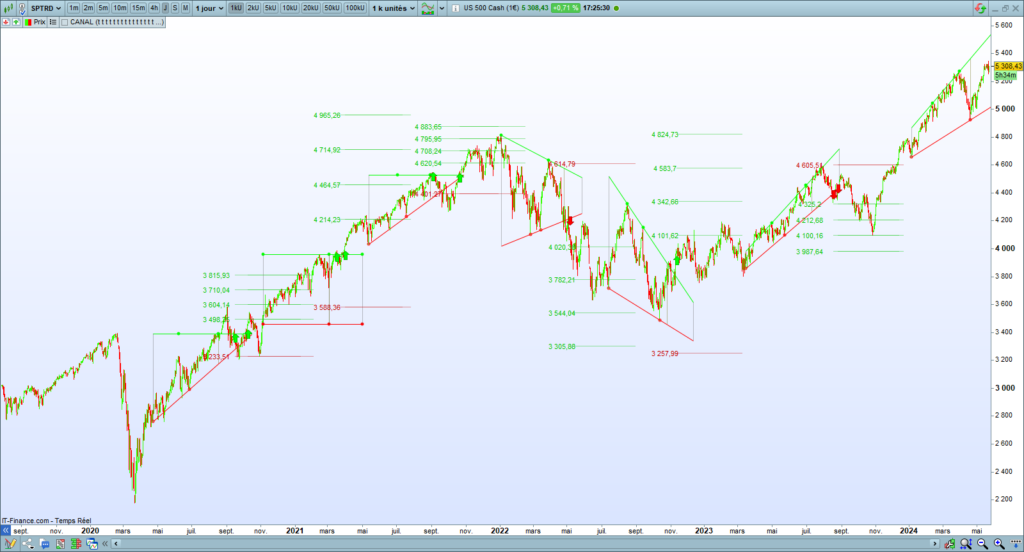
Starting year example: 2020
If you set 2020 to the starting year option, the indicator will display the figure from the 2020 year:
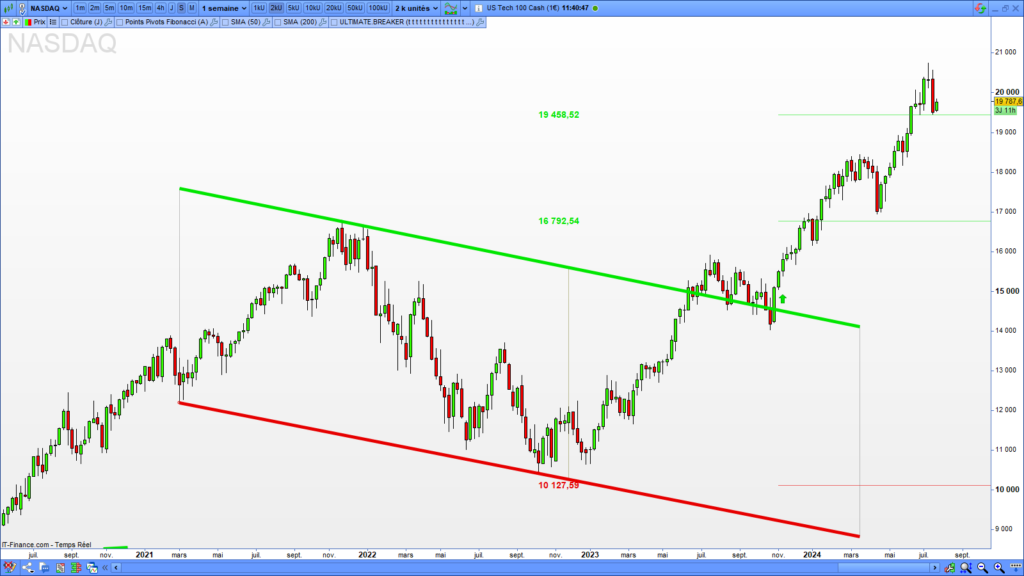
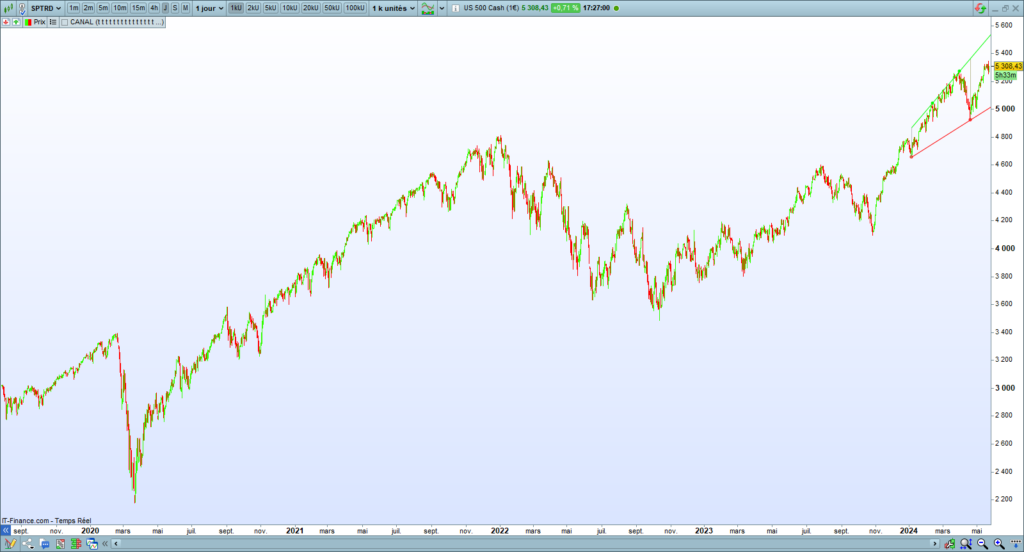
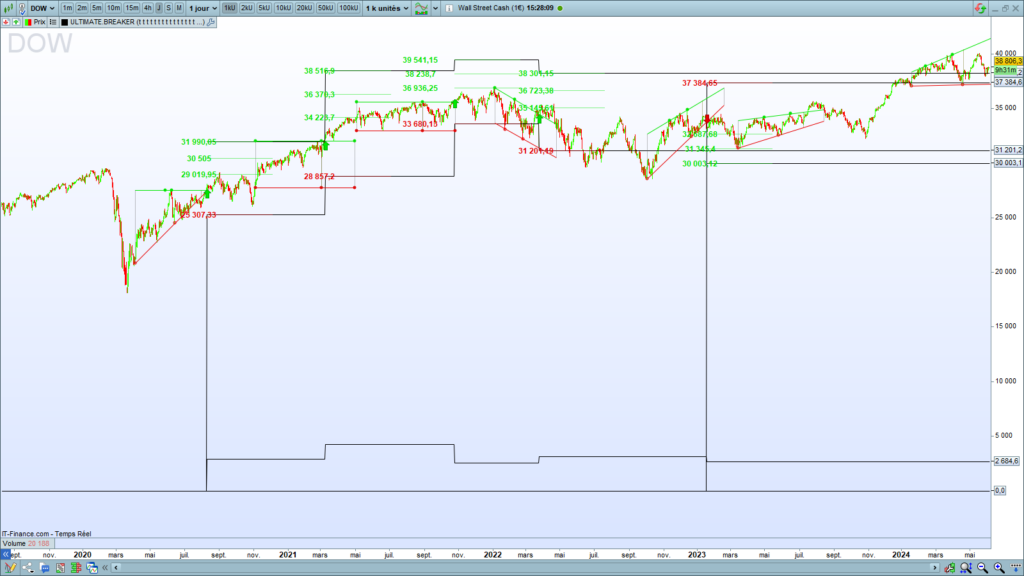
Starting year example: 2024
If you set 2024 to the starting year option, the indicator will display the figure from the 2024 year:
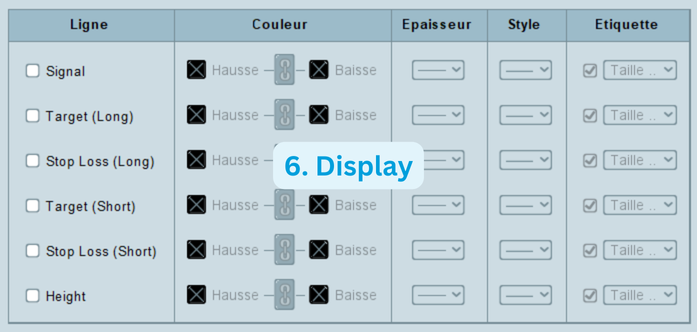
7. Display setting
Data activation
The indicator natively displays figures, targets, and stop losses. You have to check the checkboxes of the data you need:
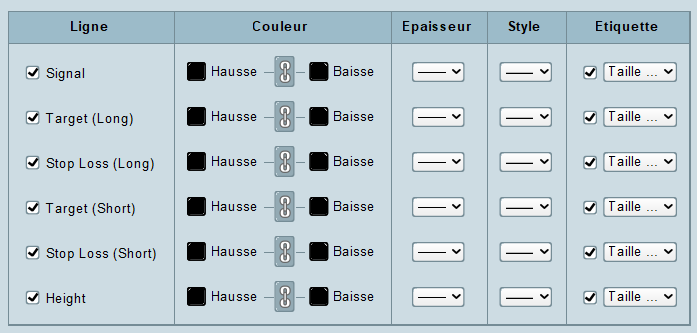
The targets and stop losses will printed on the chart:
Displaying issue after the installation of the indicator
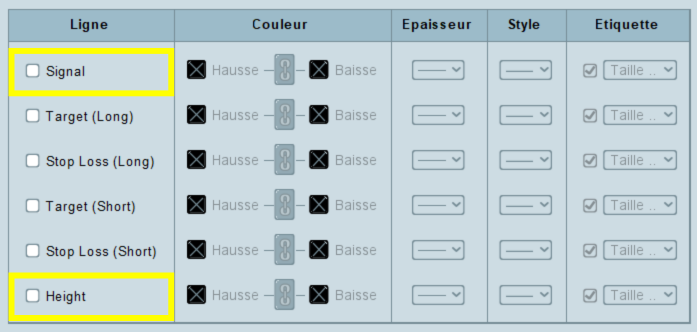
Sometimes, the installation of the indicator flattens the price chart. This issue results from the price adjustment to the indicator’s returned data, which can be small values such as the signals (-1, 0, or 1) or the figure height.
The scaling will flatten the price chart:
If you meet this graphic issue after the indicator installation, please uncheck the “Signal” checkbox. If the problem persists, uncheck the “Height” checkbox:
Create an alert system
The Prorealtime platform provides trading alert services. You can use the Ultimate Breaker to create alerts on the figure breakouts. I will present the steps to build trading alerts with the Ultimate Breaker indicator.
1. Configure the indicator
You must set up the Ultimate Breaker indicator before creating an alert. The Prorealtime platform will take your settings as input to send you alerts.
For example, if you have set a figure length of 100 candles with breakout validation and volume increase, the platform will send you alerts only for this configuration.
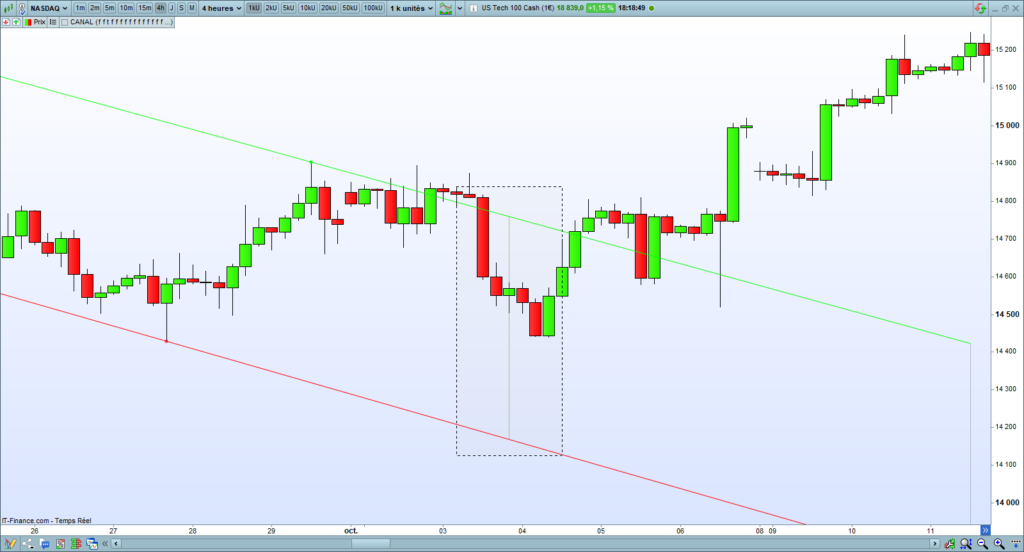
Configuration example
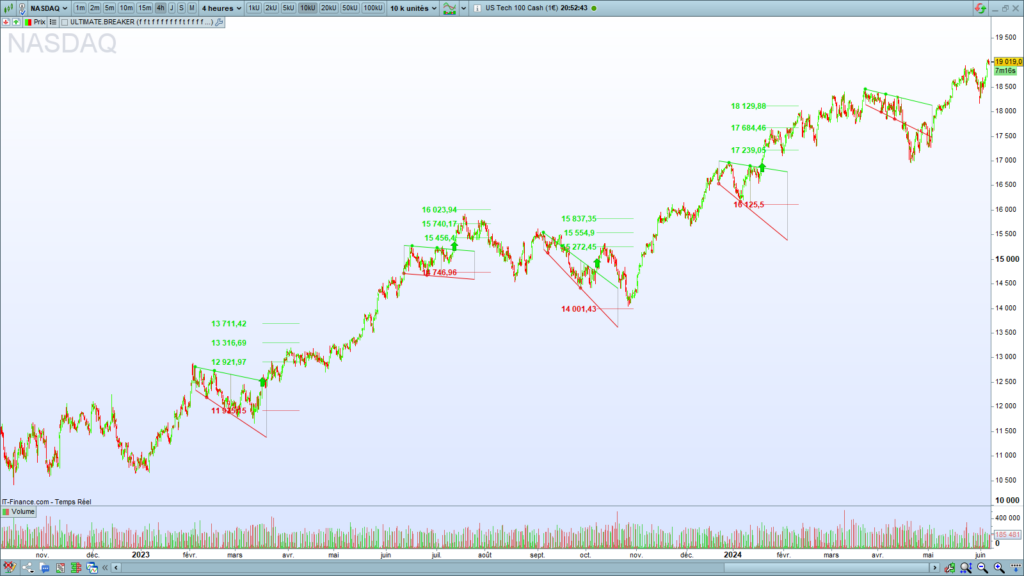
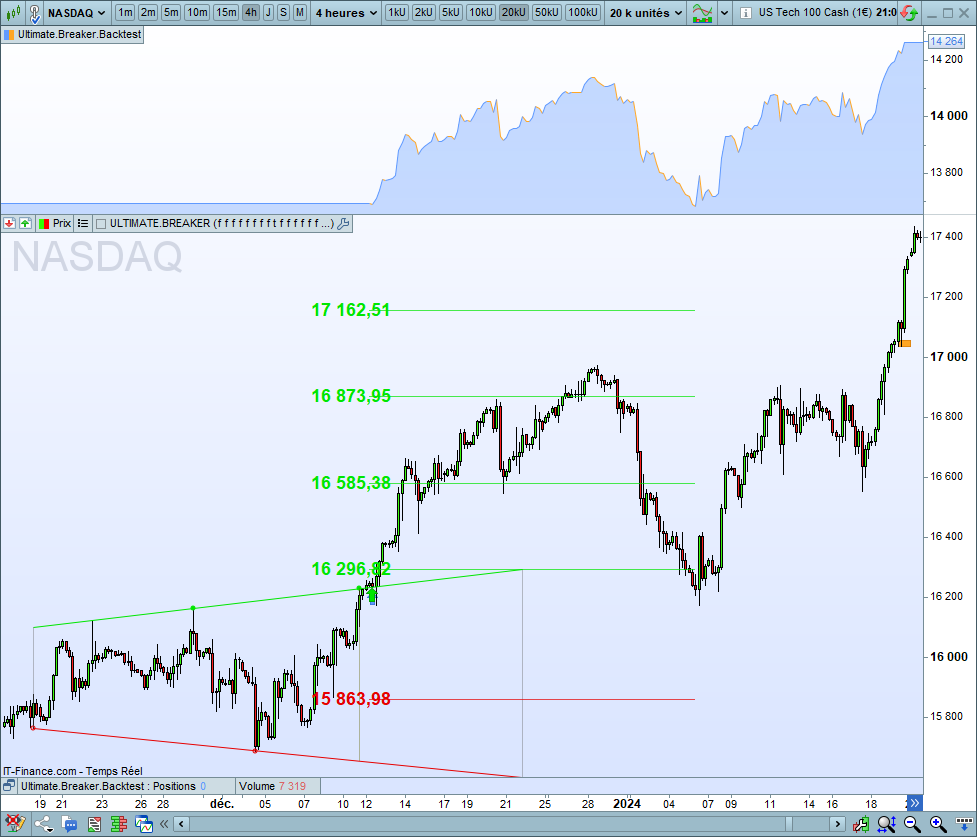
Here is an example of settings for what I want to receive alerts:
- Figure: Descending Channel and Falling Broadening
- Length: 100 candles
- Extension: 4
- Height Min: 20%
- Height Max: 50%
- Trend: Bullish on 100 candles
- Breakout: Validated
- Volume: Bullish on 5 candles
- RSI Min: 20
- RSI Max: 80
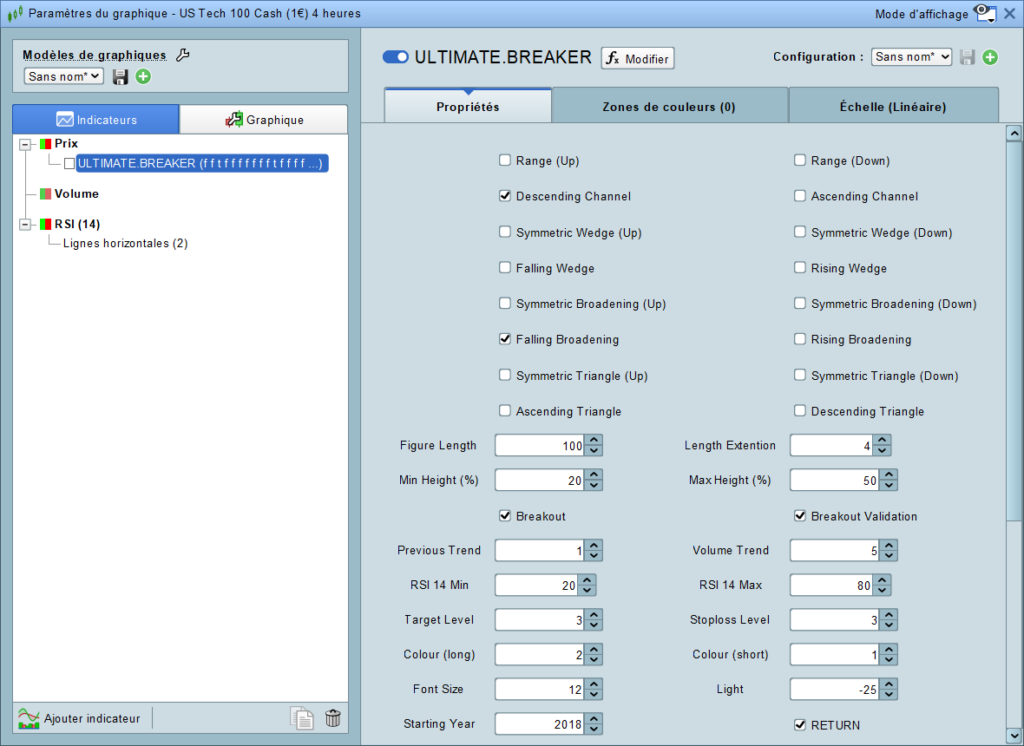
Here is the running of this setup on the Nasdaq in the 4-hour time unit:
2. Open the alert window
After you defined your setup, you must open the alert window. To do that, right-click on the price chart, then click on “Create a new alert“:
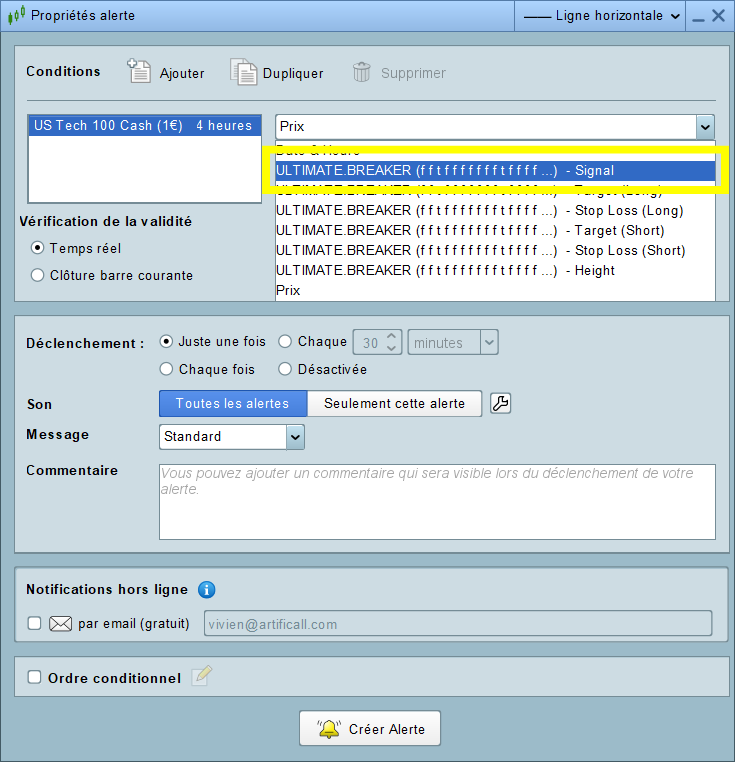
3. Select the Ultimate Breaker indicator
You must select the Ultimate Breaker indicator to make the Prorealtime alert system use the indicator’s signals. Select the line containing the “Signal” word:
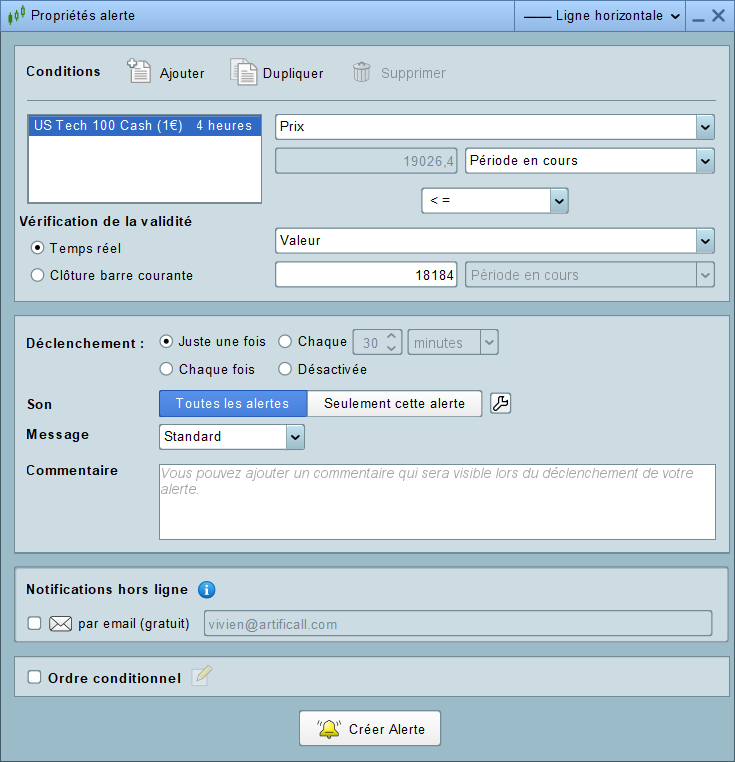
4. Set the values
The Ultimate Breaker indicator returns 1 for bullish breakouts and -1 for bearish breakouts.
Select the “equal” sign and set 1 to the value to receive alerts on bullish breakouts.
It is preferable to select the current bar closing for the validity checking. You only receive validated signals, which will reduce the resources of your computer:
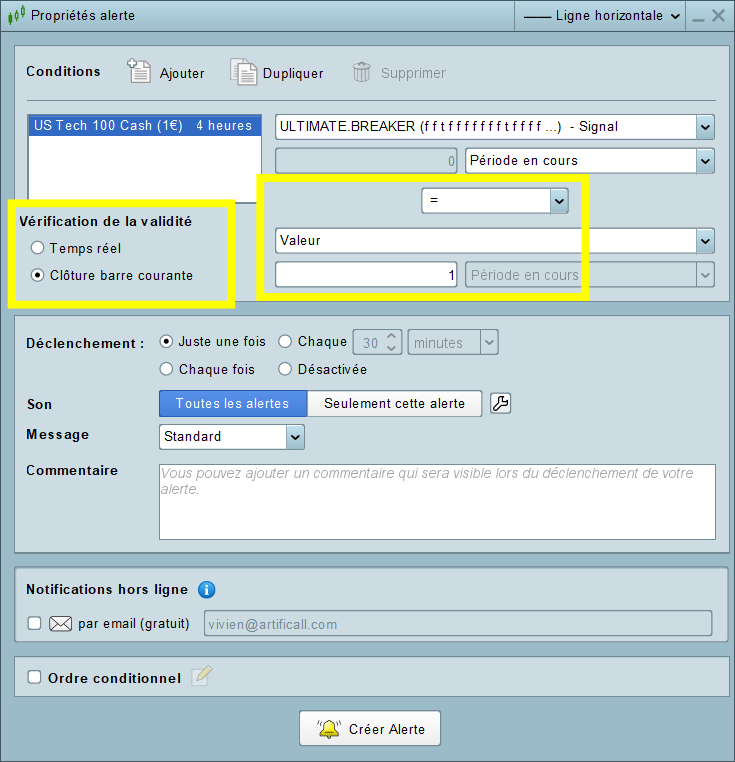
Note: you can write a message describing the signal in the comment area.
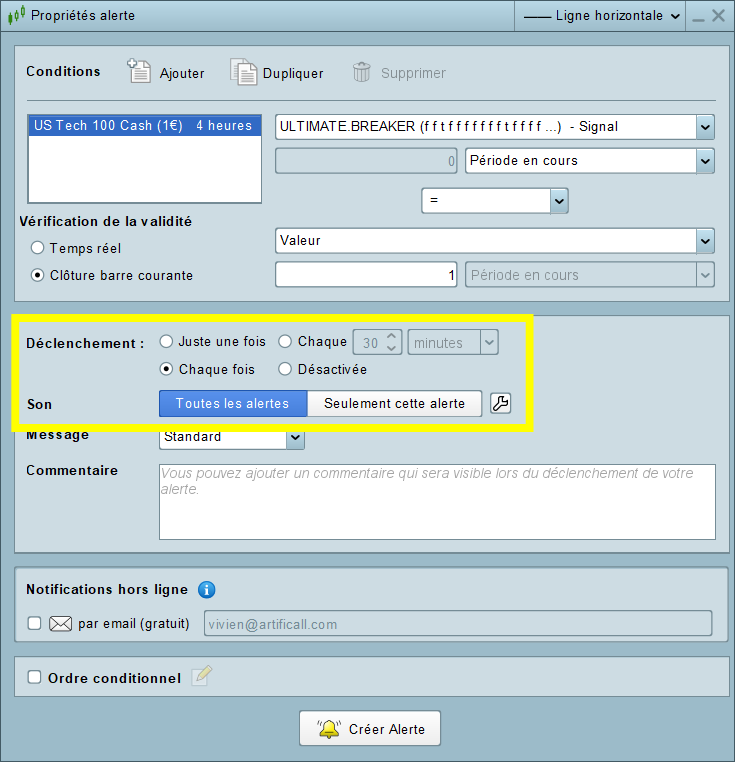
5. Trigger management
The triggers allow you to manage the temporality of the triggerings. In this example, the platform will send an alert for each bullish breakout:
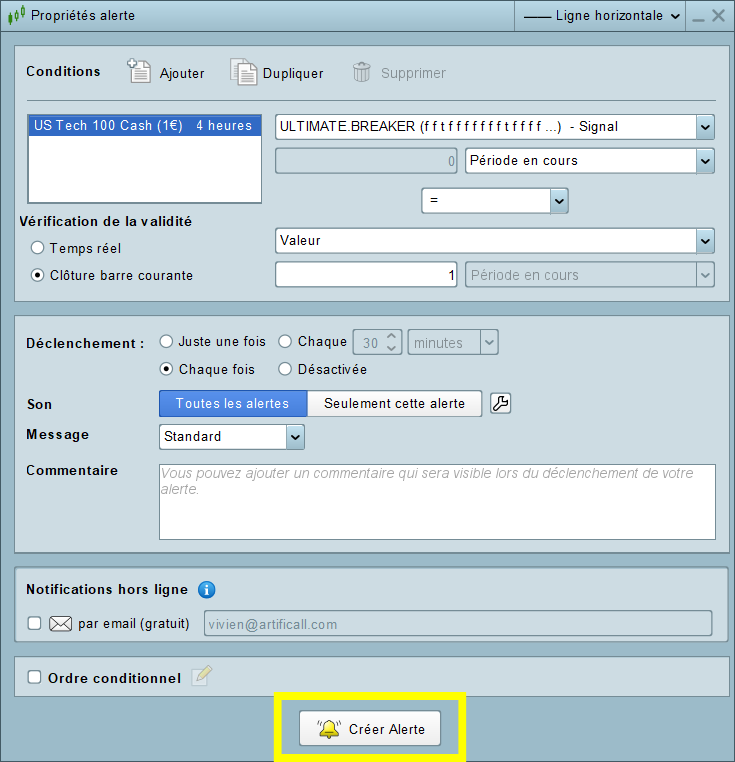
6. Create the alert
You only have to click on the “Create Alert” button to finalize the process:
7. Alert management
You can manage your trading alerts from the alert window. Click on the top main menu, then click on “Display“, then click on “Alert Status“, or type “Ctrl a“:
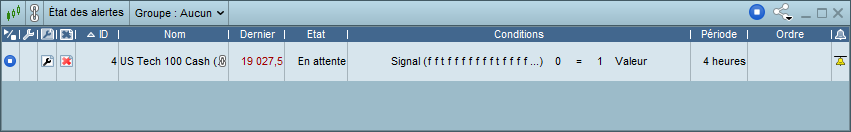
You only have to click on the alert of your choice to modify it.
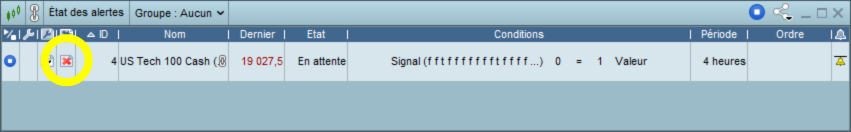
You can remove an alert by clicking on the red cross on the alert Status window:
Backtest & Automated Trading
You can implement the Ultimate Breaker indicator in a backtest or an automated trading system. The indicator returns all the data you need to create a strategy.
Indicator implementation in a backtest
The CALL instruction
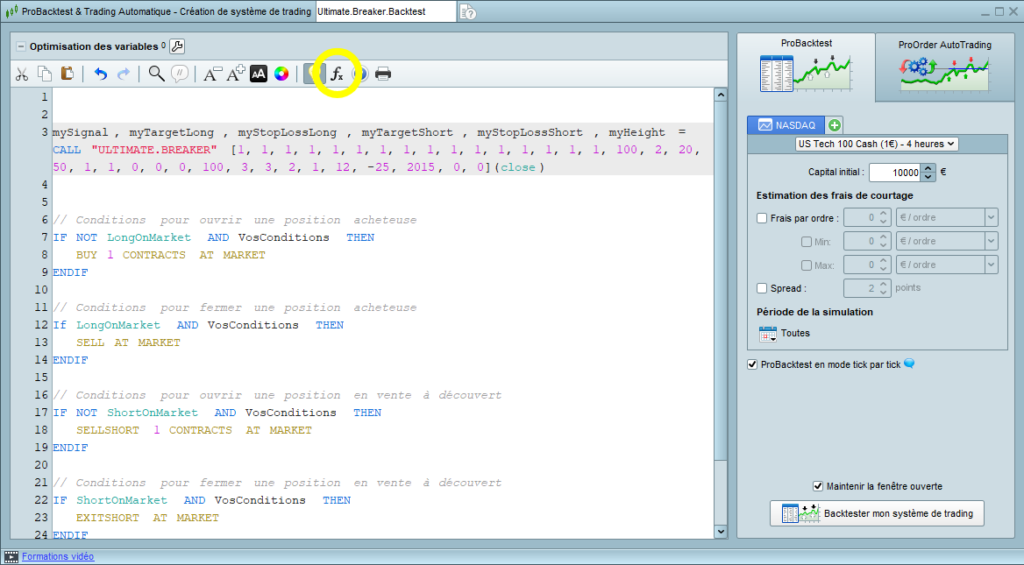
The CALL instruction allows the indicator implementation in a backtest:
mySignal, myTargetLong, myStopLossLong, myTargetShort, myStopLossShort, myHeight = CALL "ULTIMATE.BREAKER"[1, 1, 1, 1, 1, 1, 1, 1, 1, 1, 1, 1, 1, 1, 1, 1, 50, 5, 20, 100, 1, 0, 0, 0, 0, 0, 0, 0, 1, 5, 1, 1, 2, 1, 3, 3, -25, 2019](close)You can use the function insertion tool to implement an indicator in a backtest. Click on the “Insert functions” button on the code editor window:
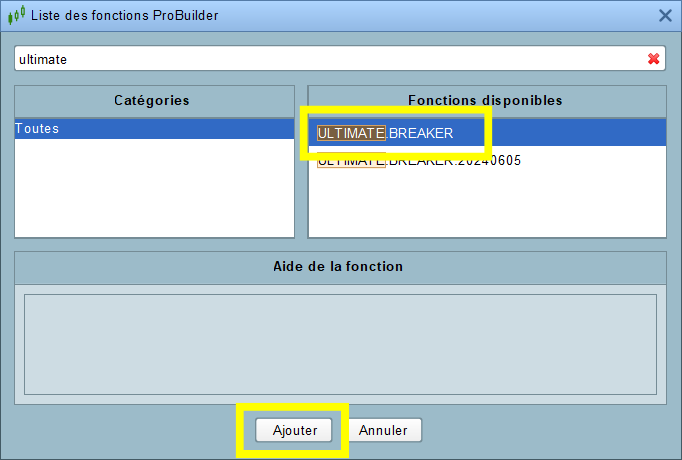
Later, type “Ultimate Breaker“, select the indicator, and click on “Add“:
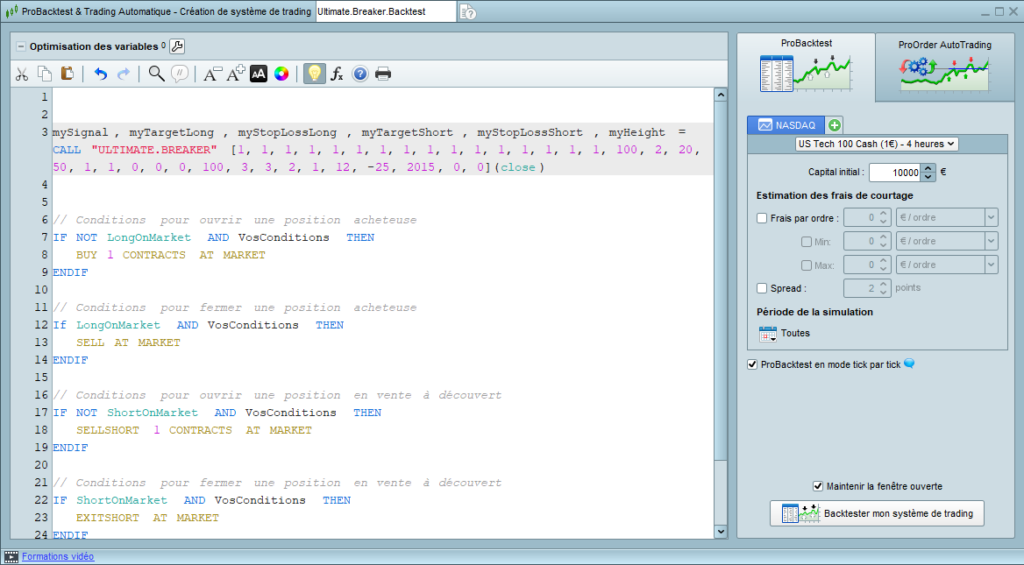
The indicator will be integrated into the source code with the default parameters:
Code of the indicator integration
I created the following code to help you integrate the Ultimate Breaker indicator into a backtest. The configuration is for reference only. It corresponds to the default configuration of the indicator:
DEFPARAM PRELOADBARS = 10000
DEFPARAM CUMULATEORDERS = False
//--------------------------------------------------------//
// *** SETTING BLOCK *** //
//--------------------------------------------------------//
// * Figures Selector
// Long Figures
ONCE RangeUp = 1
ONCE DescendingChannel = 1
ONCE SymmetricWedgeUp = 1
ONCE FallingWedge = 1
ONCE SymmetricBroadeningUp = 1
ONCE FallingBroadening = 1
ONCE SymmetricTriangleUp = 1
ONCE AscendingTriangle = 1
// Short Figures
ONCE RangeDown = 1
ONCE AscendingChannel = 1
ONCE SymmetricWedgeDown = 1
ONCE RisingWedge = 1
ONCE SymmetricBroadeningDown = 1
ONCE RisingBroadening = 1
ONCE SymmetricTriangleDown = 1
ONCE DescendingTriangle = 1
// * Figure Properties
ONCE FigureLength = 50
ONCE LengthExtension = 5
ONCE MinHeight = 20
ONCE MaxHeight = 100
// * Signals
ONCE Breakout = 1
ONCE ValidatedBreakout = 0
ONCE Retest = 0
ONCE ValidatedRetest = 0
// * Filters
ONCE inTheTrend = 0
ONCE Reversal = 0
ONCE withVolumes = 0
ONCE withDivergence = 0
// * Risk Management
ONCE DisplayTarget = 1
ONCE TargetLevel = 5
ONCE DisplayStoploss = 1
ONCE StoplossLevel = 1
// * Display Options (Unuseful for backtest)
ONCE ColourLong = 2
ONCE ColourShort = 1
ONCE FigureThickness = 3
ONCE FontSize = 12
ONCE Light = -25
// * Starting Year
ONCE StartingYear = 2019
mySignal = 0
myTargetLong = 0
myStopLossLong = 0
myTargetShort = 0
myStopLossShort = 0
myHeight = 0
//--------------------------------------------------------//
// *** INDICATOR CALLING *** //
//--------------------------------------------------------//
mySignal, myTargetLong, myStopLossLong, myTargetShort, myStopLossShort, myHeight = CALL "ULTIMATE.BREAKER"[RangeUp, RangeDown, DescendingChannel, AscendingChannel, SymmetricWedgeUp, SymmetricWedgeDown, FallingWedge, RisingWedge, SymmetricBroadeningUp, SymmetricBroadeningDown, FallingBroadening, RisingBroadening, SymmetricTriangleUp, SymmetricTriangleDown, AscendingTriangle, DescendingTriangle, FigureLength, LengthExtension, MinHeight, MaxHeight, Breakout, ValidatedBreakout, Retest, ValidatedRetest, inTheTrend, Reversal, withVolumes, withDivergence, DisplayTarget, TargetLevel, DisplayStoploss, StoplossLevel, ColourLong, ColourShort, FigureThickness, FontSize, Light, StartingYear](close)
//--------------------------------------------------------//
// *** ENTRY OPENING *** //
//--------------------------------------------------------//
// * Long Position Conditions
IF NOT ONMARKET AND mySignal = 1 THEN
BUY 1 CONTRACTS AT MARKET
Set Target Price myTargetLong
Set Stop Price myStopLossLong
ENDIF
// * Short Position Conditions
IF NOT ONMARKET AND mySignal = -1 THEN
SELLSHORT 1 CONTRACTS AT MARKET
Set Target Price myTargetShort
Set Stop Price myStopLossShort
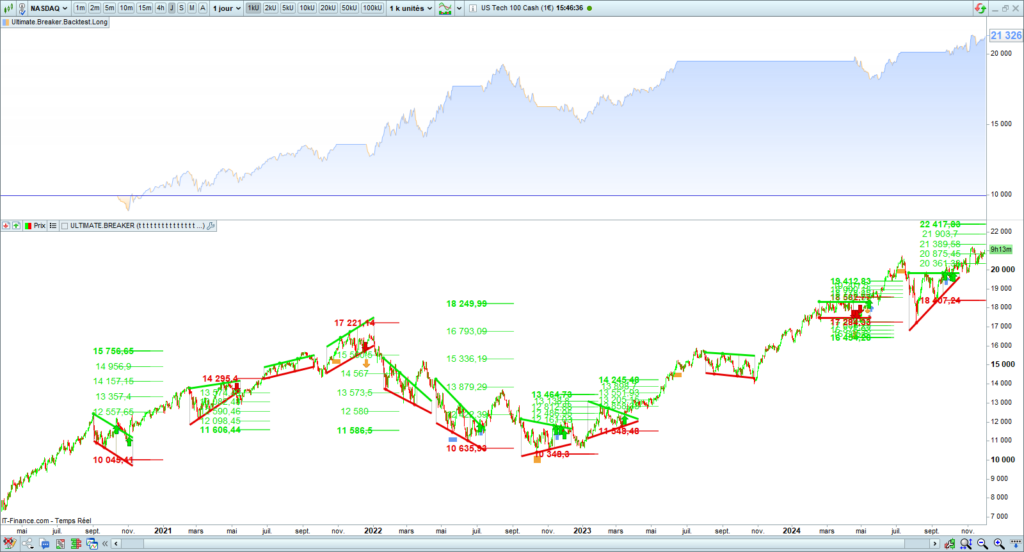
ENDIFBacktest result
Here is the previous backtest result on the Nasdaq in the daily time frame:
Example of a long entry
Here is an example of a long entry opening on a symmetric broadening breakup:
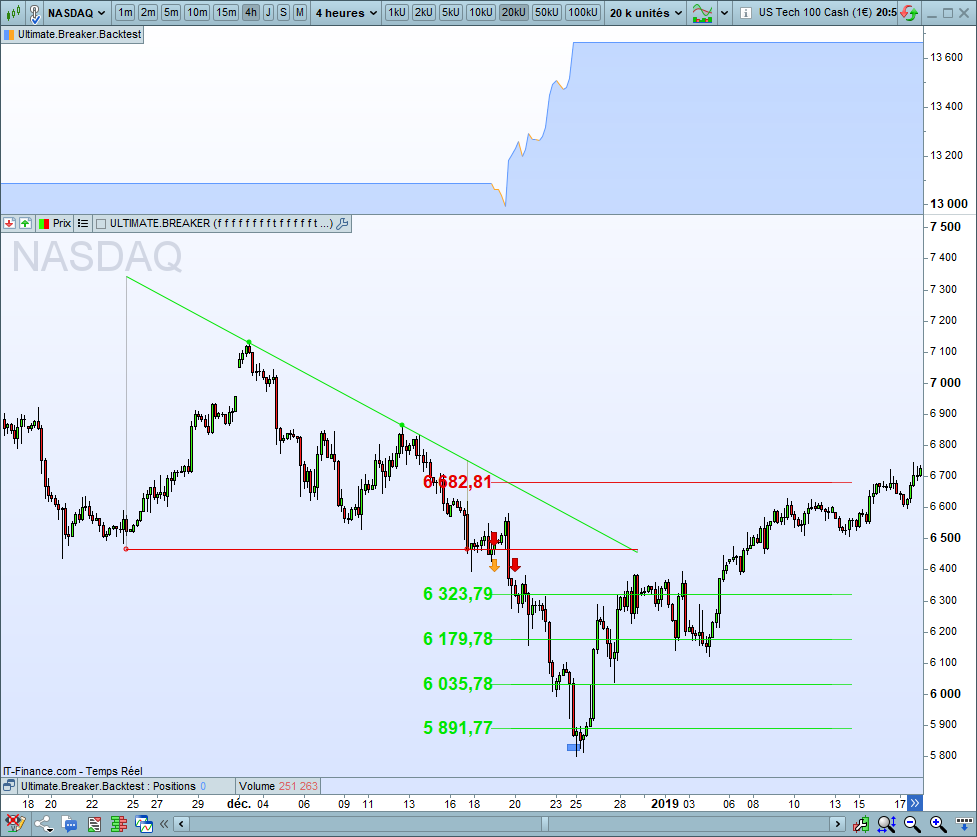
Example of a short entry
Here is an example of a short entry opening on a descending triangle breakdown:
Backtest setting
The indicator’s parameters are the same as those used with the interface. You will find the same options. Please refer to the “Indicator setting” section for the variable explanations.
Figure selector
Thanks to the figure selector, you can select the figures you want the indicator to recognize. It is composed of two parts: the first contains bullish figures, and the second contains bearish figures.
You must set 1 to activate a figure and 0 to inactivate a figure:
// * Figures Selector
// Long Figures
ONCE RangeUp = 1
ONCE DescendingChannel = 0
ONCE SymmetricWedgeUp = 0
ONCE FallingWedge = 0
ONCE SymmetricBroadeningUp = 1
ONCE FallingBroadening = 0
ONCE SymmetricTriangleUp = 0
ONCE AscendingTriangle = 1

// Short Figures
ONCE RangeDown = 1
ONCE AscendingChannel = 1
ONCE SymmetricWedgeDown = 1
ONCE RisingWedge = 1
ONCE SymmetricBroadeningDown = 1
ONCE RisingBroadening = 1
ONCE SymmetricTriangleDown = 1
ONCE DescendingTriangle = 1
Figure properties
You can set the figure properties. The available parameters are the length, the length extension, the minimal and maximal height:
// * Figure Properties
ONCE FigureLength = 50
ONCE LengthExtension = 5
ONCE MinHeight = 20
ONCE MaxHeight = 100
Signals
You can choose the signals you want to see. You must set 1 to activate a signal and 0 to inactivate it:
// * Signals
ONCE Breakout = 1
ONCE ValidatedBreakout = 0
ONCE Retest = 0
ONCE ValidatedRetest = 0
Filters
You can filter the figures and signals, enhancing the quality of the buying and selling signals. You must set 1 to activate a filter and 0 to inactivate it:
// * Filters
ONCE inTheTrend = 0
ONCE Reversal = 0
ONCE withVolumes = 0
ONCE withDivergence = 0
Risk management
You can define the target and stop loss levels. You can keep the default values. You can keep 1 to the display options:
// * Risk Management
ONCE DisplayTarget = 1
ONCE TargetLevel = 5
ONCE DisplayStoploss = 1
ONCE StoplossLevel = 1
Displaying options
The displaying options have no impact on a backtest.
// * Display Options (Unuseful for backtest)
ONCE ColourLong = 2
ONCE ColourShort = 1
ONCE FigureThickness = 3
ONCE FontSize = 12
ONCE Light = -25
Starting year
The starting year determines the year from which the algorithm will begin to search figures. You must be sure the starting year covers your backtest.
// * Starting year
ONCE StartingYear = 2019
The returned variables by the indicator
Here is the description of the six variables returned by the Ultimate Breaker indicator:
| Variables | Description |
|---|---|
| mySignal | Signals of the bullish and bearish figure breakouts: – Bullish breakout: 1 – Bearish breakout: -1 |
| myTargetLong | Value of the bullish breakout target |
| myStopLossLong | Value of the bullish breakout stop loss |
| myTargetShort | Value of the bearish breakout target |
| myStopLossShort | Value of the bearish breakout stop loss |
| myHeight | Figure height |
To go further
Automated trading using Prorealtime – Ebook
Building a profitable trader bot step-by-step Congratulations! You have just committed yourself to one of the most challenging exercises today. Algorithmic trading is a fascinating world. Its learning will allow you to push the boundaries of technical analysis and trading. I wrote this book to help you design your trading system using Prorealtime As a…
