Home > Analyses > Healthcare > Zoetis Inc.
Zoetis Inc. revolutionizes animal health, directly impacting the wellbeing of millions of pets and livestock worldwide. As a global leader in veterinary medicines, vaccines, and diagnostics, Zoetis sets industry standards through relentless innovation and comprehensive product lines. Its influence spans from farms to veterinary clinics, ensuring healthier animals and safer food supplies. The critical question for investors: does Zoetis’s robust market position and growth potential still justify its current valuation in 2026?

Table of contents
Business Model & Company Overview
Zoetis Inc., founded in 1952 and headquartered in Parsippany, New Jersey, stands as a leader in the animal health industry. It integrates a broad portfolio of medicines, vaccines, and diagnostics for livestock and companion animals into a cohesive ecosystem aimed at improving animal well-being globally. Its expertise spans species and therapeutic areas, creating a formidable presence in specialty and generic drug manufacturing.
The company generates value through a balanced mix of pharmaceutical products and innovative diagnostics, supported by a global footprint across the Americas, Europe, and Asia. Recurring revenues from vaccines and parasiticides complement its hardware-like diagnostic instruments and testing services. Zoetis’ economic moat derives from its extensive product pipeline and deep veterinary relationships, positioning it to shape the future of animal healthcare worldwide.
Financial Performance & Fundamental Metrics
I will analyze Zoetis Inc.’s income statement, key financial ratios, and dividend payout policy to assess its overall financial health and shareholder value.
Income Statement
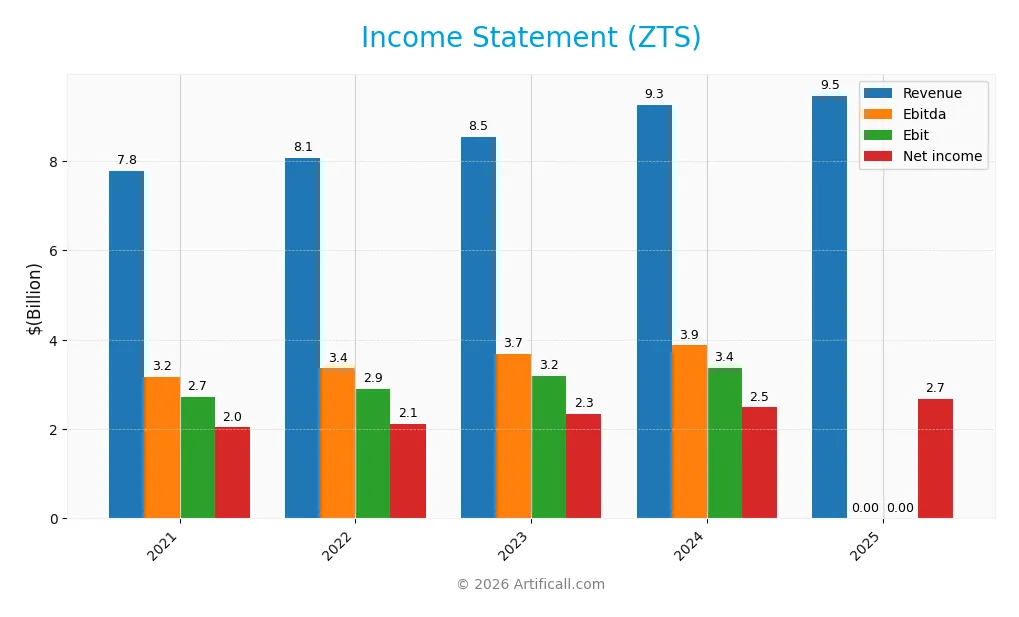
This table presents Zoetis Inc.’s key income statement figures from 2021 to 2025, highlighting revenue, expenses, profitability, and earnings per share.
| 2021 | 2022 | 2023 | 2024 | 2025 | |
|---|---|---|---|---|---|
| Revenue | 7.78B | 8.08B | 8.54B | 9.26B | 9.47B |
| Cost of Revenue | 2.46B | 2.60B | 2.71B | 2.86B | 0 |
| Operating Expenses | 2.51B | 2.55B | 2.77B | 3.00B | 3.08B |
| Gross Profit | 5.31B | 5.48B | 5.83B | 6.40B | 0 |
| EBITDA | 3.17B | 3.36B | 3.69B | 3.87B | 0 |
| EBIT | 2.72B | 2.89B | 3.19B | 3.38B | 0 |
| Interest Expense | 236M | 237M | 258M | 242M | 222M |
| Net Income | 2.04B | 2.11B | 2.34B | 2.49B | 2.67B |
| EPS | 4.29 | 4.51 | 5.08 | 5.47 | 6.03 |
| Filing Date | 2022-02-15 | 2023-02-14 | 2024-02-13 | 2025-02-13 | 2026-02-12 |
Income Statement Evolution
From 2021 to 2025, Zoetis’s revenue grew 21.75%, showing steady top-line expansion. Net income increased 31.22%, outpacing revenue growth, which improved net margins by 7.78 percentage points. However, the last year saw a slowdown in revenue growth to 2.28%, with gross profit and EBIT margins sharply deteriorating, signaling margin pressure despite higher net income.
Is the Income Statement Favorable?
In 2025, Zoetis reported $9.47B revenue and $2.67B net income, yielding a favorable 28.23% net margin. Interest expense was well-controlled at 2.34% of revenue. Yet, missing gross profit and EBIT figures raise questions about underlying profitability. Despite this, EPS grew 10.05%, supporting a generally favorable income statement with some margin concerns to monitor.
Financial Ratios
The following table presents key financial ratios for Zoetis Inc. over the last five fiscal years, illustrating profitability, liquidity, leverage, valuation, and efficiency metrics:
| Ratios | 2021 | 2022 | 2023 | 2024 | 2025 |
|---|---|---|---|---|---|
| Net Margin | 26.2% | 26.2% | 27.4% | 26.9% | 28.2% |
| ROE | 44.8% | 48.0% | 46.9% | 52.1% | 80.2% |
| ROIC | 18.9% | 17.8% | 19.7% | 22.2% | 0 |
| P/E | 56.8 | 32.5 | 38.8 | 29.8 | 20.9 |
| P/B | 25.5 | 15.6 | 18.2 | 15.5 | 16.7 |
| Current Ratio | 3.86 | 2.37 | 3.36 | 1.75 | 3.03 |
| Quick Ratio | 2.79 | 1.63 | 2.00 | 1.08 | 1.94 |
| D/E | 1.48 | 1.84 | 1.35 | 1.41 | 0.06 |
| Debt-to-Assets | 48.5% | 54.2% | 47.3% | 47.4% | 1.3% |
| Interest Coverage | 11.9 | 12.4 | 11.9 | 14.0 | 0 |
| Asset Turnover | 0.56 | 0.54 | 0.60 | 0.65 | 0.61 |
| Fixed Asset Turnover | 2.99 | 2.72 | 2.49 | 2.56 | 2.39 |
| Dividend Yield | 0.41% | 0.89% | 0.76% | 1.06% | 1.59% |
Evolution of Financial Ratios
Zoetis’s Return on Equity (ROE) surged sharply to 80.25% in 2025 from below 50% in prior years, signaling improved profitability. The Current Ratio rose to 3.03, indicating stronger liquidity compared to previous years’ fluctuations. Meanwhile, the Debt-to-Equity Ratio sharply declined to 0.06, reflecting a significant reduction in leverage and enhancing financial stability.
Are the Financial Ratios Fovorable?
In 2025, Zoetis demonstrates favorable profitability with a 28.23% net margin and a robust 80.25% ROE. Liquidity is mixed: the quick ratio at 1.94 is favorable, but the higher current ratio flags potential inefficiency. Low debt-to-equity (0.06) and debt-to-assets (1.27%) ratios indicate conservative leverage. However, unfavorable interest coverage at zero raises caution. Overall, ratios appear slightly favorable, balancing strengths and weaknesses.
Shareholder Return Policy
Zoetis maintains a consistent dividend payout ratio near 30-33%, with a dividend yield around 1.5% in 2025 and a steadily rising dividend per share reaching $2.00. The company supports payouts through robust free cash flow coverage and also conducts share buybacks, enhancing shareholder returns.
This balanced approach signals disciplined capital allocation. Dividend payments remain sustainable, backed by strong net margins and cash flow metrics. Share buybacks complement dividends, collectively fostering long-term shareholder value without indicating excessive risk from distributions or repurchases.
Score analysis
The following radar chart illustrates Zoetis Inc.’s key financial scores across valuation, profitability, and leverage metrics:
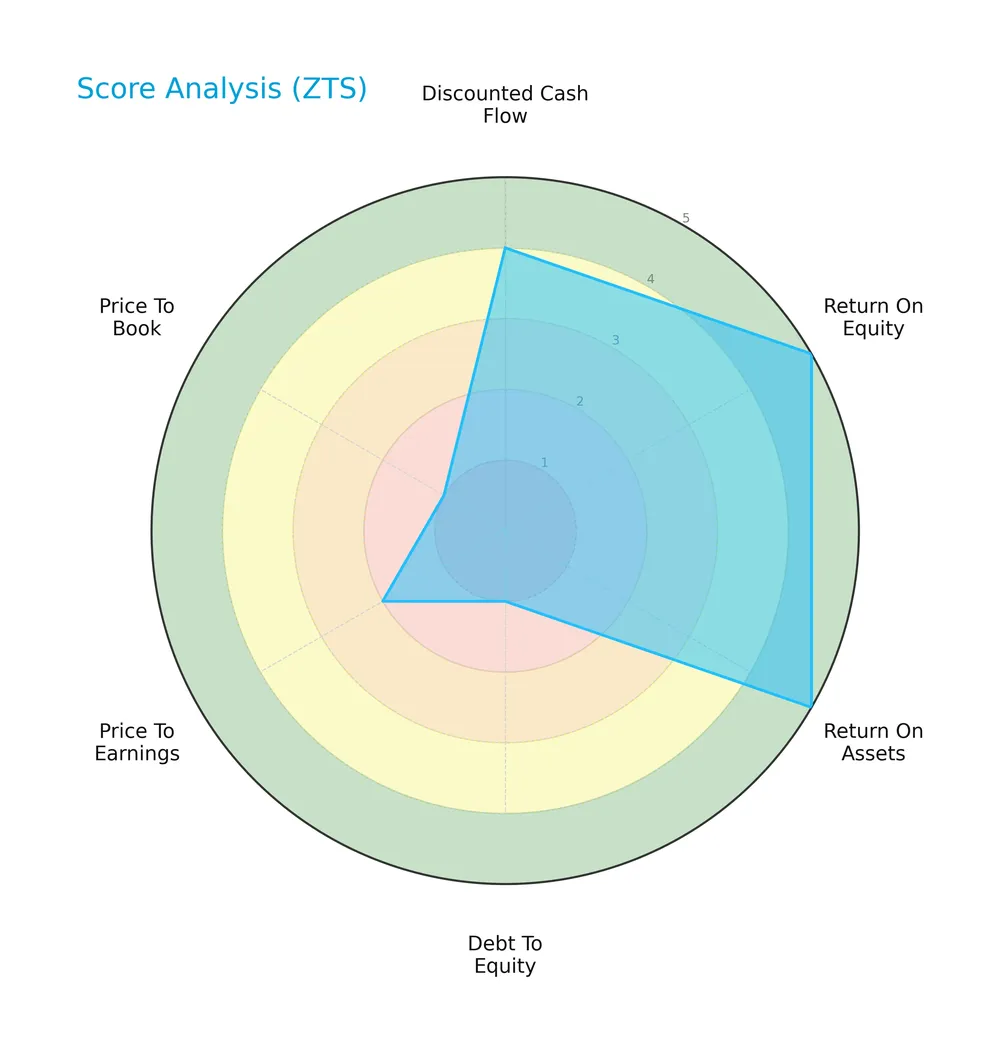
Zoetis scores very favorably on return on equity and assets with top marks. Its discounted cash flow score is favorable. However, debt-to-equity and valuation ratios (PE and PB) are very unfavorable, indicating leverage concerns and rich pricing.
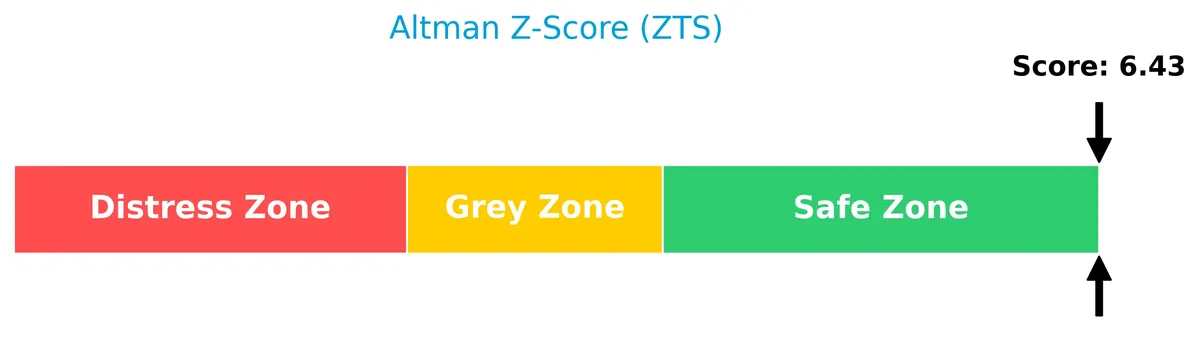
Analysis of the company’s bankruptcy risk
Zoetis displays a strong financial stability profile with an Altman Z-Score well within the safe zone:
Is the company in good financial health?
This Piotroski Score diagram highlights Zoetis’s solid financial strength based on profitability, liquidity, and efficiency:
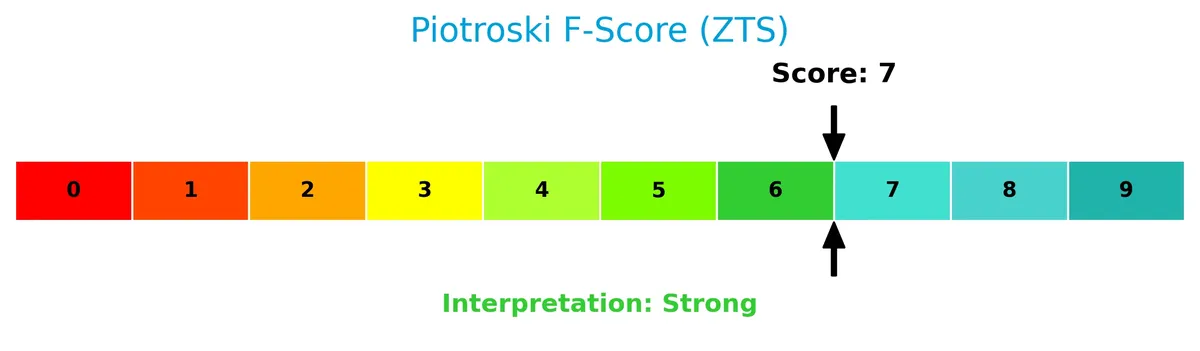
A score of 7 indicates strong financial health, suggesting the company maintains robust fundamentals and operational effectiveness.
Competitive Landscape & Sector Positioning
This analysis explores Zoetis Inc.’s strategic positioning, revenue segments, key products, main competitors, and SWOT. I will assess whether Zoetis holds a competitive advantage over its rivals.
Strategic Positioning
Zoetis operates with a diversified product portfolio emphasizing livestock and companion animals, generating significant revenue from horses and cattle. Geographically, it balances exposure between the US (5.1B) and international markets (4.3B), reflecting strategic global expansion in animal health pharmaceuticals and diagnostics.
Revenue by Segment
This pie chart illustrates Zoetis Inc.’s revenue distribution by product segment for fiscal year 2025, highlighting key animal categories that generate sales.
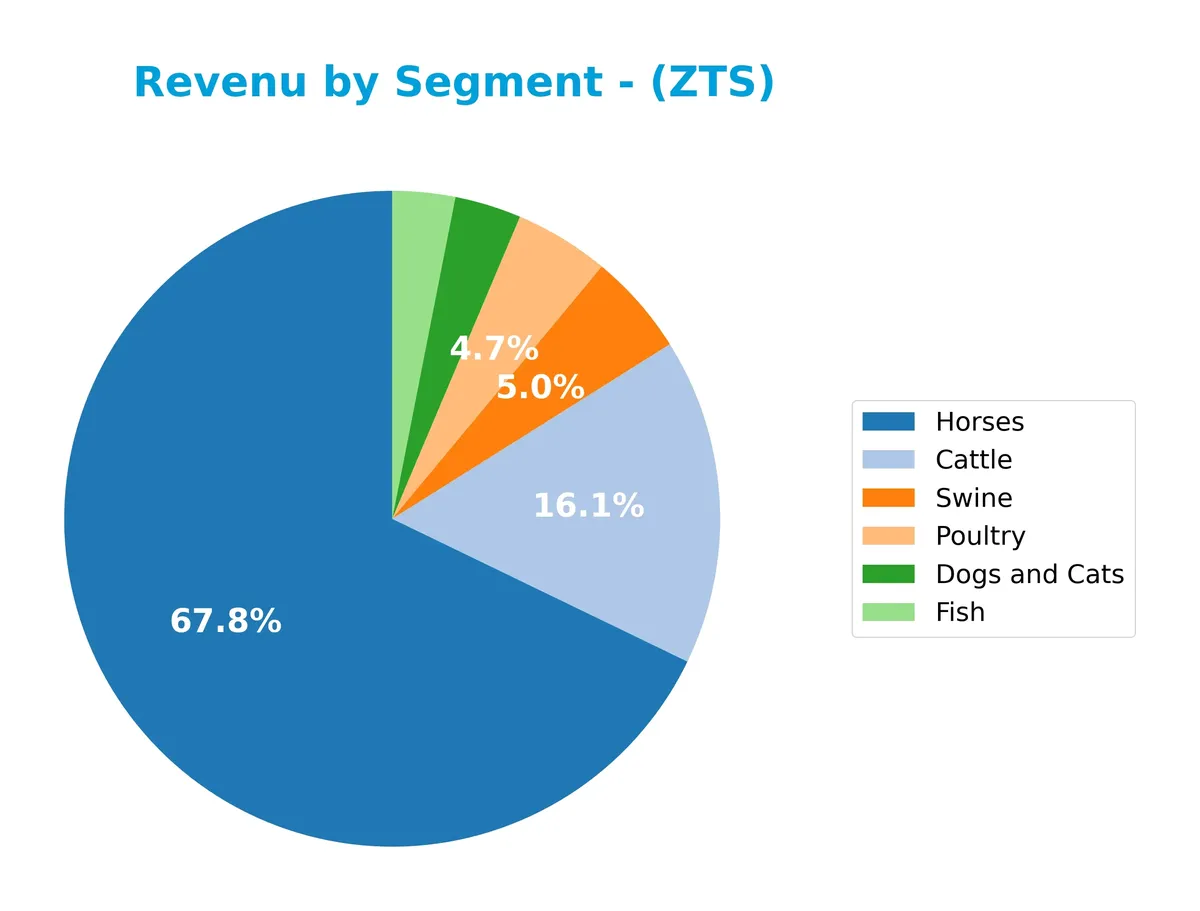
Horses dominate Zoetis’ revenue with $6.3B in 2025, showing steady growth over recent years. Cattle remains a solid contributor at $1.5B but is slightly declining. Smaller segments like Dogs and Cats ($304M) and Fish ($286M) exhibit modest growth. The concentration in Horses creates some risk, but the company’s diverse portfolio limits overreliance on any single segment.
Key Products & Brands
The following table outlines Zoetis Inc.’s key products and brands by animal species and product categories:
| Product | Description |
|---|---|
| Livestock: Cattle | Medicines, vaccines, diagnostics, and feed additives for cattle health and disease control. |
| Livestock: Swine | Pharmaceutical and preventive products targeting swine health and productivity. |
| Livestock: Poultry | Vaccines, anti-infectives, and parasiticides for poultry disease prevention and treatment. |
| Livestock: Fish | Specialized health products for aquaculture species including vaccines and diagnostics. |
| Livestock: Horses | Medicines, vaccines, and diagnostics tailored for equine health management. |
| Companion Animals: Dogs and Cats | Pharmaceuticals, vaccines, and diagnostics focused on common pets’ health needs. |
| Other: Sheep and Other | Veterinary products for sheep and miscellaneous animal species (limited data). |
Zoetis offers a broad portfolio of animal health products covering multiple species. Its focus spans vaccines, anti-infectives, parasiticides, pain management, diagnostics, and nutraceuticals, addressing both livestock and companion animal markets.
Main Competitors
There are 2 competitors in total; the table below lists the top 2 leaders by market capitalization:
| Competitor | Market Cap. |
|---|---|
| Zoetis Inc. | 55.5B |
| Viatris Inc. | 14.4B |
Zoetis Inc. ranks 1st among its competitors, with a market cap slightly above the leader at 1.01x. It stands well above both the average market cap of the top 10 (35B) and the sector median (35B). The company shows a significant 289% gap over its closest competitor, Viatris Inc., highlighting its dominant market position.
Comparisons with competitors
Check out how we compare the company to its competitors:
Does Zoetis Inc. have a competitive advantage?
Zoetis currently lacks a competitive advantage, as its ROIC falls significantly below WACC and shows a steep decline, indicating value destruction and declining profitability. Despite favorable net margin metrics, the company’s core profitability and capital efficiency have deteriorated over 2021-2025.
Looking ahead, Zoetis pursues growth through diverse animal health products and expanding international markets, including diagnostics and biologics. This broad portfolio and global reach offer opportunities to regain profitability and enhance competitive positioning.
SWOT Analysis
This analysis highlights Zoetis Inc.’s key internal and external factors shaping its strategic outlook.
Strengths
- strong US market presence
- diverse product portfolio across livestock and companion animals
- favorable net margin and ROE
Weaknesses
- declining ROIC, destroying value
- high price-to-book ratio signals overvaluation
- unfavorable income growth in recent year
Opportunities
- expanding international markets
- rising demand for animal health products
- innovations in diagnostics and precision animal health
Threats
- intense competition in specialty pharmaceuticals
- regulatory risks in healthcare sector
- currency fluctuations impacting international sales
Zoetis benefits from a solid market position and profitability but faces critical challenges in capital efficiency. The company must leverage growth opportunities abroad and innovation while managing valuation risks and competitive pressures.
Stock Price Action Analysis
The weekly stock chart below highlights Zoetis Inc.’s price movements and volatility over the last 12 months:
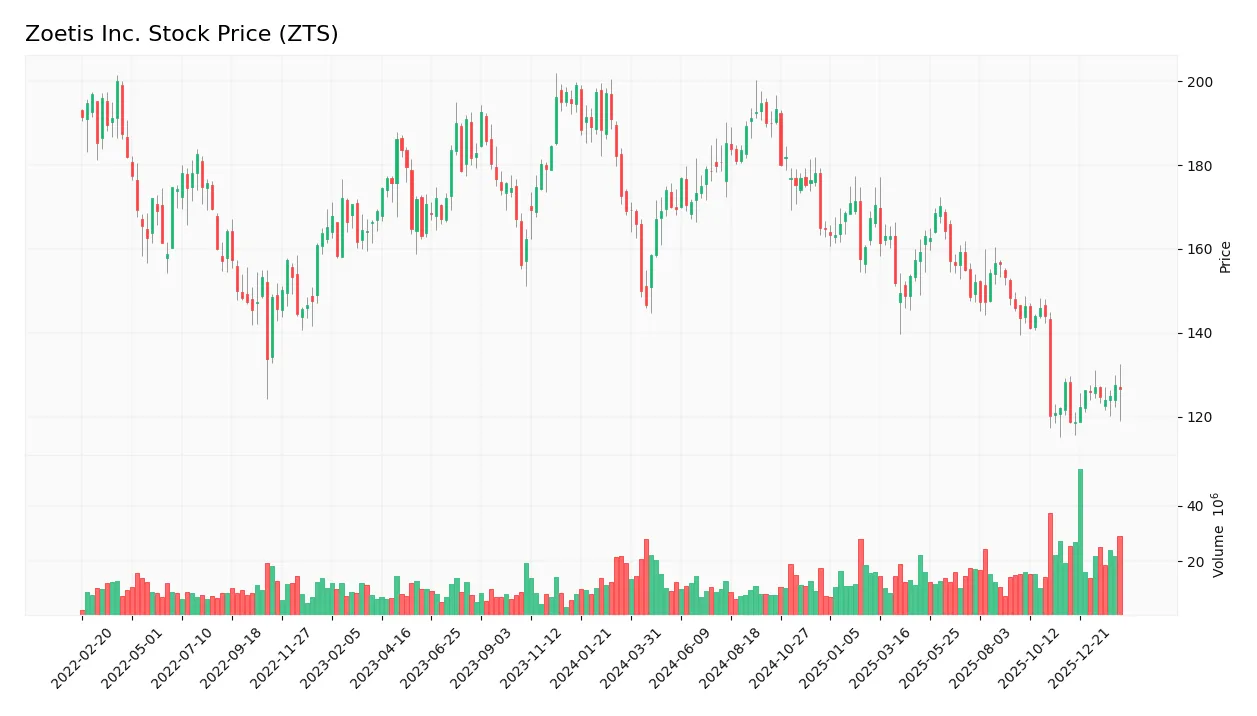
Trend Analysis
Over the past 12 months, Zoetis’ stock price declined sharply by 25.01%, indicating a clear bearish trend. The price trend accelerated downward, with high volatility reflected in a 19.65 standard deviation. The stock reached a high of 194.81 and a low of 118.65, confirming strong downside momentum.
Volume Analysis
Trading volume is increasing and shows a buyer-driven pattern. Buyers accounted for 61.97% of volume recently, up from 52.38% overall. This rising buyer dominance suggests improving investor interest despite the bearish price trend.
Target Prices
Analysts present a confident target consensus for Zoetis Inc., reflecting steady growth expectations.
| Target Low | Target High | Consensus |
|---|---|---|
| 135 | 160 | 141.17 |
The target range suggests moderate upside potential, with consensus clustering near 141, indicating market optimism balanced by cautious valuation.

Don’t Let Luck Decide Your Entry Point
Optimize your entry points with our advanced ProRealTime indicators. You’ll get efficient buy signals with precise price targets for maximum performance. Start outperforming now!
Analyst & Consumer Opinions
This section examines Zoetis Inc.’s analyst ratings and consumer feedback to provide a balanced view of market sentiment.
Stock Grades
Here is a summary of recent analyst grades for Zoetis Inc., reflecting a range of opinions from key financial institutions:
| Grading Company | Action | New Grade | Date |
|---|---|---|---|
| B of A Securities | Maintain | Neutral | 2026-02-13 |
| Piper Sandler | Downgrade | Neutral | 2026-01-22 |
| BTIG | Maintain | Buy | 2025-12-03 |
| Stifel | Maintain | Hold | 2025-11-18 |
| BTIG | Maintain | Buy | 2025-11-12 |
| Morgan Stanley | Maintain | Overweight | 2025-11-10 |
| JP Morgan | Maintain | Overweight | 2025-11-05 |
| UBS | Maintain | Neutral | 2025-11-05 |
| UBS | Maintain | Neutral | 2025-10-20 |
| Argus Research | Maintain | Buy | 2025-09-09 |
The consensus trend shows a steady mix of Buy and Neutral ratings, with no recent Sell recommendations. This suggests balanced investor sentiment with cautious optimism prevailing among analysts.
Consumer Opinions
Consumers express a mix of admiration and concern about Zoetis Inc., reflecting its complex market position.
| Positive Reviews | Negative Reviews |
|---|---|
| “Zoetis offers reliable, innovative animal health products that improve livestock care.” | “Pricing can be steep, impacting smaller farms’ budgets.” |
| “Their customer service responds quickly to inquiries and technical support.” | “Some customers experienced delays in product delivery.” |
| “Consistent product quality with noticeable results in animal health.” | “Limited availability of certain specialty products in rural areas.” |
Overall, customers praise Zoetis for product quality and innovation. However, pricing and distribution challenges recur as notable drawbacks, especially for smaller or remote customers.
Risk Analysis
Below is a summary table of key risks facing Zoetis Inc. as of 2026:
| Category | Description | Probability | Impact |
|---|---|---|---|
| Financial Health | Low interest coverage ratio indicates potential difficulty servicing debt | Medium | High |
| Valuation | Elevated price-to-book ratio signals possible overvaluation | High | Medium |
| Operational | Moderate asset turnover may constrain revenue growth | Medium | Medium |
| Market Sensitivity | Beta near 1 suggests stock moves roughly with market fluctuations | Medium | Medium |
| Industry | Regulatory changes in animal health could impact product approvals | Medium | High |
I identify the low interest coverage ratio as the most critical red flag. Despite a strong Altman Z-Score indicating financial safety, Zoetis’s inability to cover interest expenses raises caution. The stock’s high valuation metrics further heighten risk amid market volatility and regulatory uncertainties. Investors must weigh these risks against Zoetis’s robust profitability and low leverage.
Should You Buy Zoetis Inc.?
Zoetis appears to be a company with robust profitability and operational efficiency, yet it suffers from a very unfavorable moat due to declining ROIC versus WACC, indicating value destruction. Despite a substantial leverage profile, its overall rating is a moderate B+, suggesting cautious optimism.
Strength & Efficiency Pillars
Zoetis Inc. displays robust profitability with a net margin of 28.23% and an impressive return on equity of 80.25%. The company maintains a strong Piotroski score of 7, signaling solid financial health. Its Altman Z-Score of 6.43 firmly places it in the safe zone, confirming strong solvency. However, the ROIC is currently at 0%, below its WACC of 8.43%, indicating Zoetis is not creating value through capital deployment, which is a critical operational inefficiency.
Weaknesses and Drawbacks
Despite its safety standing, Zoetis faces valuation challenges with a high price-to-book ratio of 16.75 and a moderate P/E of 20.87, suggesting the stock trades at a premium relative to book value. The current ratio of 3.03, though seemingly healthy, is flagged unfavorable, possibly indicating inefficient asset use or liquidity imbalances. Additionally, negative gross margin and EBIT margin trends raise concerns about cost management and operational leverage, which could pressure future earnings.
Our Final Verdict about Zoetis Inc.
Zoetis presents a fundamentally strong profile with solid solvency and profitability. Yet, its lack of value creation through capital reinvestment and valuation premiums inject caution. Despite a bearish long-term trend, recent buyer dominance and volume increase may hint at potential stabilization. This profile might appear suitable for investors seeking exposure in a resilient but operationally challenged name, though timing entry carefully is advisable.
Disclaimer: This content is for informational purposes only and does not constitute financial, investment, or other professional advice. Investing in financial markets involves a significant risk of loss, and past performance is not indicative of future results.
Additional Resources
- ING Groep NV Takes $4.58 Million Position in Zoetis Inc. $ZTS – MarketBeat (Feb 13, 2026)
- ZTS Q4 Deep Dive: Product Innovation and Competitive Pressures Shape Outlook – Finviz (Feb 13, 2026)
- Zoetis Inc. (ZTS): Navigating Innovation and Safety in a Mature Animal Health Market – FinancialContent (Feb 12, 2026)
- Decoding Zoetis Inc (ZTS): A Strategic SWOT Insight – GuruFocus (Feb 13, 2026)
- Zoetis Inc. (NYSE:ZTS) Q4 2025 Earnings Call Transcript – Insider Monkey (Feb 13, 2026)
For more information about Zoetis Inc., please visit the official website: zoetis.com