Home > Analyses > Healthcare > RadNet, Inc.
RadNet, Inc. transforms healthcare by delivering critical outpatient diagnostic imaging across the United States. It dominates with a network of 347 centers and advanced imaging technologies like MRI, CT, and AI-powered cancer detection tools. Renowned for innovation and quality, RadNet shapes patient outcomes and industry standards alike. As healthcare evolves, I question whether RadNet’s current fundamentals justify its premium valuation and growth ambitions in a competitive market.

Table of contents
Business Model & Company Overview
RadNet, Inc. operates a vast network of 347 outpatient diagnostic imaging centers across the US. Founded in 1981 and headquartered in Los Angeles, it integrates advanced imaging modalities like MRI, CT, and mammography into a comprehensive healthcare ecosystem. Its mission centers on delivering precise diagnostics through cutting-edge technology and AI-powered imaging solutions, reinforcing its stature in the medical diagnostics industry.
The company’s revenue engine balances high-value diagnostic services with innovative software systems, including AI suites for cancer detection. RadNet’s footprint spans key US states, leveraging scale and technology to serve a diverse patient base. This combination of physical assets and proprietary software underpins a durable competitive advantage, positioning RadNet to shape the future of outpatient diagnostic imaging.
Financial Performance & Fundamental Metrics
I analyze RadNet, Inc.’s income statement, key financial ratios, and dividend payout policy to assess its profitability, efficiency, and shareholder returns.
Income Statement
The table below summarizes RadNet, Inc.’s key income statement figures from 2021 to 2025, reflecting revenue, expenses, profits, and earnings per share trends.

| 2021 | 2022 | 2023 | 2024 | 2025 | |
|---|---|---|---|---|---|
| Revenue | 1.32B | 1.43B | 1.62B | 1.83B | 2.04B |
| Cost of Revenue | 1.12B | 1.26B | 1.40B | 1.58B | 0 |
| Operating Expenses | 109M | 119M | 123M | 144M | 1.98B |
| Gross Profit | 192M | 166M | 221M | 249M | 0 |
| EBITDA | 278M | 279M | 293M | 263M | 254M |
| EBIT | 108M | 94M | 103M | 125M | 0 |
| Interest Expense | 49M | 51M | 64M | 80M | 70M |
| Net Income | 25M | 11M | 3M | 3M | 47M |
| EPS | 0.47 | 0.19 | 0.05 | 0.04 | -0.25 |
| Filing Date | 2022-03-01 | 2023-03-01 | 2024-02-29 | 2025-03-03 | 2026-03-02 |
Income Statement Evolution
RadNet’s revenue rose 55% from 2021 to 2025, with a strong 11.5% increase in the last year. Net income nearly doubled over the period, reflecting a 22% margin improvement. However, gross profit and EBIT margins collapsed in 2025, indicating rising costs or accounting changes. Net margin growth was positive but remains low at 2.3%.
Is the Income Statement Favorable?
In 2025, RadNet reported $2.04B revenue and $47M net income, a 2.3% margin. Interest expense stayed favorable at 3.4% of revenue, supporting profitability. Yet, the absence of reported gross profit and EBIT raises concerns about cost structure transparency. Overall, the income statement shows mixed fundamentals with significant margin weaknesses alongside moderate growth.
Financial Ratios
The table below presents key financial ratios for RadNet, Inc. (RDNT) over the fiscal years 2021 to 2025, providing insight into profitability, valuation, liquidity, leverage, efficiency, and dividend metrics:
| Ratios | 2021 | 2022 | 2023 | 2024 | 2025 |
|---|---|---|---|---|---|
| Net Margin | 1.9% | 0.7% | 0.2% | 0.2% | 2.3% |
| ROE | 10.8% | 3.2% | 0.5% | 0.3% | 4.3% |
| ROIC | 3.5% | 1.8% | 3.3% | 3.1% | 1.9% |
| P/E | 63.9 | 99.5 | 726.2 | 1826.3 | 114.7 |
| P/B | 6.9 | 3.2 | 3.5 | 5.7 | 4.9 |
| Current Ratio | 0.9 | 0.8 | 1.3 | 2.1 | 1.8 |
| Quick Ratio | 0.9 | 0.8 | 1.3 | 2.1 | 1.8 |
| D/E | 6.1 | 4.5 | 2.4 | 1.9 | 1.7 |
| Debt-to-Assets | 68.0% | 62.2% | 55.4% | 52.6% | 49.5% |
| Interest Coverage | 1.7 | 0.9 | 1.5 | 1.3 | 0.9 |
| Asset Turnover | 0.64 | 0.59 | 0.60 | 0.56 | 0.54 |
| Fixed Asset Turnover | 1.23 | 1.22 | 1.35 | 1.37 | 0.68 |
| Dividend Yield | 0% | 0% | 0% | 0% | 0% |
Evolution of Financial Ratios
RadNet’s Return on Equity (ROE) declined from 10.8% in 2021 to 4.3% in 2025, signaling weakening profitability. The Current Ratio improved steadily from 0.87 to 1.76, indicating better liquidity. Debt-to-Equity Ratio contracted from 6.11 in 2021 to 1.71 in 2025, showing a meaningful reduction in leverage.
Are the Financial Ratios Favorable?
In 2025, RadNet’s profitability ratios remain unfavorable, with a low net margin of 2.29% and ROIC at 1.9%, both below cost of capital at 8.25%. Liquidity ratios, including a Current Ratio of 1.76, are favorable, suggesting sufficient short-term assets. However, high leverage (D/E 1.71) and weak interest coverage mark risk areas. Overall, the ratio profile is predominantly unfavorable.
Shareholder Return Policy
RadNet, Inc. does not pay dividends, reflecting a focus on reinvestment and growth rather than immediate shareholder distributions. The company maintains share buybacks, although specific volumes are not disclosed, signaling some return of capital to shareholders.
This approach aligns with RadNet’s emphasis on capital allocation toward operations and debt management. The absence of dividends, combined with buybacks, suggests a strategy prioritizing long-term value creation, but investors should monitor cash flow coverage and leverage levels for sustainability.
Score analysis
Here is a radar chart illustrating RadNet, Inc.’s key financial metric scores:
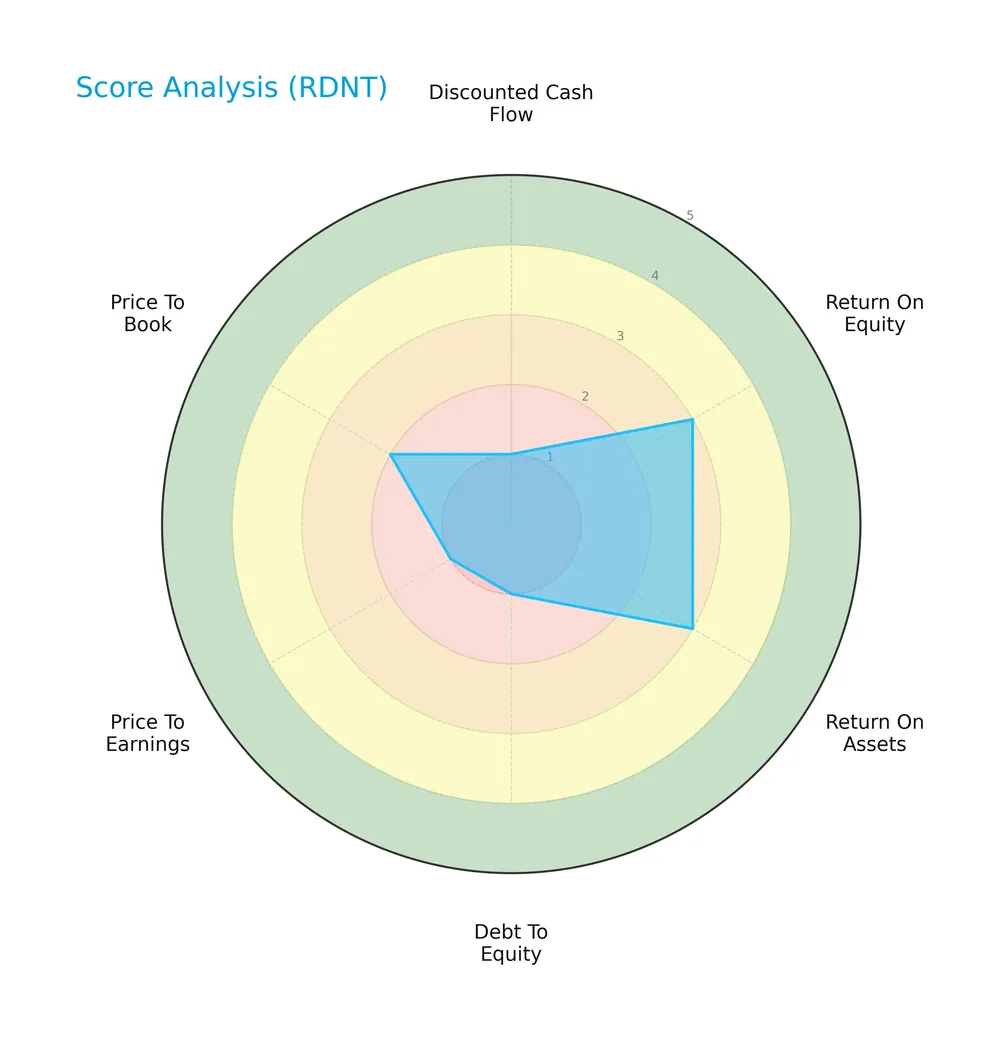
RadNet shows moderate scores in return on equity and assets at 3 each. However, discounted cash flow, debt-to-equity, and price-to-earnings scores are very unfavorable, reflecting financial and valuation challenges. The price-to-book ratio also rates as unfavorable.
Analysis of the company’s bankruptcy risk
RadNet’s Altman Z-Score places the company in the grey zone, indicating a moderate risk of bankruptcy:

Is the company in good financial health?
The Piotroski Score diagram below reflects RadNet’s financial health assessment:
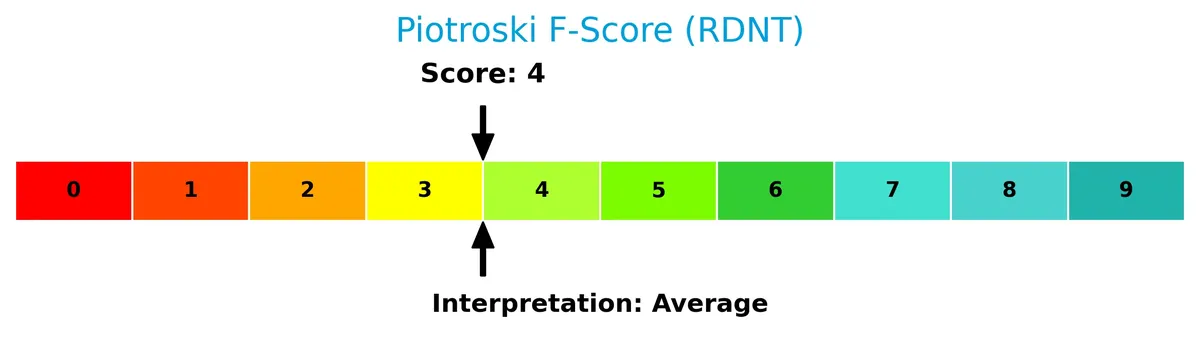
With a Piotroski Score of 4, RadNet’s financial strength is average, suggesting mixed signals in profitability, leverage, and efficiency metrics. This score indicates the company is neither distinctly strong nor weak financially.
Competitive Landscape & Sector Positioning
This section examines RadNet, Inc.’s strategic positioning within the medical diagnostics sector, focusing on revenue streams and key products. I will assess whether RadNet holds a competitive advantage over its main industry rivals.
Strategic Positioning
RadNet concentrates its portfolio on outpatient diagnostic imaging services primarily in the United States, with over 2B USD revenue in 2025. It offers diverse modalities and AI-enhanced diagnostics but has minimal international exposure, reflecting a focused geographic and product strategy.
Revenue by Segment
The pie chart illustrates RadNet, Inc.’s revenue distribution by segment for the fiscal year 2025, highlighting the company’s diverse income sources.
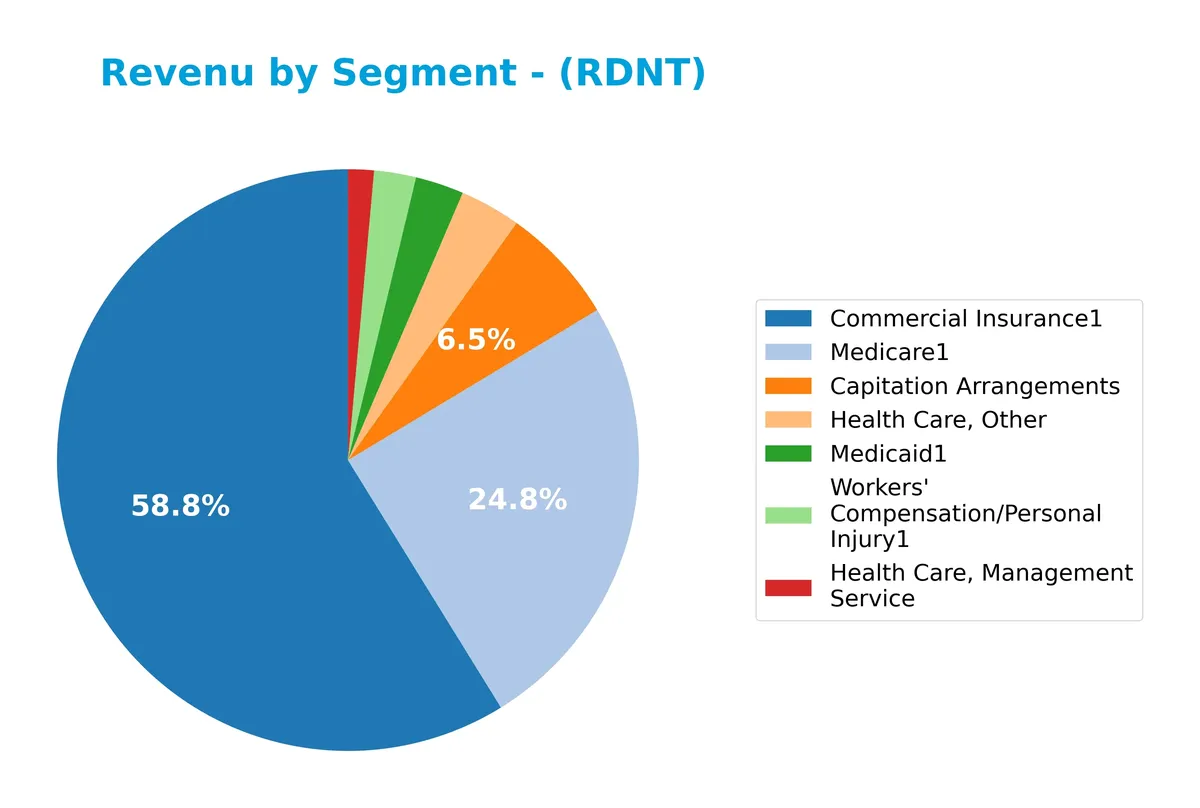
Commercial Insurance leads with $1.13B, followed by Medicare at $477M, showing clear dominance in RadNet’s revenue profile. Capitation Arrangements contribute $126M, while smaller segments like Health Care, Other ($65M) and Workers’ Compensation ($45M) round out the mix. The 2025 figures reveal accelerated growth in Commercial Insurance and Medicare, underscoring concentration risk but confirming these as the primary revenue engines.
Key Products & Brands
The following table outlines RadNet, Inc.’s main products and revenue segments in diagnostic imaging and related services:
| Product | Description |
|---|---|
| Capitation Arrangements | Fixed payments from health plans for providing diagnostic imaging services to enrolled patients. |
| Commercial Insurance | Revenue from imaging services billed to private health insurance providers. |
| Health Care, Management Service | Management and administrative services supporting healthcare delivery. |
| Health Care, Other | Miscellaneous healthcare-related services outside core imaging. |
| Medicaid | Imaging services reimbursed through Medicaid programs. |
| Medicare | Imaging services reimbursed through Medicare programs. |
| Workers’ Compensation/Personal Injury | Imaging services related to workers’ compensation and injury claims. |
| Health Care, Patient Service | Direct patient services primarily related to diagnostic imaging procedures. |
| Software and Teleradiology | Development and deployment of diagnostic imaging software and remote radiology interpretation. |
| Imaging On Call | On-demand imaging services available outside regular hours. |
| Investment Advisory, Management and Administrative Service | Advisory and administrative services in healthcare management. |
| License | Licensing revenue for proprietary technology or software. |
RadNet generates the bulk of its revenue from commercial insurance and government programs like Medicare and Medicaid. Its offerings span outpatient imaging, management services, and software solutions supporting radiology workflows.
Main Competitors
RadNet, Inc. faces competition from 11 companies in total; the table below lists the top 10 leaders by market capitalization:
| Competitor | Market Cap. |
|---|---|
| Thermo Fisher Scientific Inc. | 225B |
| Danaher Corporation | 165B |
| IDEXX Laboratories, Inc. | 53.5B |
| Agilent Technologies, Inc. | 39.1B |
| IQVIA Holdings Inc. | 38.4B |
| Mettler-Toledo International Inc. | 28.8B |
| Waters Corporation | 22.7B |
| Quest Diagnostics Incorporated | 19.4B |
| Revvity, Inc. | 11.6B |
| Charles River Laboratories International, Inc. | 10.0B |
RadNet ranks 11th among its peers, with a market cap just 2.6% of the leader, Thermo Fisher Scientific. It sits below both the 61.3B average market cap of the top 10 and the sector median of 28.8B. It trails its nearest competitor by a significant 71.1%, highlighting a notable scale gap in the sector.
Comparisons with competitors
Check out how we compare the company to its competitors:
Does RadNet have a competitive advantage?
RadNet does not present a competitive advantage as it shows a declining return on invested capital and consistently sheds value. Its ROIC is significantly below its cost of capital, indicating inefficiency in capital use.
Looking ahead, RadNet focuses on expanding AI-driven diagnostic imaging solutions and multi-modality services. These innovations target enhanced radiologist productivity and potential growth in cancer detection markets.
SWOT Analysis
This analysis highlights RadNet, Inc.’s key internal and external factors shaping its strategic outlook.
Strengths
- Leading outpatient diagnostic imaging provider
- Extensive U.S. center network
- Growing revenue base
Weaknesses
- Negative gross and EBIT margins
- High debt-to-equity ratio
- Weak ROIC below WACC
Opportunities
- AI integration in diagnostic imaging
- Expansion into new U.S. markets
- Increasing demand for outpatient services
Threats
- Intense competition in healthcare diagnostics
- Rising operational costs
- Regulatory and reimbursement risks
RadNet’s strengths in scale and innovation face challenges from profitability and leverage issues. Strategic focus should prioritize margin improvement and cautious debt management while capitalizing on AI-driven growth.
Stock Price Action Analysis
The weekly stock chart below illustrates RadNet, Inc.’s price movements over the past 12 months, highlighting key fluctuations and trends:
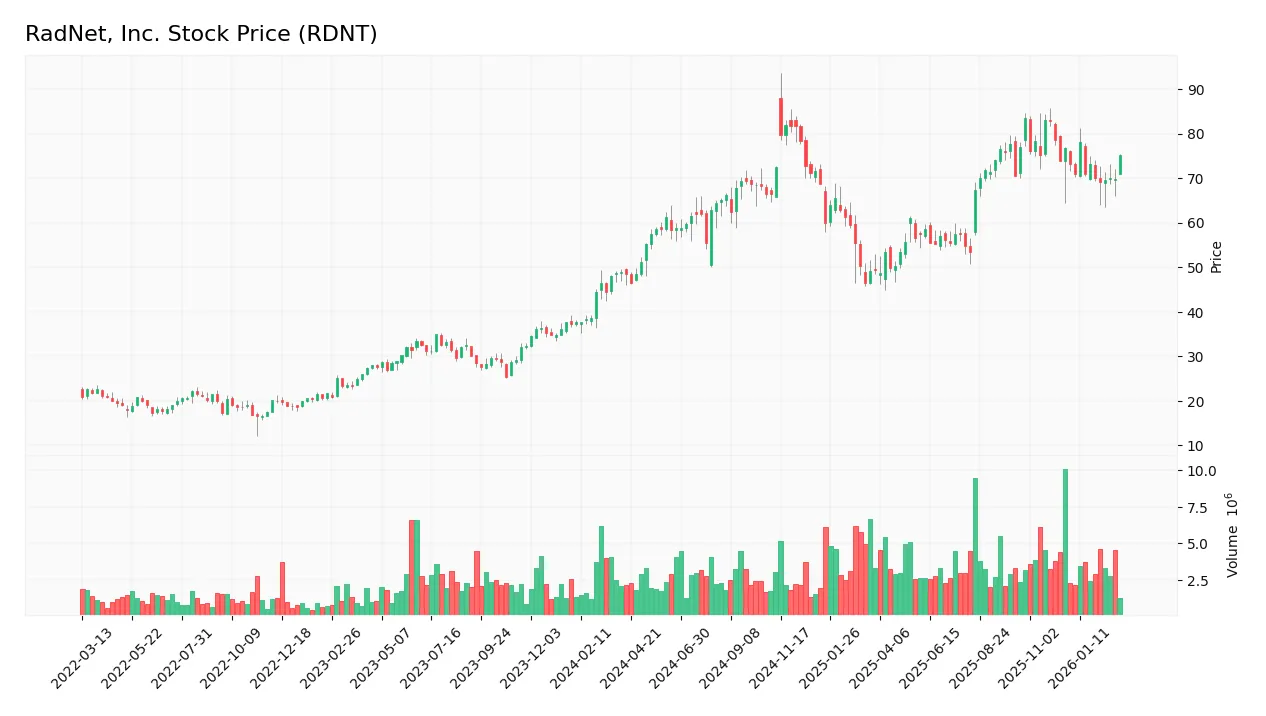
Trend Analysis
Over the past 12 months, RDNT’s stock price rose 55.09%, indicating a strong bullish trend with decelerating momentum. The price ranged from a low of 46.52 to a high of 83.41, with volatility measured by a 9.77 standard deviation. Recent months show a neutral trend with a slight 1.9% decline.
Volume Analysis
In the last three months, trading volume increased with a total of 44.6M shares traded. Buyer volume slightly dominates at 53.53%, suggesting mild buyer-driven activity. This rising volume alongside buyer dominance signals cautious optimism and moderate market participation.
Target Prices
Analysts project a strong upside for RadNet, Inc. with a tight target range.
| Target Low | Target High | Consensus |
|---|---|---|
| 90 | 95 | 92.25 |
The consensus target of 92.25 suggests confidence in RadNet’s growth potential, indicating a favorable market outlook.

Don’t Let Luck Decide Your Entry Point
Optimize your entry points with our advanced ProRealTime indicators. You’ll get efficient buy signals with precise price targets for maximum performance. Start outperforming now!
Analyst & Consumer Opinions
This section examines RadNet, Inc.’s analyst ratings and consumer feedback to provide a comprehensive sentiment overview.
Stock Grades
The latest verified analyst ratings for RadNet, Inc. highlight a consistent positive consensus across reputable firms:
| Grading Company | Action | New Grade | Date |
|---|---|---|---|
| B. Riley Securities | Maintain | Buy | 2025-12-01 |
| Barclays | Maintain | Overweight | 2025-11-13 |
| Truist Securities | Maintain | Buy | 2025-11-12 |
| Truist Securities | Maintain | Buy | 2025-09-03 |
| Barclays | Maintain | Overweight | 2025-09-03 |
| Raymond James | Maintain | Strong Buy | 2025-08-13 |
| Truist Securities | Maintain | Buy | 2025-04-11 |
| Barclays | Maintain | Overweight | 2025-03-24 |
| Raymond James | Upgrade | Strong Buy | 2025-03-05 |
| Truist Securities | Maintain | Buy | 2025-01-22 |
Analyst ratings for RadNet remain uniformly positive, with multiple firms maintaining Buy or Overweight grades. Raymond James notably upgraded to Strong Buy earlier in 2025, reinforcing bullish sentiment.
Consumer Opinions
RadNet, Inc. elicits a mixed but insightful range of consumer sentiments, reflecting its operational strengths and areas for improvement.
| Positive Reviews | Negative Reviews |
|---|---|
| “Efficient appointment scheduling and friendly staff.” | “Long wait times for test results cause frustration.” |
| “High-quality imaging technology enhances diagnosis.” | “Customer service can be unresponsive at times.” |
| “Convenient locations with flexible hours.” | “Billing errors complicate the payment process.” |
Overall, consumers praise RadNet’s advanced technology and accessibility. However, recurring complaints about delays and customer service suggest operational bottlenecks that merit management’s attention.
Risk Analysis
Below is a summary of key risks facing RadNet, Inc., categorized by type, likelihood, and potential impact:
| Category | Description | Probability | Impact |
|---|---|---|---|
| Financial Health | Low profitability and return on invested capital (ROIC 1.9% vs. WACC 8.25%) indicate economic strain. | High | High |
| Leverage | High debt-to-equity ratio (1.71) raises solvency concerns, compounded by zero interest coverage. | High | High |
| Valuation | Excessive valuation multiples (P/E 115, P/B 4.92) suggest overpricing and downside risk. | High | Medium |
| Liquidity | Current and quick ratios (1.76) remain adequate, reducing immediate liquidity risk. | Medium | Low |
| Bankruptcy Risk | Altman Z-Score (2.19) places RadNet in the grey zone, signaling moderate bankruptcy risk. | Medium | High |
| Operational | Moderate Piotroski Score (4) reflects average operational efficiency with room for improvement. | Medium | Medium |
The greatest concerns lie in RadNet’s financial health and leverage. The company’s ROIC fails to cover its cost of capital, indicating weak capital allocation and value destruction. Additionally, zero interest coverage signals potential difficulties servicing debt if earnings falter. Despite solid liquidity, these financial weaknesses heighten bankruptcy risk, underscored by the Altman Z-Score in the grey zone. Valuation also appears stretched relative to fundamentals, increasing downside pressure in a market correction. Investors should weigh these risks carefully against growth prospects.
Should You Buy RadNet, Inc.?
RadNet appears to have a challenged profitability profile with declining ROIC and value destruction. Despite manageable liquidity, its substantial leverage and unfavorable rating suggest a cautious outlook. The company’s financial health could be seen as weak, warranting prudent consideration.
Strength & Efficiency Pillars
RadNet, Inc. shows modest operational strength with a net margin of 2.29% and return on equity at 4.29%, signaling limited profitability. Its return on invested capital (ROIC) stands at 1.9%, below the weighted average cost of capital (WACC) of 8.25%, indicating the company is currently destroying value rather than creating it. The interest expense ratio of 3.43% is a rare bright spot, reflecting manageable financing costs despite broader challenges.
Weaknesses and Drawbacks
RadNet’s Altman Z-Score of 2.19 places it in the grey zone, signaling moderate bankruptcy risk and caution for investors. The price-to-earnings ratio of 114.7 and price-to-book ratio of 4.92 reflect a highly stretched valuation, increasing downside risk. A debt-to-equity ratio of 1.71 reveals significant leverage that may pressure financial flexibility. Additionally, negative earnings per share growth and unfavorable operational margins exacerbate concerns about sustainable profitability.
Our Final Verdict about RadNet, Inc.
Despite some operational improvements and a bullish long-term price trend, RadNet’s moderate solvency risk and stretched valuation suggest high caution. The company might appear attractive to speculative investors but remains too risky for conservative capital. Recent slight buyer dominance tempers short-term concerns but does not eliminate fundamental financial weaknesses.
Disclaimer: This content is for informational purposes only and does not constitute financial, investment, or other professional advice. Investing in financial markets involves a significant risk of loss, and past performance is not indicative of future results.
Additional Resources
- Decoding RadNet Inc (RDNT): A Strategic SWOT Insight – GuruFocus (Mar 03, 2026)
- RadNet (RDNT) expands imaging network and AI-powered Digital Health platform – Stock Titan (Mar 02, 2026)
- RadNet, Inc. to Present at the Raymond James 47th Annual Institutional Investors Conference on Tuesday, March 3rd, 2026 – Yahoo Finance Singapore (Mar 02, 2026)
- RadNet, Inc. (RDNT) Stock Analysis: Exploring an Attractive 31.43% Upside Potential in the Healthcare Sector – DirectorsTalk Interviews (Mar 02, 2026)
- Compared to Estimates, RadNet (RDNT) Q4 Earnings: A Look at Key Metrics – Nasdaq (Mar 02, 2026)
For more information about RadNet, Inc., please visit the official website: radnet.com