Home > Analyses > Industrials > Xylem Inc.
Xylem Inc. powers the essential flow of water that sustains communities and industries worldwide. Its engineered solutions span water infrastructure, applied water systems, and advanced measurement technologies, making it a linchpin in global water management. Known for innovation and quality, Xylem drives efficiency and sustainability across vital sectors. As water challenges intensify, I question whether Xylem’s strong fundamentals still justify its current market valuation and growth prospects.
Table of contents
Business Model & Company Overview
Xylem Inc., founded in 2011 and headquartered in Rye Brook, New York, leads the industrial machinery sector with a focus on water and wastewater solutions. Its integrated ecosystem spans Water Infrastructure, Applied Water, and Measurement & Control Solutions, delivering engineered products and services worldwide. The company’s portfolio underpins critical water transport, treatment, and management needs across residential, commercial, and industrial markets.
Xylem’s revenue engine balances durable hardware like pumps and valves with advanced software and recurring services such as cloud analytics and asset management. It commands a strategic presence across the Americas, Europe, and Asia-Pacific through direct sales and partners. This blend of innovation and scale forms a robust economic moat, positioning Xylem to shape the future of water technology globally.
Financial Performance & Fundamental Metrics
I analyze Xylem Inc.’s income statement, key financial ratios, and dividend payout policy to assess its profitability, efficiency, and shareholder returns.
Income Statement
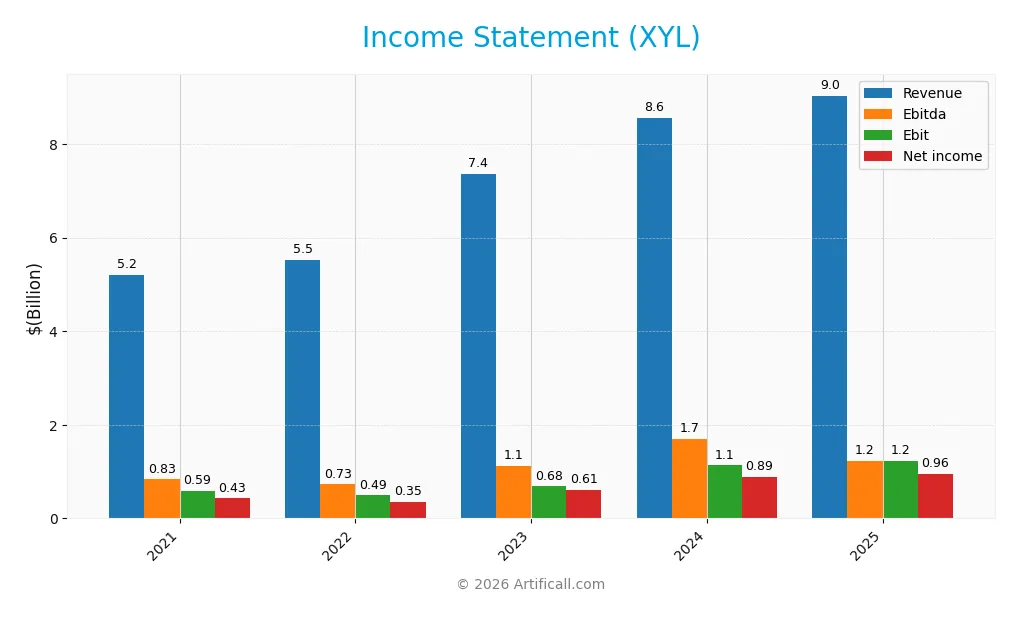
The table below presents Xylem Inc.’s key income statement figures for fiscal years 2021 through 2025, showing revenue, expenses, profits, and earnings per share.
| 2021 | 2022 | 2023 | 2024 | 2025 | |
|---|---|---|---|---|---|
| Revenue | 5.20B | 5.52B | 7.36B | 8.56B | 9.04B |
| Cost of Revenue | 3.22B | 3.44B | 4.65B | 5.35B | 5.56B |
| Operating Expenses | 1.39B | 1.46B | 2.07B | 2.20B | 2.25B |
| Gross Profit | 1.98B | 2.08B | 2.72B | 3.21B | 3.48B |
| EBITDA | 832M | 726M | 1.12B | 1.69B | 1.22B |
| EBIT | 587M | 490M | 684M | 1.13B | 1.22B |
| Interest Expense | 76M | 50M | 49M | 44M | 29M |
| Net Income | 427M | 355M | 609M | 890M | 957M |
| EPS | 2.37 | 1.97 | 2.81 | 3.67 | 3.93 |
| Filing Date | 2022-02-25 | 2023-02-24 | 2024-02-28 | 2025-03-03 | 2026-02-25 |
Income Statement Evolution
Xylem’s revenue advanced steadily, rising nearly 74% from 2021 to 2025. Net income more than doubled in the same period, reflecting robust margin expansion. Gross margin improved to 38.5%, while EBIT and net margins also strengthened, signaling effective cost control and operational leverage throughout the cycle.
Is the Income Statement Favorable?
In 2025, Xylem posted $9.04B revenue and $957M net income, with net and EBIT margins at 10.6% and 13.5% respectively. Interest expense remained low at 0.3% of revenue, supporting profitability. EPS grew 7.4% year-over-year. Overall, fundamentals appear favorable, with strong margin trends and disciplined expense management confirming solid earnings quality.
Financial Ratios
The following table presents key financial ratios for Xylem Inc. (XYL) from 2021 through 2025, illustrating profitability, liquidity, valuation, leverage, and efficiency metrics:
| Ratios | 2021 | 2022 | 2023 | 2024 | 2025 |
|---|---|---|---|---|---|
| Net Margin | 8.2% | 6.4% | 8.3% | 10.4% | 10.6% |
| ROE | 13.3% | 10.2% | 6.0% | 8.4% | 8.3% |
| ROIC | 7.0% | 7.8% | 4.5% | 5.8% | 6.4% |
| P/E | 50.6 | 56.1 | 40.7 | 31.6 | 34.6 |
| P/B | 6.7 | 5.7 | 2.4 | 2.6 | 2.9 |
| Current Ratio | 2.27 | 1.89 | 1.76 | 1.75 | 1.63 |
| Quick Ratio | 1.77 | 1.39 | 1.30 | 1.33 | 1.28 |
| D/E | 0.78 | 0.56 | 0.24 | 0.20 | 0.17 |
| Debt-to-Assets | 30.3% | 24.5% | 14.8% | 12.9% | 11.0% |
| Interest Coverage | 7.7 | 12.4 | 13.3 | 22.9 | 42.2 |
| Asset Turnover | 0.63 | 0.69 | 0.46 | 0.52 | 0.51 |
| Fixed Asset Turnover | 8.1 | 8.8 | 6.3 | 7.4 | 7.8 |
| Dividend Yield | 0.94% | 1.09% | 1.20% | 1.24% | 1.18% |
Evolution of Financial Ratios
From 2021 to 2025, Xylem Inc.’s Return on Equity (ROE) declined steadily from 13.27% to 8.34%, indicating weakening profitability. The Current Ratio decreased from 2.27 to 1.62, reflecting reduced short-term liquidity but still above 1. The Debt-to-Equity Ratio improved significantly, falling from 0.78 to 0.17, signaling stronger balance sheet stability.
Are the Financial Ratios Favorable?
In 2025, Xylem’s profitability shows mixed signals: a favorable net margin at 10.59% contrasts with an unfavorable ROE below WACC, indicating limited value creation for shareholders. Liquidity ratios are favorable, with current and quick ratios above 1. The debt profile is healthy, with low leverage and strong interest coverage. Efficiency metrics are neutral, and valuation multiples appear stretched, reflecting moderate market confidence. Overall, ratios are slightly favorable but warrant cautious interpretation.
Shareholder Return Policy
Xylem Inc. maintains a consistent dividend payout ratio around 40%, with dividends per share rising from $1.13 in 2021 to $1.61 in 2025. The annual dividend yield hovers near 1.2%, supported by share buybacks and coverage from free cash flow exceeding 70%.
This approach balances cash returns with capital expenditure needs, aiming for sustainable long-term value. Dividend payouts and repurchases appear prudent, given stable operating margins and manageable leverage, reducing risks of over-distribution or financial strain.
Score analysis
The following radar chart illustrates key financial scores for Xylem Inc., highlighting valuation and performance metrics:
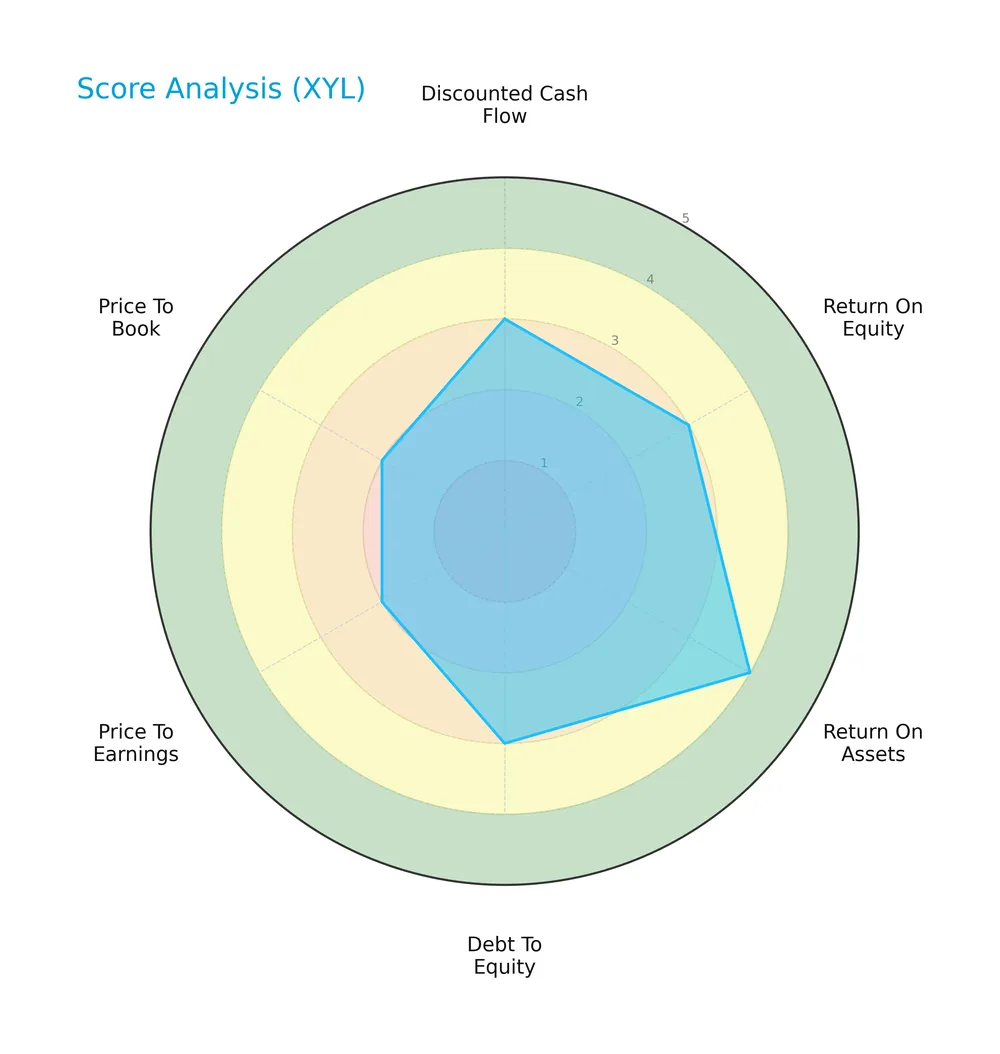
Xylem displays moderate scores in discounted cash flow, return on equity, and debt-to-equity, with a favorable return on assets score. However, valuation metrics such as price-to-earnings and price-to-book ratios appear less attractive.
Analysis of the company’s bankruptcy risk
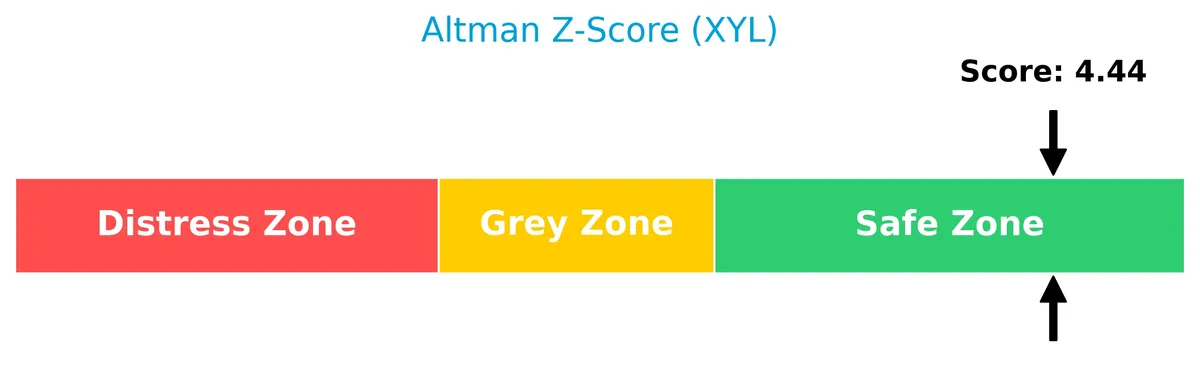
Xylem’s Altman Z-Score places it firmly in the safe zone, indicating a low risk of bankruptcy:
Is the company in good financial health?
This Piotroski diagram summarizes Xylem’s financial strength based on nine key criteria:
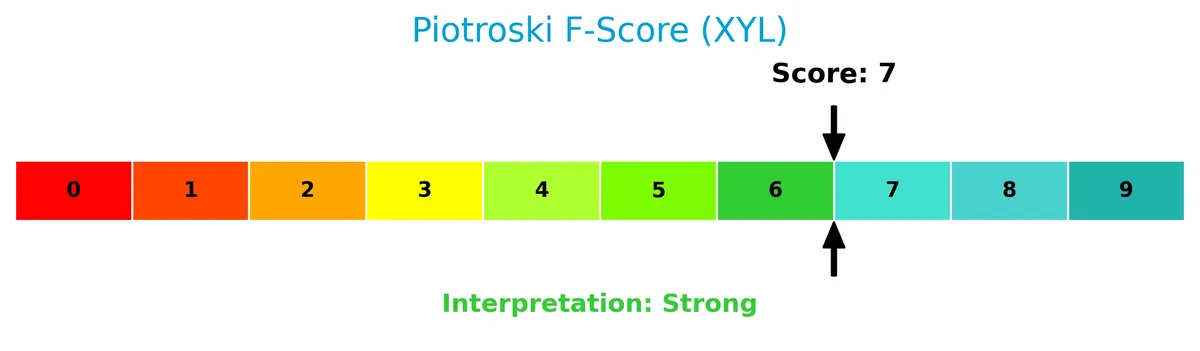
With a strong Piotroski Score of 7, Xylem demonstrates solid financial health and operational efficiency, suggesting resilience and effective management.
Competitive Landscape & Sector Positioning
This section examines Xylem Inc.’s strategic positioning, revenue segments, and key products within the industrial machinery sector. I will assess whether Xylem holds a competitive advantage over its main competitors in water and wastewater solutions.
Strategic Positioning
Xylem Inc. maintains a diversified product portfolio across Water Infrastructure, Applied Water, and Measurement & Control Solutions, while its geographic exposure spans the United States, Europe, Asia Pacific, and other countries, with the U.S. generating the largest revenue share of $5.2B in 2025.
Revenue by Segment
The pie chart illustrates Xylem Inc.’s revenue distribution by segment for fiscal year 2025, highlighting contributions from Applied Water, Measurement and Control Solutions, and Water Infrastructure.
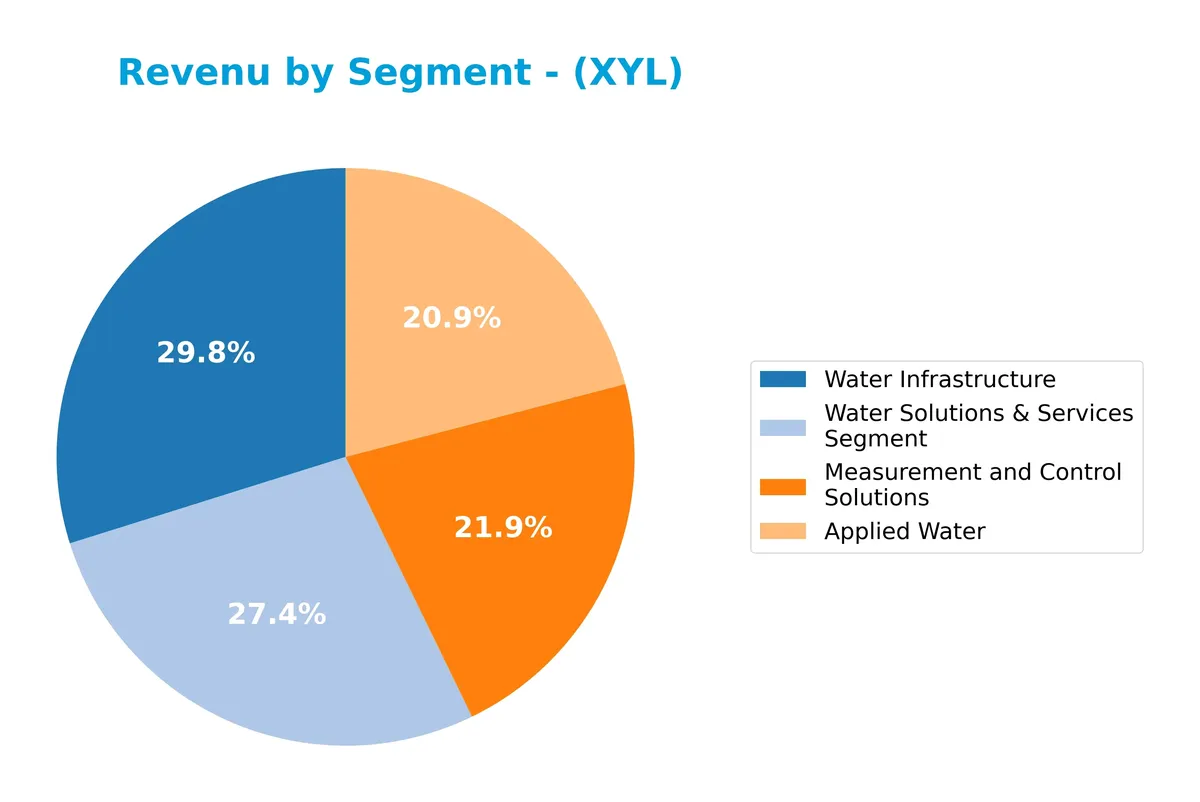
In 2025, Water Infrastructure remains the dominant segment with $2.64B, reflecting steady growth since 2022. Measurement and Control Solutions accelerated to $2.09B, showing strong momentum after steady rises. Applied Water contributes $1.85B, maintaining consistent performance. The 2025 data signals a balanced revenue base, though Water Infrastructure’s scale continues to anchor Xylem’s top line with limited concentration risk.
Key Products & Brands
Xylem Inc. operates through diverse product lines and brands across three main business segments:
| Product | Description |
|---|---|
| Water Infrastructure | Pumps, controls, filtration, disinfection, biological treatment, and mobile dewatering equipment under Flygt, Godwin, Wedeco, Sanitaire, Leopold, and Xylem Vue brands. Used for water transportation and treatment. |
| Applied Water | Pumps, valves, heat exchangers, controls, and dispensing equipment systems under Goulds Water Technology, Bell & Gossett, A-C Fire Pump, Standard Xchange, Lowara, Jabsco, Xylem Vue, and Flojet brands. For residential, commercial building services, and industrial water applications. |
| Measurement & Control Solutions | Smart meters, networked communication devices, measurement and control technologies, software, and services under Pure, Sensus, Smith Blair, WTW, Xylem Vue, and YSI brands. Includes cloud analytics, remote monitoring, leak detection, asset management, and testing equipment. |
Xylem’s portfolio spans engineered water solutions for infrastructure, residential, commercial, and industrial markets. Its brands focus on innovation and integrated services across water management and treatment.
Main Competitors
There are 24 competitors in total, with the table below listing the top 10 leaders by market capitalization:
| Competitor | Market Cap. |
|---|---|
| Eaton Corporation plc | 127B |
| Parker-Hannifin Corporation | 114B |
| Howmet Aerospace Inc. | 85.2B |
| Emerson Electric Co. | 76.3B |
| Illinois Tool Works Inc. | 73B |
| Cummins Inc. | 71.9B |
| AMETEK, Inc. | 48.3B |
| Roper Technologies, Inc. | 46.8B |
| Rockwell Automation, Inc. | 44.8B |
| Symbotic Inc. | 35.9B |
Xylem Inc. ranks 12th among 24 competitors, with a market cap approximately 24.6% that of the leader Eaton Corporation. The company sits below both the average market cap of the top 10 competitors (72.4B) and the sector median (32.4B). It maintains a 11.73% market cap gap to the next competitor above, indicating a moderate distance from its closest rival in scale.
Comparisons with competitors
Check out how we compare the company to its competitors:
Does Xylem Inc. have a competitive advantage?
Xylem Inc. currently does not present a competitive advantage, as its return on invested capital (ROIC) falls below its cost of capital (WACC), indicating value destruction and declining profitability. This negative trend signals the company is not efficiently deploying capital to generate excess returns relative to its industry peers.
Looking ahead, Xylem’s diverse product portfolio spans water infrastructure, applied water, and measurement solutions across key global markets, including the US, Europe, and Asia Pacific. The company’s expansion in smart metering and cloud-based analytics may offer new growth avenues, but sustaining a competitive edge remains uncertain given current capital allocation challenges.
SWOT Analysis
This SWOT analysis highlights key factors shaping Xylem Inc.’s strategic position in the industrial machinery sector.
Strengths
- diverse global footprint
- strong brand portfolio
- favorable gross and net margins
Weaknesses
- declining ROIC below WACC
- moderate revenue growth pace
- high P/E ratio signals valuation risk
Opportunities
- expanding water infrastructure demand
- growth in smart water tech
- rising environmental regulations
Threats
- intense competition
- economic sensitivity in industrial markets
- supply chain disruptions
Xylem’s solid brand and margin profile support resilience, but deteriorating capital efficiency demands strategic focus. The firm must leverage water tech growth while managing valuation and competitive pressures.
Stock Price Action Analysis
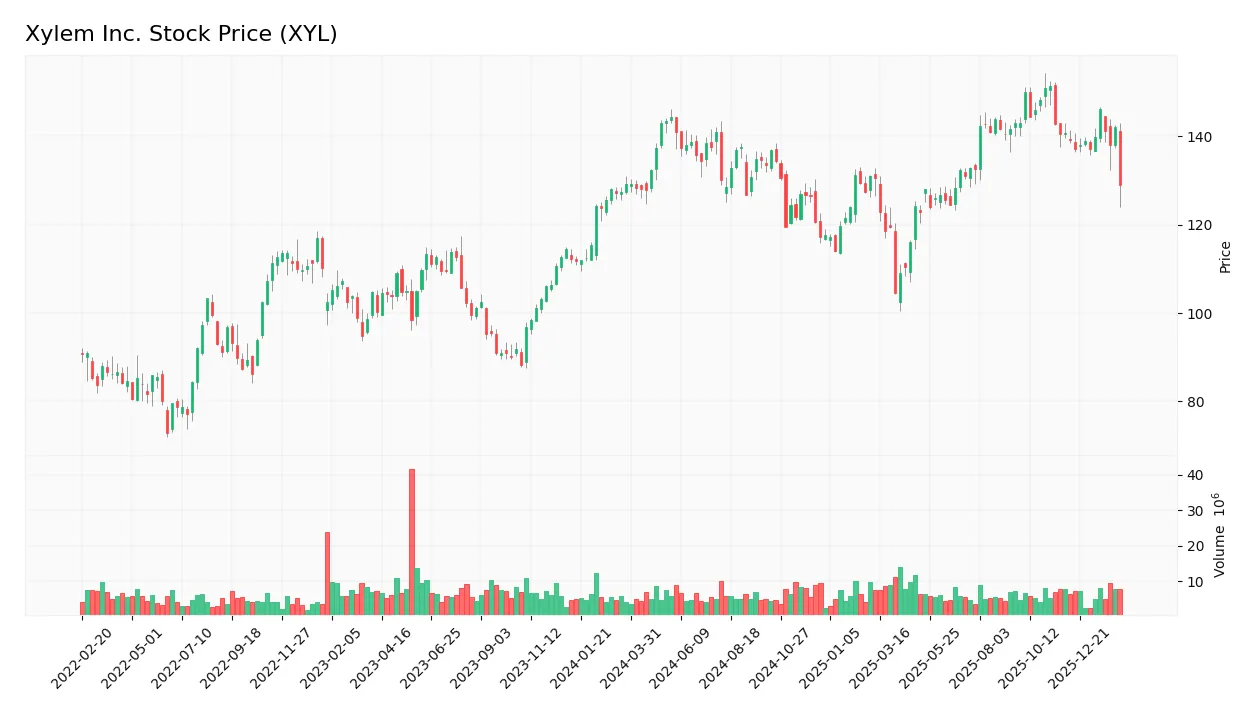
The weekly stock chart of Xylem Inc. (XYL) illustrates price movements and volatility over the past 12 months:
Trend Analysis
Over the past 12 months, XYL’s stock price changed by -0.01%, indicating a neutral trend with deceleration in momentum. The stock fluctuated between a high of 151.31 and a low of 104.6, showing significant volatility with a standard deviation of 9.59.
Volume Analysis
In the last three months, trading volume increased but shifted to slight seller dominance with 45.54% buyer activity. This drop in buyer participation suggests cautious investor sentiment amid declining prices and heightened volatility.
Target Prices
Analysts present a confident target consensus for Xylem Inc., indicating strong upside potential.
| Target Low | Target High | Consensus |
|---|---|---|
| 138 | 176 | 162.67 |
The target range suggests optimism, with a consensus price about 15% above current levels, reflecting robust growth expectations.

Don’t Let Luck Decide Your Entry Point
Optimize your entry points with our advanced ProRealTime indicators. You’ll get efficient buy signals with precise price targets for maximum performance. Start outperforming now!
Analyst & Consumer Opinions
This section reviews analyst ratings and consumer feedback to provide a balanced view of Xylem Inc.’s market perception.
Stock Grades
Here are the latest verified stock grades for Xylem Inc. from recognized financial institutions:
| Grading Company | Action | New Grade | Date |
|---|---|---|---|
| Barclays | Maintain | Overweight | 2026-02-11 |
| Citigroup | Maintain | Buy | 2026-02-11 |
| RBC Capital | Maintain | Outperform | 2026-02-11 |
| Stifel | Maintain | Buy | 2026-02-11 |
| Barclays | Maintain | Overweight | 2026-01-07 |
| Mizuho | Maintain | Neutral | 2026-01-05 |
| TD Cowen | Maintain | Hold | 2025-12-05 |
| UBS | Maintain | Buy | 2025-11-06 |
| RBC Capital | Maintain | Outperform | 2025-10-29 |
| Stifel | Maintain | Buy | 2025-10-29 |
The consensus reveals a stable outlook with most firms maintaining Buy or Outperform ratings. This consistency suggests measured confidence in Xylem’s current market positioning and prospects.
Consumer Opinions
Consumers express a mix of appreciation and critique toward Xylem Inc., reflecting both its innovation and areas for improvement.
| Positive Reviews | Negative Reviews |
|---|---|
| “Xylem’s products are highly reliable and efficient.” | “Customer service response times are slow.” |
| “Innovative water solutions that truly address environmental needs.” | “Pricing feels steep compared to competitors.” |
| “Strong commitment to sustainability resonates well with users.” | “Installation support could be more comprehensive.” |
Overall, consumers praise Xylem’s innovation and sustainability focus. However, concerns about customer service responsiveness and pricing recur frequently, signaling potential areas for management to address.
Risk Analysis
Below is a summary of key risks facing Xylem Inc., with their likelihood and potential impact on the business:
| Category | Description | Probability | Impact |
|---|---|---|---|
| Valuation Risk | Elevated P/E ratio of 34.64 suggests stock may be overvalued | High | Medium |
| Profitability Risk | ROE at 8.34% is below WACC, indicating weak equity returns | Medium | Medium |
| Market Sensitivity | Beta of 1.16 implies above-average volatility versus market | High | Medium |
| Technological Disruption | Rapid innovation in water technology could erode moat | Medium | High |
| Regulatory Risk | Environmental regulations may increase compliance costs | Medium | Medium |
| Liquidity Risk | Current ratio of 1.62 is healthy but should be monitored | Low | Low |
| Debt Service Risk | Very strong interest coverage of 42x reduces default risk | Low | Low |
The most significant risk lies in valuation, with a P/E well above the industrial machinery sector average, raising concerns of a market correction. Also, ROE trailing WACC signals potential capital allocation inefficiencies. However, Xylem’s Altman Z-Score of 4.34 places it comfortably in the safe zone, reducing bankruptcy risk. Investors should watch for technological shifts and regulatory changes as these could materially impact growth prospects.
Should You Buy Xylem Inc.?
Xylem appears to be a moderately profitable company with a very unfavorable moat, suggesting declining operational efficiency and value destruction. Despite manageable leverage and a safe Altman Z-Score, its B rating reflects moderate valuation risks and cautious growth prospects.
Strength & Efficiency Pillars
Xylem Inc. maintains solid operational efficiency with a gross margin of 38.46% and a net margin of 10.59%, both marked favorable. The interest expense is low at 0.32%, supporting stable earnings before interest and taxes (EBIT) margin of 13.54%. However, return on invested capital (ROIC) at 6.42% trails its weighted average cost of capital (WACC) of 8.75%, indicating the company is currently shedding value. Despite this, the Altman Z-Score of 4.34 places Xylem firmly in the safe zone, reflecting strong solvency.
Weaknesses and Drawbacks
Xylem faces valuation headwinds, with a high price-to-earnings ratio of 34.64 signaling a premium market valuation that may limit near-term upside. The price-to-book ratio stands at 2.89, suggesting moderate overvaluation relative to book value. While leverage ratios are favorable—debt-to-equity at 0.17 and a current ratio of 1.62—recent market trends show seller dominance with buyer volume at 45.54%, creating short-term pressure. This seller bias and deceleration in price momentum caution investors on timing.
Our Final Verdict about Xylem Inc.
Xylem presents a fundamentally sound profile with strong solvency and operational margins. Yet, its value destruction signaled by ROIC below WACC and recent seller dominance suggest caution. Despite its long-term strength, recent market pressure might imply a wait-and-see approach to identify a better entry point. The profile may appear suitable for investors willing to navigate valuation risks and short-term volatility.
Disclaimer: This content is for informational purposes only and does not constitute financial, investment, or other professional advice. Investing in financial markets involves a significant risk of loss, and past performance is not indicative of future results.
Additional Resources
- Beyond the Balance Sheet: What SWOT Reveals About Xylem Inc (XYL) – GuruFocus (Feb 26, 2026)
- Water solutions giant Xylem signals confidence with new $1.5B buyback plan – Stock Titan (Feb 25, 2026)
- Citigroup Inc. Purchases 21,354 Shares of Xylem Inc. $XYL – MarketBeat (Feb 25, 2026)
- Xylem Inc. SEC 10-K Report – TradingView (Feb 25, 2026)
- Xylem Inc. (XYL) Announces New $1.5 Billion Share Repurchase Pro – GuruFocus (Feb 25, 2026)
For more information about Xylem Inc., please visit the official website: xylem.com