In the competitive industrial machinery sector, Nordson Corporation (NDSN) and Kadant Inc. (KAI) stand out with distinct yet overlapping market focuses and innovation strategies. Nordson specializes in advanced dispensing and coating technologies, while Kadant excels in fluid-handling and industrial processing systems. This comparison aims to provide investors with a clear view of which company offers the most compelling opportunity based on their current market position and growth potential. Let’s explore which stock deserves a place in your portfolio.
Table of contents
Companies Overview
I will begin the comparison between Nordson Corporation and Kadant Inc. by providing an overview of these two companies and their main differences.
Nordson Corporation Overview
Nordson Corporation engineers, manufactures, and markets systems to dispense, apply, and control adhesives, coatings, and other fluids worldwide. Operating through Industrial Precision Solutions and Advanced Technology Solutions segments, it serves industries such as packaging, semiconductor, and product assembly. Founded in 1935 and headquartered in Westlake, Ohio, Nordson is positioned as a global leader in precision dispensing technologies within the industrial machinery sector.
Kadant Inc. Overview
Kadant Inc. supplies technologies and engineered systems globally, focusing on Flow Control, Industrial Processing, and Material Handling segments. Its products include fluid-handling equipment, industrial automation, and biodegradable absorbents serving packaging, tissue, wood products, and alternative fuel sectors. Incorporated in 1991 and headquartered in Westford, Massachusetts, Kadant holds a specialized niche in engineered systems for industrial applications.
Key similarities and differences
Both Nordson and Kadant operate in the industrial machinery sector, targeting specialized industrial markets with engineered systems and equipment. Nordson emphasizes precision dispensing and fluid control technologies, while Kadant offers a broader range of fluid handling, processing, and material handling solutions. Nordson is larger in market capitalization and workforce, reflecting its wider global presence and diversified product segments compared to Kadant’s more focused industrial processing and material handling approach.
Income Statement Comparison
Below is a comparison of key income statement metrics for Nordson Corporation and Kadant Inc. for their most recent fiscal years.
| Metric | Nordson Corporation (NDSN) | Kadant Inc. (KAI) |
|---|---|---|
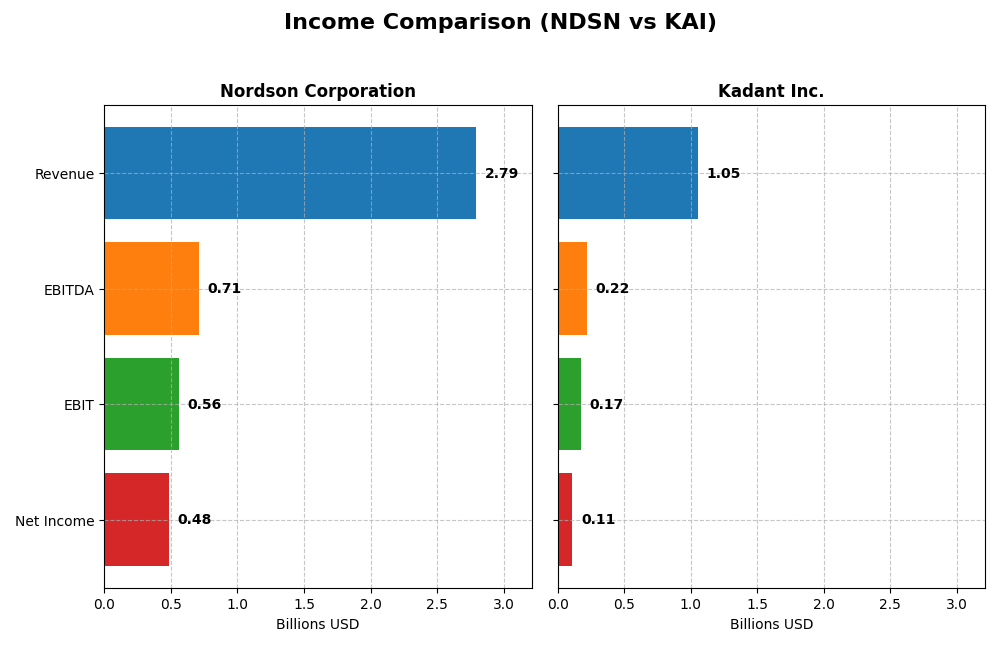
| Market Cap | 14.6B | 3.8B |
| Revenue | 2.79B | 1.05B |
| EBITDA | 712M | 223M |
| EBIT | 561M | 173M |
| Net Income | 484M | 112M |
| EPS | 8.56 | 9.51 |
| Fiscal Year | 2025 | 2024 |
Income Statement Interpretations
Nordson Corporation
Nordson Corporation showed steady revenue growth from 2021 to 2025, increasing from $2.36B to $2.79B, with net income rising moderately from $454M to $484M. Margins remained strong, with a gross margin around 55% and net margin near 17%, despite a slight decline in EBIT margin in the recent year. In 2025, revenue growth slowed to 3.78%, while EBIT and net margin slightly declined, though EPS improved.
Kadant Inc.
Kadant Inc. demonstrated robust revenue growth from $635M in 2020 to $1.05B in 2024, accompanied by a doubling of net income from $55M to $112M. Gross and EBIT margins held steady at 44% and 16%, respectively, with a net margin of 10.6% in 2024. The most recent year showed a favorable 10% revenue increase but net margin and EPS declined, signaling some margin pressure despite overall positive growth.
Which one has the stronger fundamentals?
Both companies exhibit favorable income statement fundamentals, with Kadant excelling in revenue and net income growth rates over the period, while Nordson maintains higher absolute revenue and margin levels. Kadant’s recent margin contraction contrasts with Nordson’s slight EBIT and net margin declines amid steady revenue. Overall, both show strengths, Kadant in growth and Nordson in margin stability.
Financial Ratios Comparison
This table presents the most recent key financial ratios for Nordson Corporation and Kadant Inc. based on their fiscal year 2025 and 2024 data respectively, offering a snapshot of their financial health and performance.
| Ratios | Nordson Corporation (2025) | Kadant Inc. (2024) |
|---|---|---|
| ROE | 15.9% | 13.2% |
| ROIC | 10.5% | 10.1% |
| P/E | 27.1 | 36.9 |
| P/B | 4.31 | 4.86 |
| Current Ratio | 1.64 | 2.31 |
| Quick Ratio | 1.05 | 1.55 |
| D/E (Debt to Equity) | 0.69 | 0.38 |
| Debt-to-Assets | 35.4% | 22.6% |
| Interest Coverage | 7.04 | 8.55 |
| Asset Turnover | 0.47 | 0.74 |
| Fixed Asset Turnover | 4.70 | 6.18 |
| Payout ratio | 37.0% | 13.1% |
| Dividend yield | 1.36% | 0.36% |
Interpretation of the Ratios
Nordson Corporation
Nordson exhibits mostly favorable ratios including strong net margin (17.35%) and return on equity (15.92%), though its price-to-earnings (PE) and price-to-book (PB) ratios appear high, indicating potential overvaluation risks. The current and quick ratios suggest solid liquidity. Nordson pays dividends with a 1.36% yield, maintaining a balanced payout supported by free cash flow, though moderate caution is warranted due to slightly unfavorable valuation metrics.
Kadant Inc.
Kadant shows a favorable overall ratio profile with positive net margin (10.59%) and decent return on invested capital (10.08%). Its liquidity ratios are strong, and leverage is conservatively managed with a debt-to-assets ratio of 22.57%. However, the PE and PB ratios are elevated, and dividend yield is low at 0.36%, which may concern income-focused investors. Kadant’s dividend payout appears modest, reflecting a cautious capital return approach.
Which one has the best ratios?
Kadant presents a more favorable overall ratio evaluation, supported by stronger liquidity and lower leverage, despite a lower dividend yield. Nordson shows robust profitability and return metrics but faces valuation concerns with higher PE and PB ratios. Both companies have their strengths and weaknesses, with Kadant slightly edging out in ratio favorability due to better balance in financial health indicators.
Strategic Positioning
This section compares the strategic positioning of Nordson Corporation and Kadant Inc., including their market position, key segments, and exposure to technological disruption:
Nordson Corporation
- Leading industrial machinery player with NASDAQ listing and larger market cap; faces moderate competitive pressure.
- Diversified segments: Industrial Precision Solutions, Advanced Technology Systems, and Medical And Fluid Solutions driving revenues.
- Exposure to technological innovation in automated dispensing, curing systems, and semiconductor inspection technologies.
Kadant Inc.
- Mid-sized industrial machinery firm listed on NYSE; experiences competitive pressure in niche markets.
- Focused on Flow Control, Industrial Processing, and Material Handling segments with capital and consumables sales.
- Technological exposure mainly through fluid-handling, industrial automation, and engineered steam systems.
Nordson Corporation vs Kadant Inc. Positioning
Nordson adopts a diversified approach across multiple industrial precision and medical segments, offering broad market exposure. Kadant concentrates on specialized fluid handling and material processing, potentially limiting diversification but focusing expertise in select areas.
Which has the best competitive advantage?
Nordson shows a slightly favorable moat with value creation despite declining profitability. Kadant also holds a slightly favorable moat but is shedding value currently, though its profitability trend is improving.
Stock Comparison
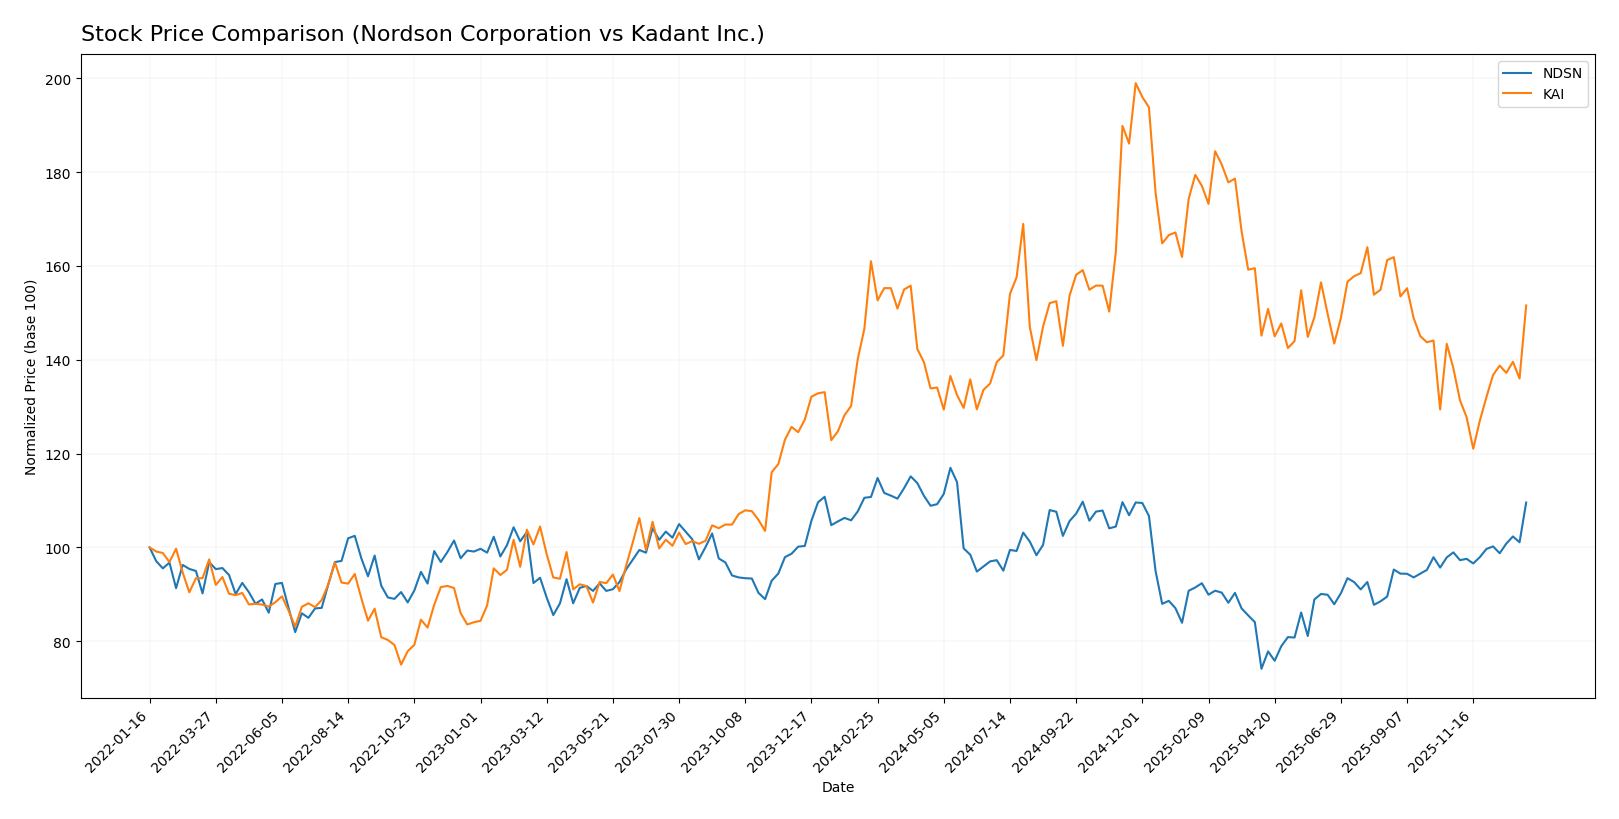
The stock price movements of Nordson Corporation and Kadant Inc. over the past year reveal contrasting bearish trends overall, with both exhibiting recent acceleration in upward momentum from late 2025 into early 2026.
Trend Analysis
Nordson Corporation’s stock experienced a mild bearish trend over the past 12 months with a -1.08% price change, showing acceleration and a high volatility level (std dev 23.45). Recent months indicate a bullish reversal with a 10.73% gain.
Kadant Inc.’s stock showed a stronger bearish trend with a -5.86% decline over the year, also accelerating and exhibiting higher volatility (std dev 34.44). The recent period also reflects bullish momentum, gaining 9.69%.
Comparing both, Nordson Corporation’s stock delivered a smaller overall loss and a slightly stronger recent recovery, outperforming Kadant Inc. in market performance over the analyzed period.
Target Prices
Analysts present a positive target price consensus for both Nordson Corporation and Kadant Inc., indicating expected upside potential.
| Company | Target High | Target Low | Consensus |
|---|---|---|---|
| Nordson Corporation | 295 | 240 | 274.17 |
| Kadant Inc. | 410 | 275 | 342.5 |
The consensus targets for Nordson and Kadant are 5% and 7% above current prices respectively, suggesting moderate upside potential aligned with industrial sector growth.
Analyst Opinions Comparison
This section compares analysts’ ratings and grades for Nordson Corporation and Kadant Inc.:
Rating Comparison
Nordson Corporation Rating
- Rating: Both Nordson and Kadant have a “B” rating, indicating a very favorable investment outlook.
- Discounted Cash Flow Score: Nordson scores 3, reflecting a moderate valuation based on future cash flows.
- ROE Score: Nordson’s 4 score reflects favorable efficiency in generating profit from equity.
- ROA Score: Both companies score 4, showing favorable asset utilization to generate earnings.
- Debt To Equity Score: Nordson scores 2, suggesting moderate financial risk with higher leverage.
- Overall Score: Both firms have an overall score of 3, representing a moderate overall financial standing.
Kadant Inc. Rating
- Rating: Both Nordson and Kadant have a “B” rating, indicating a very favorable investment outlook.
- Discounted Cash Flow Score: Kadant also scores 3, showing a moderate valuation based on future cash flows.
- ROE Score: Kadant scores 3, indicating moderate efficiency in generating profit from equity.
- ROA Score: Both companies score 4, showing favorable asset utilization to generate earnings.
- Debt To Equity Score: Kadant scores 3, indicating moderate but slightly better balance sheet strength.
- Overall Score: Both firms have an overall score of 3, representing a moderate overall financial standing.
Which one is the best rated?
Both Nordson and Kadant share a “B” rating and overall score of 3, indicating moderate financial standing. Nordson has a higher ROE score, while Kadant scores better on debt-to-equity, reflecting different strengths in their financial profiles.
Scores Comparison
Here is a comparison of the Altman Z-Score and Piotroski Score for Nordson Corporation and Kadant Inc.:
NDSN Scores
- Altman Z-Score: 4.9, indicating a safe zone with low bankruptcy risk.
- Piotroski Score: 7, reflecting strong financial health.
KAI Scores
- Altman Z-Score: 5.6, indicating a safe zone with low bankruptcy risk.
- Piotroski Score: 7, reflecting strong financial health.
Which company has the best scores?
Both Nordson and Kadant demonstrate strong financial health with identical Piotroski Scores of 7 and Altman Z-Scores placing them safely above bankruptcy risk. Kadant’s slightly higher Altman Z-Score suggests marginally better financial stability.
Grades Comparison
Here is a summary of the latest grades assigned to Nordson Corporation and Kadant Inc.:
Nordson Corporation Grades
This table shows recent grades assigned to Nordson Corporation by reputable grading companies.
| Grading Company | Action | New Grade | Date |
|---|---|---|---|
| DA Davidson | Maintain | Buy | 2025-12-12 |
| Baird | Maintain | Neutral | 2025-12-12 |
| DA Davidson | Maintain | Buy | 2025-12-11 |
| Keybanc | Maintain | Overweight | 2025-12-11 |
| Oppenheimer | Maintain | Outperform | 2025-08-25 |
| Baird | Maintain | Neutral | 2025-08-22 |
| Keybanc | Maintain | Overweight | 2025-07-15 |
| Baird | Maintain | Neutral | 2025-05-30 |
| Oppenheimer | Upgrade | Outperform | 2025-05-30 |
| Keybanc | Maintain | Overweight | 2025-04-08 |
Nordson’s grades predominantly range from Neutral to Buy/Outperform, reflecting a generally positive and stable outlook.
Kadant Inc. Grades
Below is the recent grading data for Kadant Inc. from established grading firms.
| Grading Company | Action | New Grade | Date |
|---|---|---|---|
| Barrington Research | Maintain | Outperform | 2025-10-30 |
| Barrington Research | Maintain | Outperform | 2025-10-29 |
| Barrington Research | Maintain | Outperform | 2025-10-27 |
| Barrington Research | Maintain | Outperform | 2025-10-10 |
| Barrington Research | Maintain | Outperform | 2025-09-23 |
| DA Davidson | Maintain | Neutral | 2025-08-04 |
| Barrington Research | Maintain | Outperform | 2025-07-30 |
| Barrington Research | Maintain | Outperform | 2025-07-29 |
| Barrington Research | Maintain | Outperform | 2025-05-01 |
| DA Davidson | Maintain | Neutral | 2025-05-01 |
Kadant’s grades consistently indicate an Outperform rating from Barrington Research and Neutral from DA Davidson, showing a generally favorable view.
Which company has the best grades?
Nordson Corporation shows a mix of Buy, Outperform, and Neutral ratings with multiple grading firms, while Kadant Inc. mainly receives Outperform from Barrington Research but Neutral from DA Davidson. Nordson’s broader rating diversity may indicate a more nuanced market view, potentially influencing investor confidence differently than Kadant’s more uniform but slightly less optimistic consensus.
Strengths and Weaknesses
Below is a comparison table highlighting the key strengths and weaknesses of Nordson Corporation (NDSN) and Kadant Inc. (KAI) based on their diversification, profitability, innovation, global presence, and market share.
| Criterion | Nordson Corporation (NDSN) | Kadant Inc. (KAI) |
|---|---|---|
| Diversification | Broad product segments: Advanced Technology, Industrial Precision, Medical & Fluid Solutions; strong industrial focus | Concentrated in Capital and Parts & Consumables, mainly papermaking and processing systems |
| Profitability | Higher net margin (17.35%) and ROIC (10.49%), but declining ROIC trend | Moderate net margin (10.59%) and ROIC (10.08%), with improving ROIC trend |
| Innovation | Consistent investment in advanced technology systems; good fixed asset turnover (4.7) | Steady innovation in papermaking and fiber-based products; higher fixed asset turnover (6.18) |
| Global presence | Established global industrial footprint with diverse end markets | Focused presence in papermaking and processing sectors, less diversified globally |
| Market Share | Strong industrial precision solutions segment with significant revenues (~$1.48B in 2024) | Smaller scale with capital and parts revenues totaling about $1.05B in 2024 |
Key takeaways: Nordson offers more diversified revenue streams and stronger current profitability but faces a declining return on invested capital. Kadant, while less diversified, shows improving profitability and operational efficiency, making it a promising growth candidate. Investors should weigh stability versus growth potential carefully.
Risk Analysis
Below is a comparative table presenting key risk metrics for Nordson Corporation (NDSN) and Kadant Inc. (KAI) based on the most recent data available.
| Metric | Nordson Corporation (NDSN) | Kadant Inc. (KAI) |
|---|---|---|
| Market Risk | Beta 1.03 (moderate) | Beta 1.25 (higher volatility) |
| Debt level | Debt/Equity 0.69 (neutral) | Debt/Equity 0.38 (favorable) |
| Regulatory Risk | Moderate, industrial sector | Moderate, industrial sector |
| Operational Risk | Moderate, complex systems | Moderate, diversified segments |
| Environmental Risk | Moderate, manufacturing impact | Moderate, industrial processing |
| Geopolitical Risk | Low to moderate, US-based | Low to moderate, US-based |
Nordson faces moderate market risk with a beta near 1 and a manageable debt level, but its valuation metrics are less favorable. Kadant shows higher market volatility but maintains a stronger balance sheet with lower leverage. Both companies operate in industrial sectors exposed to regulatory and environmental challenges, but geopolitical risks remain contained due to their US base. Investors should watch Kadant’s higher beta and Nordson’s valuation pressures as the most impactful risks.
Which Stock to Choose?
Nordson Corporation (NDSN) shows a generally favorable income evolution with solid profitability metrics, including a 17.35% net margin and 15.92% ROE. Its debt level is moderate, and its financial ratios are slightly favorable overall, supported by a very favorable rating and strong scores in financial health.
Kadant Inc. (KAI) demonstrates favorable income growth, marked by a 10.59% net margin and a slightly lower ROE of 13.17%. Its debt is comparatively lower, and the financial ratios are more favorable overall, accompanied by a very favorable rating and strong financial stability indicators.
From a rating and financial ratio perspective, NDSN could be seen as slightly more established in profitability, while KAI exhibits improving profitability and lower leverage. Investors prioritizing stable profitability and established returns might find NDSN appealing, whereas those valuing growth potential and improving efficiency could view KAI as favorable.
Disclaimer: Investment carries a risk of loss of initial capital. The past performance is not a reliable indicator of future results. Be sure to understand risks before making an investment decision.
Go Further
I encourage you to read the complete analyses of Nordson Corporation and Kadant Inc. to enhance your investment decisions: