Home > Analyses > Healthcare > Vertex Pharmaceuticals Incorporated
Vertex Pharmaceuticals transforms the lives of cystic fibrosis patients through groundbreaking therapies that target genetic root causes. As a biotechnology pioneer, Vertex commands the market with flagship drugs like TRIKAFTA, renowned for exceptional efficacy and innovation. The company’s robust pipeline extends its influence into rare diseases and gene editing, signaling potential beyond its current stronghold. Yet, in 2026, I ask: does Vertex’s valuation fully reflect its growth runway and emerging risks?

Table of contents
Business Model & Company Overview
Vertex Pharmaceuticals Incorporated, founded in 1989 and based in Boston, MA, leads the biotechnology sector with a sharp focus on cystic fibrosis therapies. Its portfolio, including SYMDEKO, ORKAMBI, KALYDECO, and TRIKAFTA, forms a cohesive treatment ecosystem targeting specific genetic mutations. This precision approach underpins Vertex’s dominant market position in rare disease treatment.
The company’s revenue engine balances innovative drug development with strategic global distribution across the Americas, Europe, and Asia. Sales primarily flow through specialty pharmacies, distributors, and hospitals, emphasizing recurring demand for its therapies. Vertex’s robust pipeline and partnerships fuel sustained growth, reinforcing its powerful economic moat in the biopharma landscape.
Financial Performance & Fundamental Metrics
I will analyze Vertex Pharmaceuticals Incorporated’s income statement, key financial ratios, and dividend payout policy to assess its fundamental strength and shareholder value.
Income Statement
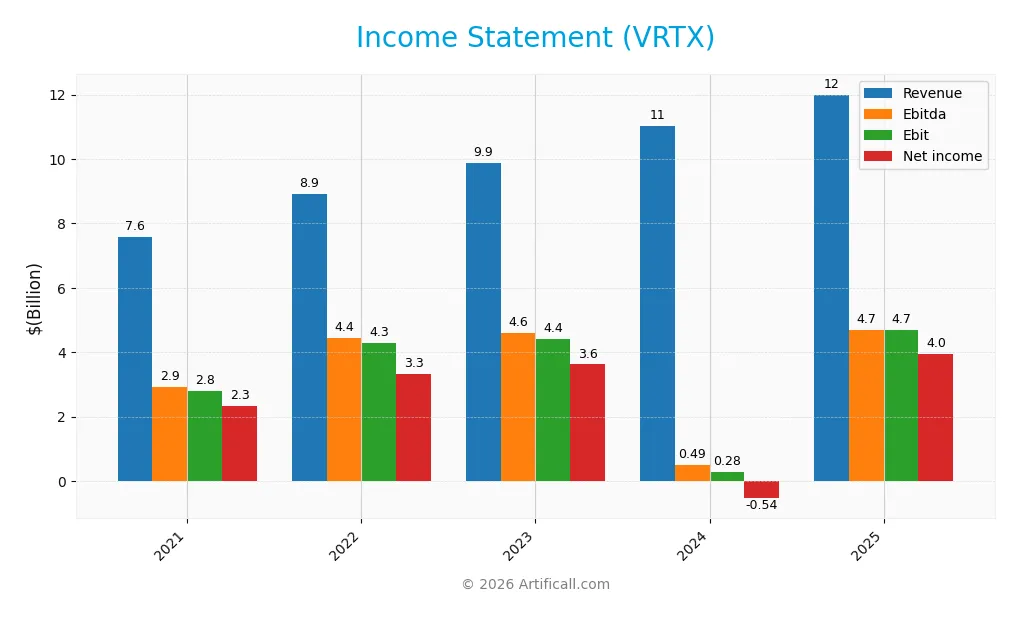
The table below summarizes Vertex Pharmaceuticals Incorporated’s key income statement figures for the fiscal years 2021 through 2025, providing a clear view of revenue, profitability, and earnings per share trends.
| 2021 | 2022 | 2023 | 2024 | 2025 | |
|---|---|---|---|---|---|
| Revenue | 7.57B | 8.93B | 9.87B | 11.02B | 12.00B |
| Cost of Revenue | 904M | 1.08B | 1.26B | 1.53B | 1.63B |
| Operating Expenses | 3.89B | 3.54B | 4.78B | 9.72B | 5.68B |
| Gross Profit | 6.67B | 7.85B | 8.61B | 9.49B | 10.35B |
| EBITDA | 2.92B | 4.44B | 4.61B | 486M | 4.69B |
| EBIT | 2.79B | 4.29B | 4.42B | 279M | 4.69B |
| Interest Expense | 61.5M | 54.8M | 44.1M | 30.6M | 13.3M |
| Net Income | 2.34B | 3.32B | 3.62B | -536M | 3.95B |
| EPS | 9.09 | 12.97 | 14.05 | -2.08 | 15.46 |
| Filing Date | 2022-02-09 | 2023-02-10 | 2024-02-15 | 2025-02-13 | 2026-02-13 |
Income Statement Evolution
Vertex Pharmaceuticals shows robust revenue growth from 7.6B in 2021 to 12B in 2025, a 58% increase. Net income expanded 69% over the same period, recovering sharply after a loss in 2024. Margins improved consistently, with gross margin exceeding 86% and net margin reaching nearly 33% in 2025, reflecting enhanced operational efficiency.
Is the Income Statement Favorable?
The 2025 income statement displays strong fundamentals. Revenue rose 8.9% year-over-year, with gross profit growing 9.1%. Operating expenses scaled proportionally, preserving margin strength. EBIT surged 15-fold, and net margin expanded nearly eightfold versus 2024. Interest expense remains minimal at 0.11% of revenue. Overall, the income metrics and profitability trends align with a favorable financial profile.
Financial Ratios
The following table presents key financial ratios for Vertex Pharmaceuticals Incorporated (VRTX) over five fiscal years, illustrating profitability, efficiency, liquidity, leverage, and market valuation metrics:
| Ratios | 2021 | 2022 | 2023 | 2024 | 2025 |
|---|---|---|---|---|---|
| Net Margin | 31% | 37% | 37% | -5% | 33% |
| ROE | 23% | 24% | 21% | -3% | 21% |
| ROIC | 21% | 22% | 16% | 3% | 18% |
| P/E | 24.2 | 22.3 | 29.0 | -193.6 | 29.3 |
| P/B | 5.60 | 5.32 | 5.96 | 6.32 | 6.21 |
| Current Ratio | 4.46 | 4.83 | 3.99 | 2.69 | 2.90 |
| Quick Ratio | 4.30 | 4.66 | 3.78 | 2.35 | 2.46 |
| D/E | 0.096 | 0.064 | 0.046 | 0.107 | 0.198 |
| Debt-to-Assets | 7.2% | 5.0% | 3.6% | 7.8% | 14.4% |
| Interest Coverage | 45.2 | 78.6 | 86.9 | -7.6 | 352.4 |
| Asset Turnover | 0.56 | 0.49 | 0.43 | 0.49 | 0.47 |
| Fixed Asset Turnover | 5.32 | 6.13 | 6.79 | 4.26 | 3.89 |
| Dividend Yield | 0% | 0% | 0% | 0% | 0% |
Evolution of Financial Ratios
From 2021 to 2025, Vertex Pharmaceuticals’ Return on Equity (ROE) showed volatility, dipping into negative in 2024 before recovering to 21.18% in 2025. The Current Ratio declined from 4.46 in 2021 to 2.90 in 2025, indicating reduced but still strong liquidity. Debt-to-Equity Ratio rose gradually but remains low at 0.20 in 2025, reflecting conservative leverage and stable profitability rebound.
Are the Financial Ratios Fovorable?
In 2025, Vertex displays strong profitability with a 32.94% net margin and favorable ROE at 21.18%. Liquidity ratios, including a 2.90 current ratio and 2.46 quick ratio, are robust. Leverage remains conservative with a 0.20 debt-to-equity ratio and high interest coverage of 352.44. However, valuation metrics like price-to-earnings at 29.32 and price-to-book at 6.21 are unfavorable, as is asset turnover at 0.47. Overall, 71% of ratios are favorable, supporting a generally positive financial profile.
Shareholder Return Policy
Vertex Pharmaceuticals Incorporated does not pay dividends, reflecting a strategic focus on reinvestment and growth. The company maintains a zero dividend payout ratio and zero dividend yield, while retaining strong free cash flow coverage and significant cash reserves per share.
Vertex also does not engage in share buybacks, emphasizing capital allocation towards long-term R&D and innovation. This policy supports sustainable shareholder value creation by prioritizing growth investment over immediate cash distributions.
Score analysis
The following radar chart displays Vertex Pharmaceuticals’ key financial scores to illustrate its investment profile:
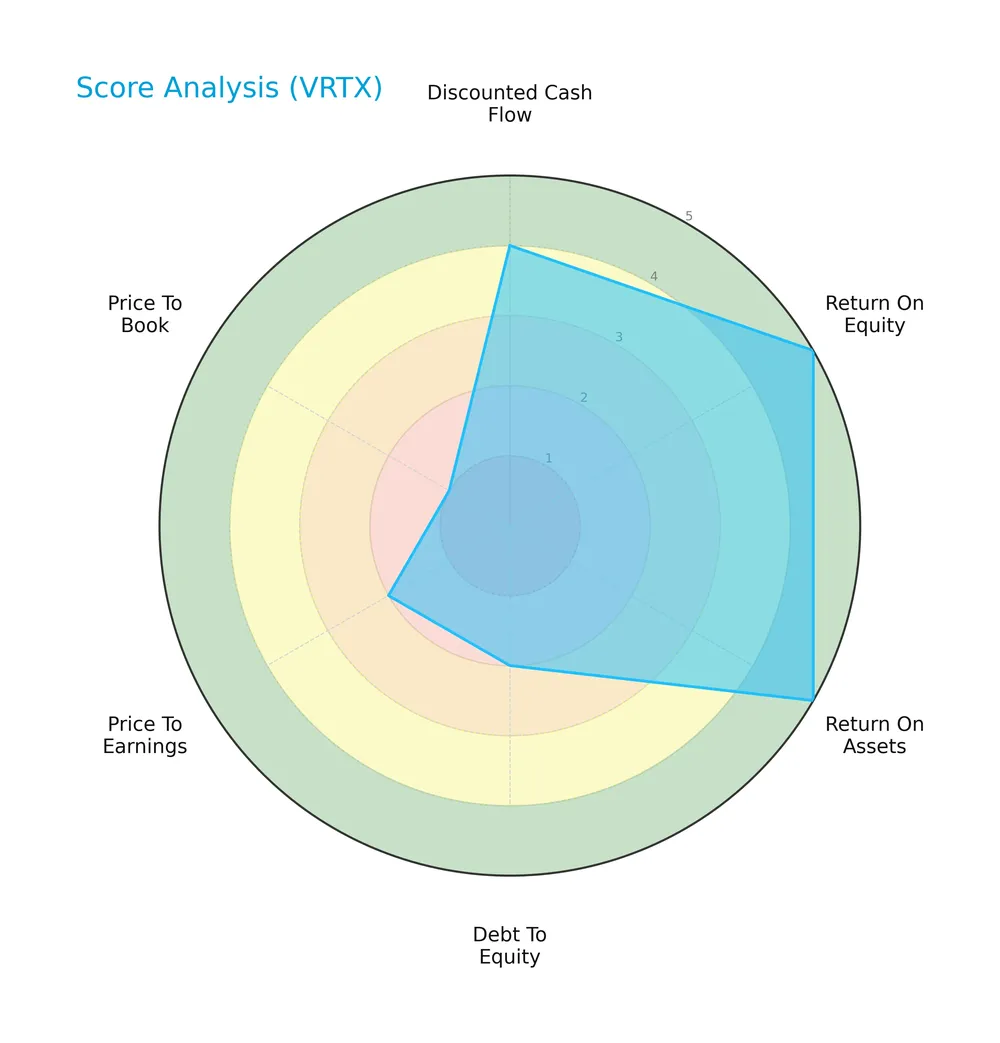
Vertex shows strong profitability with very favorable ROE and ROA scores of 5 each. The discounted cash flow score is favorable at 4. However, valuation metrics underperform, with low scores in debt to equity (2), price to earnings (2), and price to book (1), indicating caution on leverage and market pricing.
Analysis of the company’s bankruptcy risk
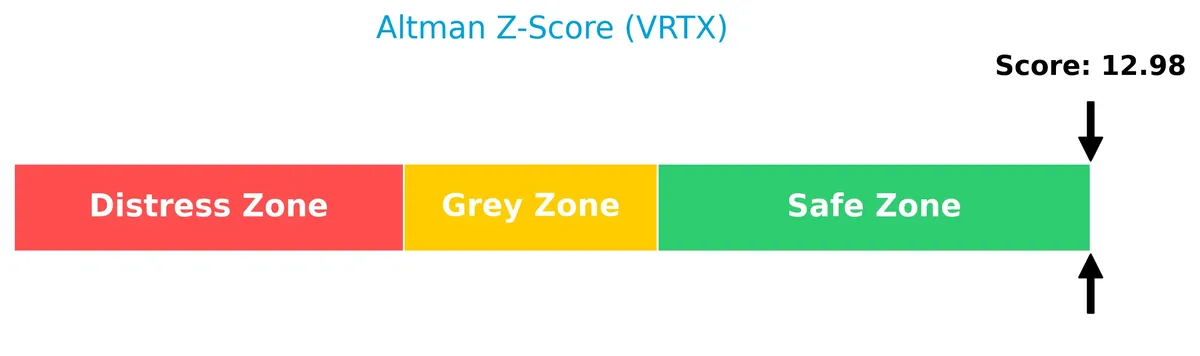
Vertex Pharmaceuticals’ Altman Z-Score places it well within the safe zone, signaling very low bankruptcy risk:
Is the company in good financial health?
The Piotroski Score diagram below evaluates Vertex’s financial strength based on nine criteria:
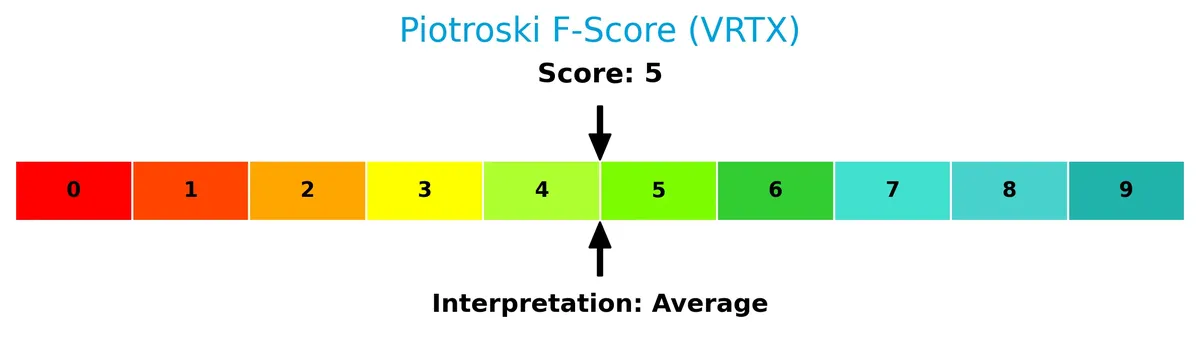
With a Piotroski Score of 5, Vertex falls in the average range. This indicates moderate financial health, suggesting balanced profitability and operational efficiency but room for improvement in financial robustness.
Competitive Landscape & Sector Positioning
This section examines Vertex Pharmaceuticals’ strategic positioning within the biotechnology sector, focusing on its revenue streams and product portfolio. We will analyze key competitors and the company’s competitive advantages in detail. I will assess whether Vertex holds a sustainable edge over its industry peers.
Strategic Positioning
Vertex Pharmaceuticals concentrates on cystic fibrosis treatments, with TRIKAFTA/KAFTRIO generating over $10B in 2025. Its product portfolio shows limited diversification but includes several pipeline drugs in early trials. Geographically, it remains heavily reliant on the U.S. market, which accounts for roughly 55% of 2025 revenue, with Europe and other regions growing steadily.
Revenue by Segment
This pie chart illustrates Vertex Pharmaceuticals’ revenue distribution by product segment for the fiscal year 2025, highlighting key drivers of its business performance.
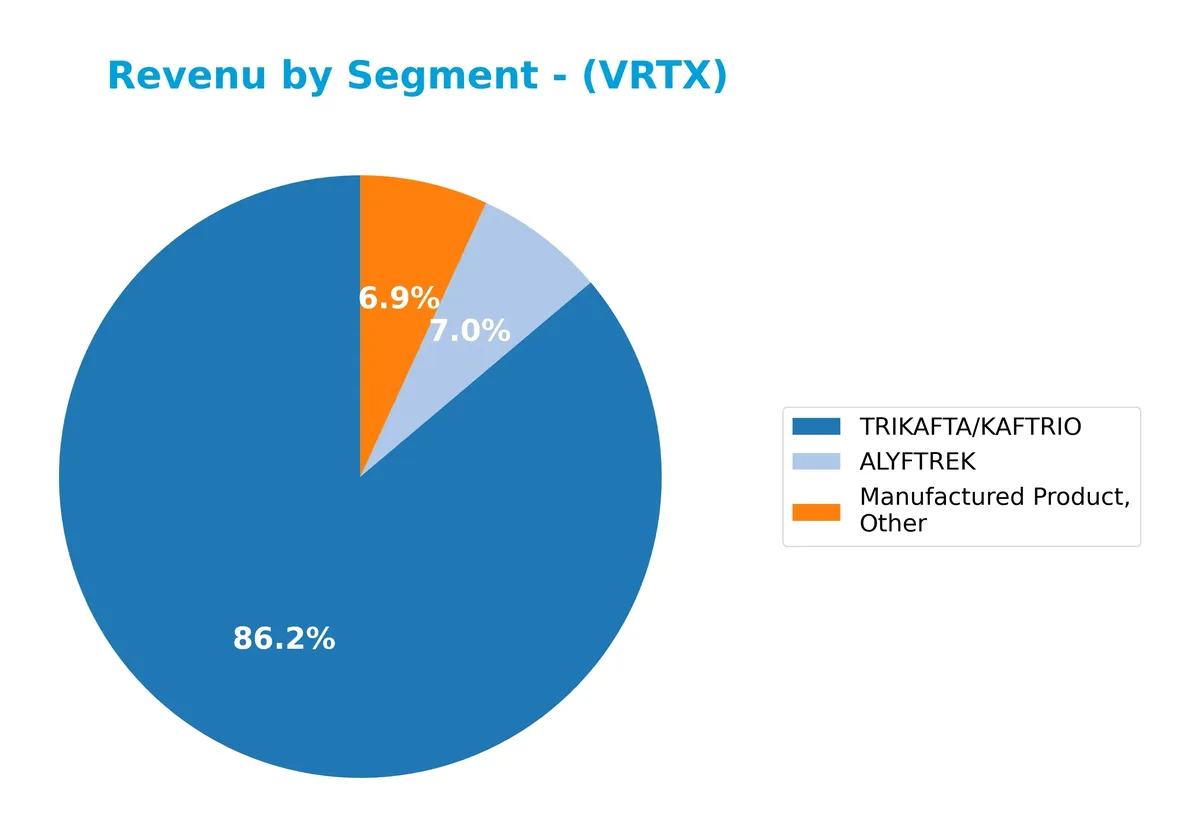
In 2025, TRIKAFTA/KAFTRIO dominates with $10.3B, confirming its status as the core revenue engine. ALYFTREK and Manufactured Product, Other contribute $838M and $820M, respectively, showing modest but meaningful diversification. The concentration risk remains high, with over 80% of revenue from TRIKAFTA/KAFTRIO, reflecting both strong market leadership and dependency on one flagship product.
Key Products & Brands
The table below details Vertex Pharmaceuticals’ principal products and brands with brief descriptions:
| Product | Description |
|---|---|
| TRIKAFTA/KAFTRIO | A leading therapy for cystic fibrosis patients with at least one F508del mutation. |
| KALYDECO | Treats cystic fibrosis patients with specific CFTR gene mutations. |
| ORKAMBI | Targets cystic fibrosis patients carrying certain CFTR gene mutations. |
| SYMDEKO/SYMKEVI | Therapy for cystic fibrosis patients with defined CFTR gene mutations. |
| ALYFTREK | A product segment contributing to revenue, details unspecified in data. |
| Manufactured Product, Other | Miscellaneous products outside main cystic fibrosis brands, contributing to revenue. |
Vertex Pharmaceuticals focuses mainly on cystic fibrosis therapies, with TRIKAFTA/KAFTRIO as its dominant revenue driver. Other products support treatment for specific genetic mutations in cystic fibrosis patients.
Main Competitors
There are 5 competitors in this sector, with the table below listing the top 10 leaders by market capitalization:
| Competitor | Market Cap. |
|---|---|
| Vertex Pharmaceuticals Incorporated | 116B |
| Regeneron Pharmaceuticals, Inc. | 80B |
| Incyte Corporation | 20B |
| Moderna, Inc. | 12B |
| Bio-Techne Corporation | 9B |
Vertex Pharmaceuticals Incorporated ranks first among its competitors. Its market cap is 8.6% above the next largest player, Regeneron. Vertex’s capitalization sits well above both the average market cap of the top 10 competitors (47.5B) and the median market cap in the sector (19.9B). The gap to the closest rival below is significant, with a 57% drop in market cap.
Comparisons with competitors
Check out how we compare the company to its competitors:
Does VRTX have a competitive advantage?
Vertex Pharmaceuticals presents a competitive advantage, creating value with an ROIC 13.3% above its WACC, supported by a robust 86% gross margin and strong profitability metrics. Its consistent revenue growth of 58% over five years signals effective capital allocation and operational efficiency in the biotechnology sector.
Looking ahead, Vertex expands its pipeline with innovative therapies targeting rare diseases, including Phase 3 trials for CTX001 and early-stage programs for kidney and diabetes treatments. Partnerships with leading biotech firms further enhance its opportunity to penetrate new markets and sustain long-term growth.
SWOT Analysis
This analysis highlights Vertex Pharmaceuticals’ core internal strengths and weaknesses, alongside external opportunities and threats shaping its strategic outlook.
Strengths
- Strong market position in cystic fibrosis therapy
- High gross margin at 86%
- Robust ROIC well above WACC at 18.3%
Weaknesses
- High P/E at 29.3 signals premium valuation
- Price-to-book ratio of 6.2 indicates expensive stock
- Declining ROIC trend warns of margin pressure
Opportunities
- Expanding pipeline targeting serious diseases
- Growing international revenue, especially Europe
- Collaborations with cutting-edge biotech firms
Threats
- Intense biotech competition and innovation risk
- Regulatory hurdles in new drug approvals
- Pricing pressures and reimbursement risks
Vertex’s strengths in innovation and financial health support growth, but valuation and profitability trends require caution. Capitalizing on pipeline and global expansion is critical, while managing competitive and regulatory risks is essential for sustainable value creation.
Stock Price Action Analysis
The weekly stock chart of Vertex Pharmaceuticals Incorporated (VRTX) highlights price movements and key levels over the past 12 months:
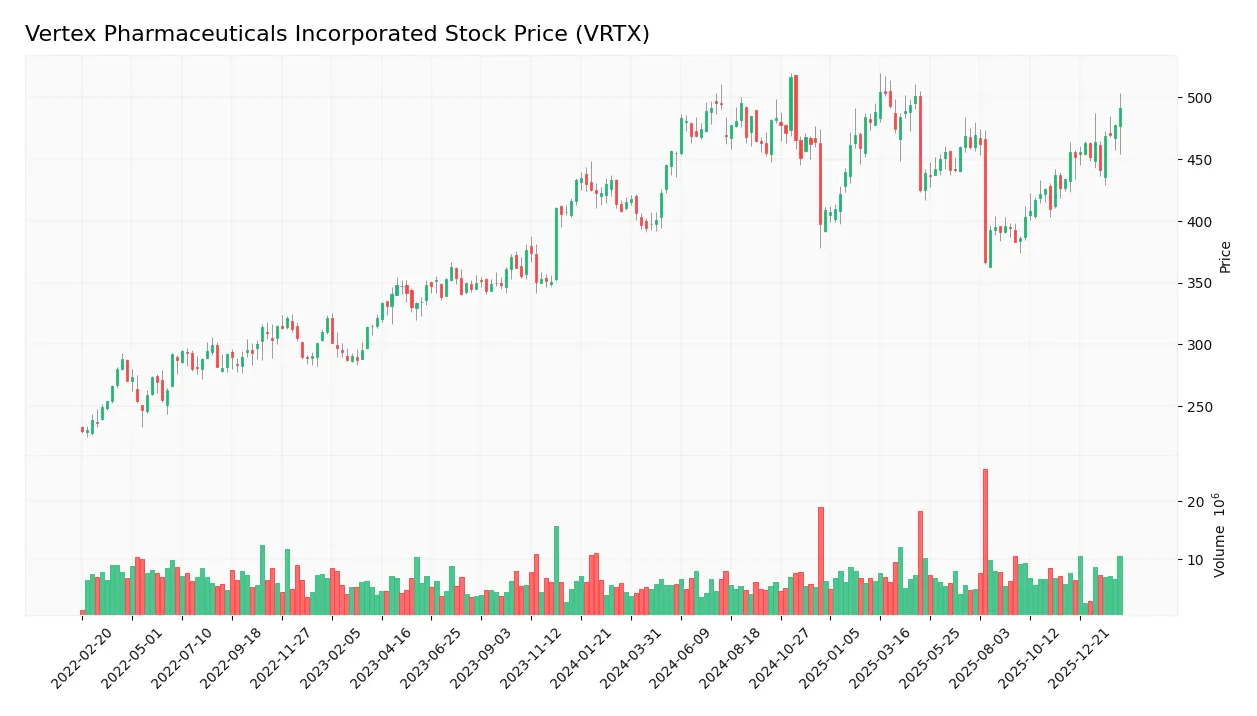
Trend Analysis
Over the past 12 months, VRTX’s stock price increased by 18.24%, indicating a bullish trend with acceleration. The price ranged from a low of 366.54 to a high of 516.74. Volatility remains significant, with a standard deviation of 34.11. Recent three-month data confirms continued upward momentum.
Volume Analysis
Volume shows an increasing trend with total traded shares at 820M. Buyers dominate with 55% overall and 80% in the recent three months, indicating strong buyer-driven activity. This suggests robust investor interest and growing market participation in VRTX stock.
Target Prices
Analysts set a strong target consensus for Vertex Pharmaceuticals, reflecting confidence in its growth prospects.
| Target Low | Target High | Consensus |
|---|---|---|
| 466 | 606 | 548 |
The target range suggests a 15-20% upside from current levels, indicating broad analyst optimism about Vertex’s pipeline and market position.

Don’t Let Luck Decide Your Entry Point
Optimize your entry points with our advanced ProRealTime indicators. You’ll get efficient buy signals with precise price targets for maximum performance. Start outperforming now!
Analyst & Consumer Opinions
This section reviews recent analyst grades and consumer feedback regarding Vertex Pharmaceuticals Incorporated (VRTX) to gauge market sentiment.
Stock Grades
Here is the latest overview of Vertex Pharmaceuticals’ stock grades from prominent financial institutions:
| Grading Company | Action | New Grade | Date |
|---|---|---|---|
| Scotiabank | Maintain | Sector Perform | 2026-02-13 |
| Stifel | Maintain | Hold | 2026-02-13 |
| HC Wainwright & Co. | Maintain | Buy | 2026-02-13 |
| Oppenheimer | Upgrade | Outperform | 2026-02-13 |
| RBC Capital | Maintain | Outperform | 2026-02-13 |
| Barclays | Upgrade | Overweight | 2026-01-28 |
| UBS | Maintain | Buy | 2026-01-26 |
| Evercore ISI Group | Maintain | Outperform | 2026-01-23 |
| RBC Capital | Upgrade | Outperform | 2026-01-22 |
| Bernstein | Upgrade | Outperform | 2026-01-12 |
Most analysts maintain positive views, with several upgrades pushing the stock toward outperform and overweight ratings. The consensus remains a Buy, reflecting steady confidence among leading firms.
Consumer Opinions
Vertex Pharmaceuticals elicits a mix of strong praise and constructive criticism from its user base.
| Positive Reviews | Negative Reviews |
|---|---|
| Innovative treatments with noticeable patient benefits. | High medication costs limit accessibility. |
| Responsive customer support and clear communication. | Side effects reported by some patients. |
| Reliable delivery and prescription management. | Complex insurance processes frustrate users. |
Overall, consumers admire Vertex’s cutting-edge therapies and service reliability. However, affordability and insurance hurdles remain consistent pain points.
Risk Analysis
Below is a summary of key risks facing Vertex Pharmaceuticals Incorporated, categorized by likelihood and impact:
| Category | Description | Probability | Impact |
|---|---|---|---|
| Regulatory Risk | Delays or failures in clinical trial approvals could stall pipeline progress and sales growth | Medium | High |
| Competitive Risk | Emerging biotech firms and novel therapies threaten Vertex’s cystic fibrosis market share | Medium | Medium |
| Valuation Risk | Elevated P/E (29.3) and P/B (6.2) ratios suggest potential overvaluation relative to peers | High | Medium |
| Pipeline Risk | Clinical trial failures for VX-864, VX-147, and CTX001 could impair future revenue streams | Medium | High |
| Concentration Risk | Heavy reliance on cystic fibrosis treatments limits diversification and exposes to market shifts | High | High |
| Financial Risk | Low debt-to-equity ratio (0.2) limits financial leverage, but interest coverage is strong | Low | Low |
The most pressing risks stem from Vertex’s reliance on cystic fibrosis therapies and high valuation multiples. Despite a safe Altman Z-score (13.0) signaling financial stability, pipeline setbacks or regulatory delays could sharply impact growth. Investors should weigh these risks against Vertex’s strong ROIC (18.3%) and favorable liquidity.
Should You Buy Vertex Pharmaceuticals Incorporated?
Vertex Pharmaceuticals appears to be a robust value creator with a slightly favorable moat, evidenced by solid ROIC exceeding WACC despite declining trends. While its leverage profile is manageable, valuation metrics suggest caution. The overall rating of B+ indicates a very favorable but nuanced investment profile.
Strength & Efficiency Pillars
Vertex Pharmaceuticals Incorporated demonstrates solid operational excellence, highlighted by a robust net margin of 32.94% and a return on equity (ROE) of 21.18%. Its return on invested capital (ROIC) stands at 18.32%, significantly exceeding its weighted average cost of capital (WACC) of 5.04%. This gap confirms Vertex as a clear value creator. The company’s strong gross margin of 86.24% and favorable operating margins underpin its ability to generate sustainable profits. Historically in biotech, such margins indicate competitive moats and effective capital allocation.
Weaknesses and Drawbacks
Vertex trades at a premium valuation, with a price-to-earnings (P/E) ratio of 29.32 and a price-to-book (P/B) ratio of 6.21, both flagged as unfavorable. These elevated multiples suggest high market expectations, increasing downside risk if growth falters. While leverage metrics remain favorable—debt-to-equity is a low 0.2 and current ratio is a healthy 2.9—the premium valuation demands consistent execution. Investor caution is warranted as such lofty multiples can compress under broader market corrections or sector rotation.
Our Final Verdict about Vertex Pharmaceuticals Incorporated
Vertex exhibits a fundamentally strong profile with robust profitability and value creation, supported by a safe-zone Altman Z-Score of 12.98. The overall bullish stock trend and strong buyer dominance (80.05%) in recent periods reinforce positive momentum. Despite premium valuation multiples, the company’s operational strength and capital efficiency suggest it may appear attractive for long-term exposure. However, investors should remain cautious about entry timing given elevated market expectations.
Disclaimer: This content is for informational purposes only and does not constitute financial, investment, or other professional advice. Investing in financial markets involves a significant risk of loss, and past performance is not indicative of future results.
Additional Resources
- Vertex Pharma (VRTX) Renal Pipeline Seen as Major Growth Driver by Barclays – Yahoo Finance (Feb 13, 2026)
- 11,989 Shares in Vertex Pharmaceuticals Incorporated $VRTX Purchased by ING Groep NV – MarketBeat (Feb 13, 2026)
- VRTX’s Q4 Earnings Miss Mark, Revenues Beat on Higher Product Sales – Finviz (Feb 13, 2026)
- Vertex Pharmaceuticals (VRTX): Scotiabank Raises Price Target to $558 | VRTX Stock News – GuruFocus (Feb 13, 2026)
- Vertex Pharma Q4 2025 Earnings Results – AlphaStreet News (Feb 13, 2026)
For more information about Vertex Pharmaceuticals Incorporated, please visit the official website: vrtx.com