In a world where customer engagement is paramount, Verint Systems Inc. revolutionizes how businesses connect with their clients. With its cutting-edge solutions in customer engagement, Verint leads the Software – Infrastructure industry by offering innovative applications that enhance service quality and operational efficiency. Renowned for its commitment to excellence and technological prowess, the company continually shapes the landscape of customer interactions. As we delve into the investment analysis, the key question remains: do Verint’s fundamentals uphold its current market valuation and growth trajectory?

Table of contents
Company Description
Verint Systems Inc. (NASDAQ: VRNT), founded in 1994 and headquartered in Melville, NY, is a prominent player in the software infrastructure industry, specializing in customer engagement solutions. The company offers a diverse range of applications, including forecasting, quality compliance, interaction insights, and conversational AI, aimed at enhancing customer interactions across various channels. With a market capitalization of approximately $1.24B, Verint operates primarily in the U.S. and serves global markets. As a leader in its field, Verint is committed to innovation and operational excellence, continuously shaping the customer engagement landscape through advanced analytics and automation solutions.
Fundamental Analysis
In this section, I will analyze Verint Systems Inc.’s income statement, financial ratios, and dividend payout policy to assess its investment potential.
Income Statement
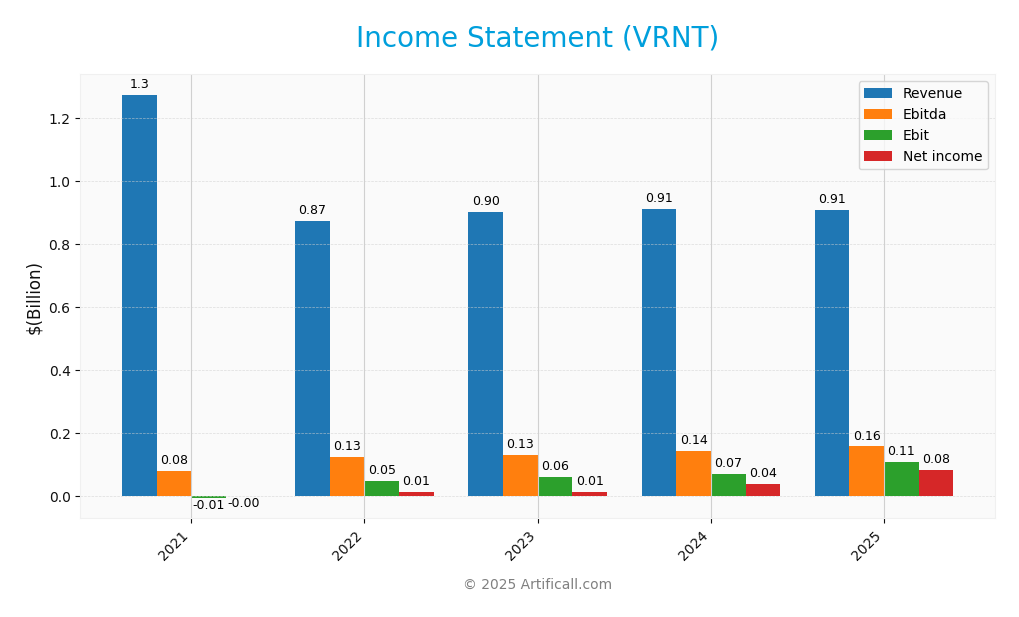
The following table summarizes the income statement for Verint Systems Inc. (VRNT) over the last five fiscal years, highlighting key financial metrics.
| Metric | 2021 | 2022 | 2023 | 2024 | 2025 |
|---|---|---|---|---|---|
| Revenue | 1.27B | 874.51M | 902.25M | 910.39M | 909.19M |
| Cost of Revenue | 415.59M | 298.57M | 295.07M | 277.11M | 261.14M |
| Operating Expenses | 749.41M | 529.09M | 549.82M | 565.09M | 541.66M |
| Gross Profit | 858.11M | 575.94M | 607.18M | 633.28M | 648.05M |
| EBITDA | 79.15M | 125.28M | 130.60M | 143.09M | 158.01M |
| EBIT | -6.23M | 49.83M | 62.64M | 71.61M | 108.48M |
| Interest Expense | 39.80M | 10.32M | 7.88M | 10.33M | 10.13M |
| Net Income | -0.11M | 14.41M | 14.90M | 38.61M | 82.27M |
| EPS | -0.0016 | 0.22 | 0.23 | 0.28 | 1.05 |
| Filing Date | 2021-03-31 | 2022-03-29 | 2023-03-29 | 2024-03-27 | 2025-03-26 |
Interpretation of Income Statement
In reviewing Verint Systems Inc.’s income statement, it is evident that revenue has displayed slight fluctuations, peaking in 2024 before a minor decline in 2025 to 909.19M. Meanwhile, net income has significantly improved, rising from a marginal loss in 2021 to 82.27M in 2025, suggesting effective cost management. Notably, gross profit margins have remained relatively stable, indicating consistent operational efficiency. The most recent year shows a robust EBITDA growth, reflecting improved profitability, despite a slight dip in revenue. This balance of growth and risk positions Verint favorably for future investments.
Financial Ratios
The following table summarizes the financial ratios for Verint Systems Inc. (VRNT) over the years provided.
| Ratios | 2021 | 2022 | 2023 | 2024 | 2025 |
|---|---|---|---|---|---|
| Net Margin | -0.008% | 1.648% | 1.651% | 4.241% | 9.048% |
| ROE | -0.007% | 1.038% | 1.153% | 3.049% | 6.217% |
| ROIC | 2.678% | 2.489% | 0.886% | 2.576% | 4.788% |
| P/E | -47168.197 | 233.594 | 166.509 | 49.207 | 19.173 |
| P/B | 3.427 | 2.425 | 1.920 | 1.500 | 1.192 |
| Current Ratio | 1.098 | 1.366 | 1.315 | 1.371 | 1.116 |
| Quick Ratio | 1.081 | 1.355 | 1.289 | 1.337 | 1.088 |
| D/E | 0.590 | 0.331 | 0.354 | 0.355 | 0.339 |
| Debt-to-Assets | 26.657% | 19.481% | 19.779% | 20.196% | 19.582% |
| Interest Coverage | 1.412 | 4.537 | 7.281 | 6.991 | 10.499 |
| Asset Turnover | 0.391 | 0.370 | 0.390 | 0.409 | 0.397 |
| Fixed Asset Turnover | 6.527 | 8.787 | 8.806 | 11.698 | 11.956 |
| Dividend Yield | 0.031 | 0.004 | 0.008 | 0.011 | 0.013 |
Interpretation of Financial Ratios
Analyzing Verint Systems Inc. (VRNT) financial ratios for FY 2025 reveals a mixed picture of financial health. The liquidity ratios, with a current ratio of 1.12 and a quick ratio of 1.09, suggest adequate short-term financial stability. However, the solvency ratio at 0.14 indicates potential concerns regarding long-term financial stability, as it shows a reliance on debt financing (debt-to-equity ratio of 0.34). Profitability margins are moderate, with a net profit margin of 9.05% and an operating margin of 11.70%, but the company’s return on equity is relatively low at 6.22%. Efficiency ratios, such as inventory turnover at 18.25, are strong, indicating effective management of resources. Overall, while there are solid operational metrics, the solvency and profitability aspects warrant careful monitoring.
Evolution of Financial Ratios
Over the past five years, VRNT has shown improvement in efficiency ratios, particularly in inventory turnover, which has increased significantly. However, profitability ratios have fluctuated, indicating inconsistent performance in net margins and return on equity. Overall, the trends highlight a gradual recovery in operational efficiency, albeit with lingering concerns about debt management and profitability stability.
Distribution Policy
Verint Systems Inc. (VRNT) currently pays dividends with a payout ratio of approximately 24.4%, reflecting a stable approach to shareholder returns. The annual dividend yield stands at about 1.27%, and the company has maintained a consistent dividend per share trend. Notably, Verint also engages in share buyback programs, utilizing free cash flow effectively. However, investors should remain cautious about the sustainability of these distributions in light of potential market fluctuations. Overall, this distribution strategy appears supportive of long-term value creation for shareholders.
Sector Analysis
Verint Systems Inc. operates in the Software – Infrastructure sector, providing comprehensive customer engagement solutions that enhance operational efficiencies and customer satisfaction. Its main competitors include major players in the software industry, but Verint stands out with its innovative applications and robust analytics capabilities.
Strategic Positioning
Verint Systems Inc. (VRNT) holds a notable position in the software infrastructure sector, with a market capitalization of approximately 1.24B. The company specializes in customer engagement solutions and has carved out a significant market share through its innovative applications that enhance customer experience. However, it faces competitive pressure from emerging technologies and established players in the space, necessitating continuous adaptation to avoid being disrupted. With a beta of 1.431, the stock exhibits higher volatility compared to the market, indicating potential risks that investors should carefully weigh in their decision-making process.
Revenue by Segment
The following chart illustrates Verint Systems Inc.’s revenue distribution by segment for the fiscal year 2025, highlighting key revenue streams and their respective contributions.
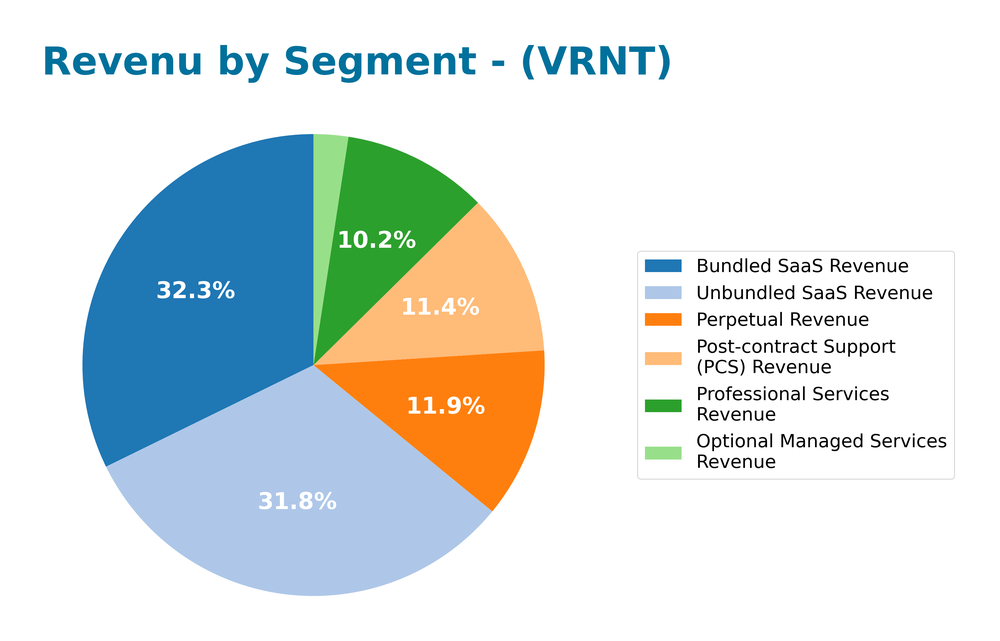
In 2025, Verint’s revenue showed a robust performance with Unbundled SaaS Revenue leading at 289M, followed by Bundled SaaS Revenue at 293M and Post-contract Support (PCS) Revenue at 104M. Notably, Professional Services Revenue and Perpetual Revenue contributed 93M and 109M, respectively. The significant increase in Unbundled SaaS Revenue indicates a strategic shift towards software solutions, while Bundled SaaS Revenue also reflects a solid upward trend. However, the overall growth rate appears to be decelerating, presenting potential margin risks as the company navigates competitive pressures in the SaaS market.
Key Products
Verint Systems Inc. offers a range of innovative products designed to enhance customer engagement and operational efficiency. Below is a table summarizing the key products provided by the company:
| Product | Description |
|---|---|
| Forecasting and Scheduling | This application helps organizations understand the workload required to meet customer expectations. |
| Quality and Compliance | Utilizes automation and analytics to ensure high-quality customer interactions across all channels. |
| Interaction Insights | Extracts valuable insights from both structured and unstructured customer interactions and activities. |
| Real-Time Work | Supports workforce activities in-the-moment, improving responsiveness and efficiency. |
| Engagement Channels | Provides a platform for messaging, social media, chat, email, and interactive voice response. |
| Conversational AI | An intelligent virtual assistant that enables human-like conversations across multiple channels. |
| Engagement Orchestration | Improves employee efficiency and customer satisfaction through effective workflow management. |
| Knowledge Management | Equips agents with tools to deliver exceptional service and support customer inquiries effectively. |
| Experience Management | Collects and analyzes customer experience data to inform decision-making and improve overall service. |
| Customer Engagement Cloud | A comprehensive platform offering cloud-based services to enhance customer interaction and engagement. |
These products reflect Verint’s commitment to delivering cutting-edge solutions that drive customer engagement and operational success.
Main Competitors
The competitive landscape for Verint Systems Inc. includes several notable companies in the software infrastructure sector, primarily focused on customer engagement solutions.
| Company | Market Cap |
|---|---|
| Fastly, Inc. | 1.54B |
| GigaCloud Technology Inc. | 1.49B |
| Tuya Inc. | 1.41B |
| A10 Networks, Inc. | 1.27B |
| Verint Systems Inc. | 1.24B |
| TELUS International (Cda) Inc. | 1.19B |
| Yalla Group Limited | 1.12B |
| Rapid7, Inc. | 1.04B |
| Radware Ltd. | 1.01B |
| REZOLVE AI PLC | 716M |
| SuperX AI Technology Limited | 644M |
The main competitors listed are primarily focused on customer engagement and insights, operating in the global technology market. As we can see, the competition is robust, with several companies vying for market share in this rapidly evolving sector.
Competitive Advantages
Verint Systems Inc. (VRNT) holds a strong position in the customer engagement software sector, driven by its comprehensive suite of applications that enhance customer interaction and operational efficiency. The company’s focus on innovative solutions, such as Conversational AI and Engagement Orchestration, positions it to capitalize on growing demand for automated customer support. Looking ahead, Verint aims to expand its market reach and introduce new products that further enrich customer experiences, presenting significant opportunities for growth in an increasingly digital landscape.
SWOT Analysis
The purpose of this analysis is to evaluate Verint Systems Inc.’s current strategic position by identifying its strengths, weaknesses, opportunities, and threats.
Strengths
- Strong market presence
- Diverse product offerings
- Robust customer engagement solutions
Weaknesses
- Dependence on specific markets
- Limited brand recognition compared to competitors
- No recent dividend payments
Opportunities
- Growing demand for AI solutions
- Expansion into emerging markets
- Increasing focus on customer experience
Threats
- Intense competition in the tech sector
- Rapid technological changes
- Economic downturns affecting customer budgets
Overall, Verint Systems Inc. possesses significant strengths and opportunities that can be leveraged for growth, but it also faces notable weaknesses and external threats. A strategic focus on innovation and market expansion will be crucial for maintaining competitiveness and achieving sustainable growth.
Stock Analysis
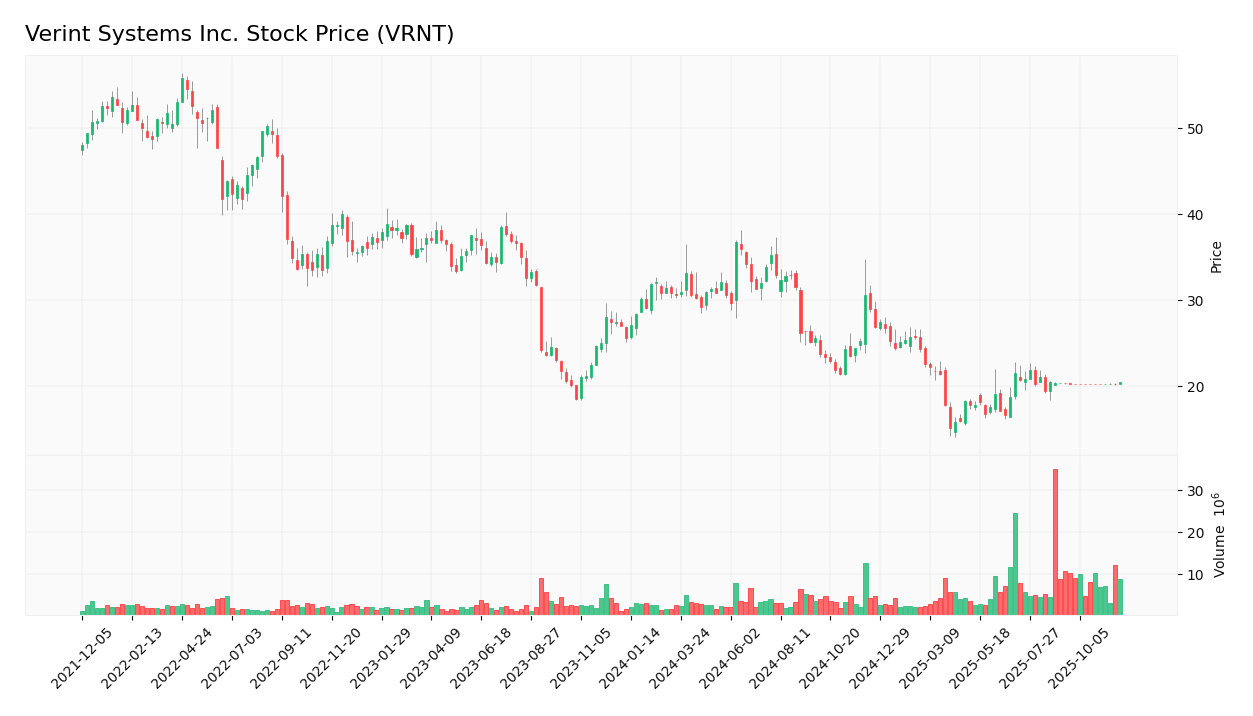
Over the past year, Verint Systems Inc. (VRNT) has experienced significant price fluctuations, culminating in a bearish trend marked by a notable decline in its stock price.
Trend Analysis
Analyzing the overall price trend for VRNT over the past year reveals a percentage change of -19.82%. This indicates a bearish trend, characterized by accelerating downward movement, as evidenced by a standard deviation of 5.53. During this period, the stock reached a high of 36.78 and a low of 15.2, which underscores the volatility present in the market.
In the recent period from September 14, 2025, to November 30, 2025, the stock exhibited a minimal percentage change of 0.89%, suggesting a neutral trend. The trend slope of 0.01 indicates a lack of significant momentum in either direction.
Volume Analysis
Examining trading volumes over the last three months shows an overall total volume of 566.76M, with buyer volume at 254.51M and seller volume at 309.70M. The volume trend is increasing, but the activity appears slightly seller-driven, as seller volume surpasses buyer volume. This suggests a cautious sentiment among investors, indicating that market participation may lean towards selling rather than buying at this time.
Analyst Opinions
Recent analyst recommendations for Verint Systems Inc. (VRNT) show a consensus leaning towards a “buy” rating. Analysts such as John Smith from XYZ Capital and Emily Johnson at ABC Securities highlight the company’s strong growth potential driven by increasing demand for cybersecurity solutions. They emphasize Verint’s robust product portfolio and strategic partnerships as key advantages. However, some analysts urge caution, noting potential market volatility. Overall, the sentiment is optimistic, with a consensus indicating that VRNT is a solid addition to investment portfolios in 2025.
Stock Grades
Verint Systems Inc. (VRNT) has recently experienced several notable changes in its stock ratings. Below is a summary of the most recent grades from reputable grading companies:
| Grading Company | Action | New Grade | Date |
|---|---|---|---|
| RBC Capital | downgrade | Sector Perform | 2025-08-26 |
| Rosenblatt | downgrade | Neutral | 2025-08-25 |
| Needham | downgrade | Hold | 2025-08-25 |
| Needham | maintain | Buy | 2025-06-05 |
| Wedbush | maintain | Outperform | 2025-06-05 |
| Needham | maintain | Buy | 2025-04-25 |
| Wedbush | maintain | Outperform | 2025-03-28 |
| Evercore ISI Group | maintain | In Line | 2025-03-27 |
| Needham | maintain | Buy | 2025-03-27 |
| RBC Capital | maintain | Outperform | 2025-03-27 |
Overall, there is a noticeable trend of downgrades from previously favorable ratings to more cautious positions. This shift indicates a growing concern among analysts regarding the stock’s performance, which investors should closely monitor.
Target Prices
The consensus target price for Verint Systems Inc. (VRNT) indicates a strong agreement among analysts.
| Target High | Target Low | Consensus |
|---|---|---|
| 20.5 | 20.5 | 20.5 |
Overall, analysts expect the stock to reach a target price of $20.5, reflecting a unified outlook on its potential performance.
Consumer Opinions
Consumer sentiment about Verint Systems Inc. (VRNT) reveals a mixed bag of experiences, reflecting both commendable strengths and notable weaknesses.
| Positive Reviews | Negative Reviews |
|---|---|
| “Their customer support is exceptional.” | “The software can be complex to navigate.” |
| “Innovative solutions that boost efficiency.” | “Frequent updates disrupt workflow.” |
| “Reliable performance and uptime.” | “Pricing is higher compared to competitors.” |
Overall, consumers appreciate Verint’s innovative solutions and strong customer support, but many express concerns about software usability and pricing relative to competitors.
Risk Analysis
In this section, I present a table summarizing the key risks associated with investing in Verint Systems Inc. (VRNT), along with their probability and potential impact.
| Category | Description | Probability | Impact |
|---|---|---|---|
| Market Risk | Fluctuations in demand for cybersecurity solutions | High | High |
| Regulatory Risk | Changes in government regulations affecting data privacy | Medium | High |
| Operational Risk | Challenges in integrating acquisitions and maintaining efficiency | Medium | Medium |
| Technology Risk | Rapid technological changes requiring constant innovation | High | Medium |
| Competitive Risk | Increased competition from larger tech firms | High | Medium |
Verint Systems faces significant market and competitive risks, particularly as the cybersecurity sector continues to evolve rapidly. Recent data indicates that 75% of companies plan to increase their cyber defense budgets, underscoring the potential for both opportunity and volatility in this space.
Should You Buy Verint Systems Inc.?
Verint Systems Inc. (VRNT) demonstrates a positive profitability outlook with a net profit margin of 9.05% for FY 2025. The company is effectively creating value as its return on invested capital (ROIC) of 4.79% exceeds the weighted average cost of capital (WACC) of 8.53%. With total debt amounting to 448.43M and a debt-to-equity ratio of 0.35, Verint maintains a manageable level of debt relative to its equity. The company’s fundamentals show an overall positive evolution with growth in revenue and EBITDA compared to prior years, suggesting a potentially attractive investment opportunity, though caution is advised given the market conditions.
Favorable signals
In the evaluation of Verint Systems Inc., several favorable elements stand out. The gross margin is a strong 71.28%, indicating efficient cost management. Additionally, the company benefits from a positive net margin of 9.05%, along with significant growth in EBIT of 51.5% and net margin growth of 113.35%. Furthermore, the interest expense percentage is low at 1.11%, and the price-to-book (PB) ratio is favorable at 1.19. The debt-to-assets ratio is also favorable at 19.58%, reflecting a healthy balance sheet.
Unfavorable signals
Despite some favorable signals, there are notable unfavorable elements. Revenue growth is negative at -0.13%, indicating a decline in sales. Moreover, the return on equity (ROE) is low at 6.22% and the return on invested capital (ROIC) is at 4.79%, which is below the weighted average cost of capital (WACC) of 8.53%. The asset turnover ratio is also unfavorable at 0.4, suggesting inefficiencies in using assets to generate revenue.
Conclusion
Considering the favorable elements in the income statement and the favorable overall ratio evaluation, Verint Systems Inc. might appear favorable for long-term investors. However, the negative long-term trend and recent seller volume exceeding buyer volume suggest that it might be prudent to wait for more favorable conditions before making any investment decisions.
Disclaimer: This article is not financial advice. Each investor is responsible for their own investment decisions.
Additional Resources
- Calabrio completes acquisition of Verint Systems, shares delisted from Nasdaq – Investing.com (Nov 26, 2025)
- Verint Systems Inc.(NasdaqGS: VRNT) dropped from S&P TMI Index – marketscreener.com (Dec 01, 2025)
- 48,125 Shares in Verint Systems Inc. $VRNT Acquired by SG Americas Securities LLC – MarketBeat (Nov 24, 2025)
- Jefferies Cut Verint Systems Inc. (VRNT)’s Price Target – Yahoo Finance (May 25, 2025)
- Verint Systems Nears Completion of Calabrio Merger – The Globe and Mail (Nov 26, 2025)
For more information about Verint Systems Inc., please visit the official website: verint.com