In a world increasingly reliant on seamless connectivity and automation, Teradyne, Inc. stands at the forefront of the semiconductor industry, revolutionizing how we interact with technology daily. With a diverse portfolio that includes cutting-edge test equipment and innovative robotics solutions, Teradyne has earned a reputation for excellence and reliability. As we delve into its financial health and market position, we must consider whether the company’s strong fundamentals continue to justify its current valuation and growth trajectory.

Table of contents
Company Description
Teradyne, Inc. is a leading provider of automatic test equipment headquartered in North Reading, Massachusetts, and incorporated in 1960. The company operates across several segments: Semiconductor Test, System Test, Industrial Automation, and Wireless Test, catering to diverse markets including automotive, industrial, and telecommunications. With a robust portfolio, Teradyne offers innovative testing solutions for semiconductor devices, defense systems, and wireless technologies. As a technology sector player, it employs approximately 6,500 professionals and serves clients globally. Teradyne’s strategic positioning emphasizes its commitment to advancing automation and testing capabilities, significantly shaping the future of the semiconductor and robotics industries.
Fundamental Analysis
In this section, I will analyze Teradyne, Inc.’s income statement, financial ratios, and dividend payout policy to assess its financial health and investment potential.
Income Statement
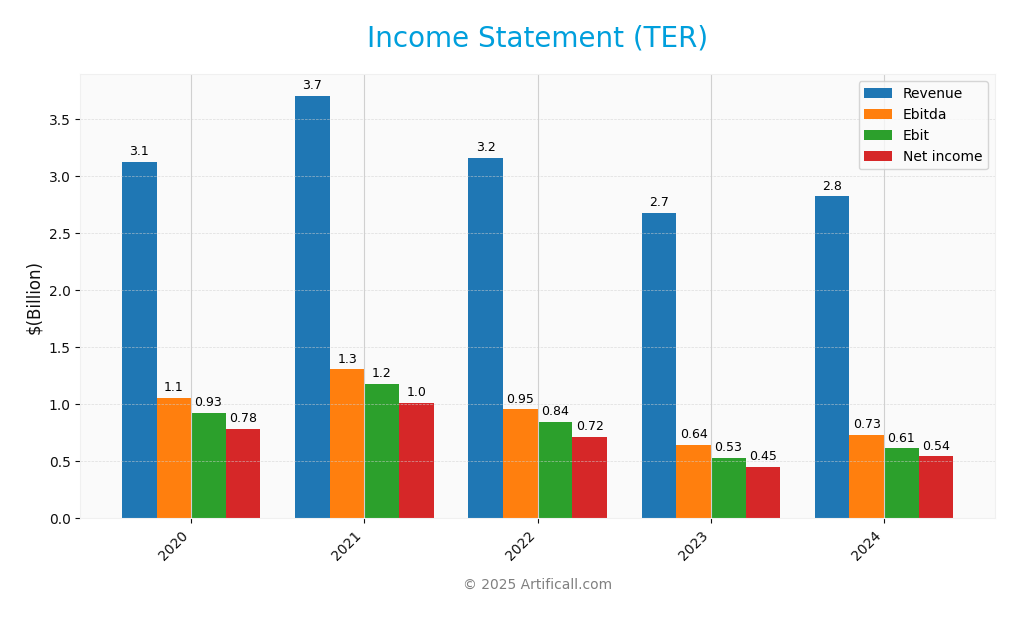
The following table outlines the income statement for Teradyne, Inc. (Ticker: TER) over the past five fiscal years, highlighting key financial metrics such as revenue, expenses, and net income.
| Metric | 2020 | 2021 | 2022 | 2023 | 2024 |
|---|---|---|---|---|---|
| Revenue | 3.12B | 3.70B | 3.15B | 2.68B | 2.82B |
| Cost of Revenue | 1.34B | 1.50B | 1.29B | 1.14B | 1.17B |
| Operating Expenses | 857M | 1.01B | 1.04B | 1.04B | 1.06B |
| Gross Profit | 1.79B | 2.21B | 1.87B | 1.54B | 1.65B |
| EBITDA | 1.05B | 1.30B | 955M | 640M | 732M |
| EBIT | 925M | 1.18B | 844M | 529M | 613M |
| Interest Expense | 24M | 18M | 4M | 4M | 4M |
| Net Income | 784M | 1.01B | 716M | 449M | 542M |
| EPS | 4.72 | 6.15 | 4.52 | 2.91 | 3.41 |
| Filing Date | 2021-02-22 | 2022-02-23 | 2023-02-22 | 2024-02-22 | 2025-02-20 |
Interpretation of Income Statement
Over the five-year period, Teradyne has experienced fluctuations in revenue, peaking at 3.70B in 2021, before declining to 2.68B in 2023, followed by a slight recovery to 2.82B in 2024. Net income has shown a similar trend, with a high of 1.01B in 2021 and a decrease to 449M in 2023, rebounding to 542M in 2024. Margins have remained relatively stable, but the latest year’s performance indicates a cautious recovery, suggesting that while Teradyne’s revenue still lags behind its peak, improved cost management may be enhancing profitability.
Financial Ratios
Here is a summary of the financial ratios for Teradyne, Inc. (Ticker: TER) over the years.
| Ratios | 2020 | 2021 | 2022 | 2023 | 2024 |
|---|---|---|---|---|---|
| Net Margin | 25.12% | 27.40% | 22.68% | 16.77% | 19.23% |
| ROE | 35.47% | 39.57% | 29.19% | 17.77% | 19.24% |
| ROIC | 26.88% | 34.48% | 25.08% | 15.04% | 17.25% |
| P/E | 25.40 | 26.59 | 19.34 | 37.32 | 36.93 |
| P/B | 9.01 | 10.52 | 5.65 | 6.63 | 7.10 |
| Current Ratio | 3.45 | 3.20 | 3.03 | 3.28 | 2.91 |
| Quick Ratio | 2.83 | 2.44 | 1.93 | 2.05 | 1.84 |
| D/E | 0.21 | 0.07 | 0.05 | 0.03 | 0.03 |
| Debt-to-Assets | 12.94% | 4.85% | 3.80% | 2.37% | 2.07% |
| Interest Coverage | 38.39 | 67.38 | 223.70 | 131.65 | 165.54 |
| Asset Turnover | 0.85 | 0.97 | 0.90 | 0.77 | 0.76 |
| Fixed Asset Turnover | 6.95 | 8.12 | 6.41 | 5.16 | 4.88 |
| Dividend Yield | 0.33% | 0.25% | 0.50% | 0.40% | 0.38% |
Interpretation of Financial Ratios
Analyzing Teradyne, Inc. (TER) as of December 31, 2024, reveals a robust financial position. The liquidity ratios are strong, with a current ratio of 2.91 and a quick ratio of 1.84, indicating good short-term financial health. The solvency ratio of 0.74 shows that the company is less reliant on debt, which is further supported by a low debt-to-equity ratio of 0.03. Profitability is also impressive, with a net profit margin of 19.23% and a return on equity of 19.24%, indicating efficient management of revenues. However, the high price-to-earnings ratio of 36.93 may suggest that the stock is overvalued, posing a potential risk for investors.
Evolution of Financial Ratios
Over the past five years, Teradyne’s financial ratios have shown a mixed trend. While profitability ratios peaked in 2022, liquidity ratios have consistently remained strong, indicating stability despite fluctuations in revenue and market conditions.
Distribution Policy
Teradyne, Inc. (TER) maintains a modest dividend payout ratio of approximately 14%, distributing $0.48 per share, which results in an annual dividend yield of about 0.38%. The company also engages in share buybacks, which can enhance shareholder value. However, investors should remain cautious about potential risks, such as unsustainable distributions and the impact of economic fluctuations on cash flow. Overall, Teradyne’s strategy appears aligned with long-term value creation for shareholders.
Sector Analysis
Teradyne, Inc. operates within the semiconductor industry, providing advanced test equipment for various applications, with key competitors including Keysight and National Instruments. Its competitive advantages lie in its strong product portfolio and robust market presence.
Strategic Positioning
Teradyne, Inc. holds a significant position in the semiconductor test equipment market, with a robust market cap of $32.25B. The company has a competitive edge through its diverse product offerings spanning semiconductor test, industrial automation, and wireless test segments. However, it faces pressure from emerging technologies and competitors aiming to disrupt its market share. With a beta of 1.848, the stock exhibits higher volatility, which may present risks but also opportunities for discerning investors. As technology continues to evolve, Teradyne’s ability to innovate will be critical in maintaining its market leadership.
Revenue by Segment
The following chart illustrates Teradyne, Inc.’s revenue distribution by segment for the fiscal year ending December 31, 2024.

In 2024, Teradyne reported total revenue of approximately $2.35B from its Product and Service segments, with the Product segment generating $2.29B and Services contributing $525M. Over the last few years, the Product segment has shown a declining trend from a peak of $3.20B in 2021, indicating a potential saturation in product demand or market challenges. Meanwhile, Service revenue has remained relatively stable, though it saw a slight decrease from 2023. The current year’s performance reflects a cautious approach to growth, highlighting the need for focus on margin management and diversification strategies to mitigate potential concentration risks.
Key Products
Teradyne, Inc. offers a diverse range of products tailored to meet the needs of various sectors within the semiconductor and automation industries. Below is a table summarizing some of their key products:
| Product | Description |
|---|---|
| FLEX Test Platform | A versatile testing platform designed for a wide range of semiconductor devices including automotive and consumer applications. |
| J750 Test System | A high-volume test system specifically for semiconductor devices, focusing on efficient performance in testing. |
| Magnum Platform | A specialized platform for testing memory devices such as flash memory and DRAM, addressing industry standards. |
| ETS Test Platform | Designed for analog/mixed signal markets, providing comprehensive testing solutions for semiconductor manufacturers. |
| Collaborative Robotics | Advanced robotic arms designed for ease of use in manufacturing and logistics, enhancing productivity and safety. |
| IQxel Products | A range of test solutions for wireless technologies, including Wi-Fi and IoT devices, under the LitePoint brand. |
| IQxstream Solution | A testing solution for various mobile communication standards including LTE and 5G, ensuring compatibility and performance. |
| IQcell | A test solution for multi-device cellular signaling, allowing for comprehensive testing of modern communication devices. |
These products reflect Teradyne’s commitment to innovation in testing technology and automated solutions, catering to a broad array of industries.
Main Competitors
The competitive landscape for Teradyne, Inc. in the semiconductor industry is vibrant, featuring several notable players. Below is a table showcasing the main competitors, including Teradyne itself, sorted by descending market capitalization:
| Company | Market Cap |
|---|---|
| Keysight Technologies, Inc. | 36.17B |
| Microchip Technology Incorporated | 35.45B |
| Sandisk Corporation | 33.19B |
| ASE Technology Holding Co., Ltd. | 32.95B |
| Wipro Limited | 29.83B |
| Astera Labs, Inc. Common Stock | 27.23B |
| STMicroelectronics N.V. | 23.20B |
| ON Semiconductor Corporation | 22.39B |
| Super Micro Computer, Inc. | 20.65B |
| United Microelectronics Corporation | 20.00B |
| Teradyne, Inc. | 32.25B |
The semiconductor sector is characterized by strong competition, with companies like Keysight Technologies and Microchip Technology leading the market. This landscape is primarily concentrated in North America, where innovation and technological advancements are driving growth.
Competitive Advantages
Teradyne, Inc. (TER) possesses several competitive advantages that position it well in the semiconductor and automation industries. With a robust portfolio of automated test equipment, Teradyne serves diverse sectors, including automotive, industrial, and wireless technologies. Its innovative FLEX and Magnum platforms cater to the increasing demand for efficient semiconductor testing. Looking ahead, Teradyne is poised to capitalize on opportunities in emerging markets, such as 5G technology and autonomous robotics, enhancing its growth potential. The company’s commitment to R&D ensures it remains at the forefront of technological advancements, providing a solid foundation for future expansion.
SWOT Analysis
The SWOT analysis provides a structured evaluation of Teradyne, Inc.’s strategic position, highlighting its strengths, weaknesses, opportunities, and threats.
Strengths
- Strong market position in semiconductor testing
- Diverse product portfolio across various segments
- Experienced management team
Weaknesses
- High dependency on the semiconductor industry
- Exposure to economic cycles
- Relatively high beta of 1.848 indicates volatility
Opportunities
- Growth in automation and robotics market
- Increasing demand for 5G testing solutions
- Expansion into emerging markets
Threats
- Intense competition in the semiconductor industry
- Rapid technological changes
- Supply chain disruptions
Overall, Teradyne, Inc. possesses a solid foundation with significant strengths and growth opportunities. However, the company must remain vigilant against industry volatility and competitive pressures to sustain its market position.
Stock Analysis
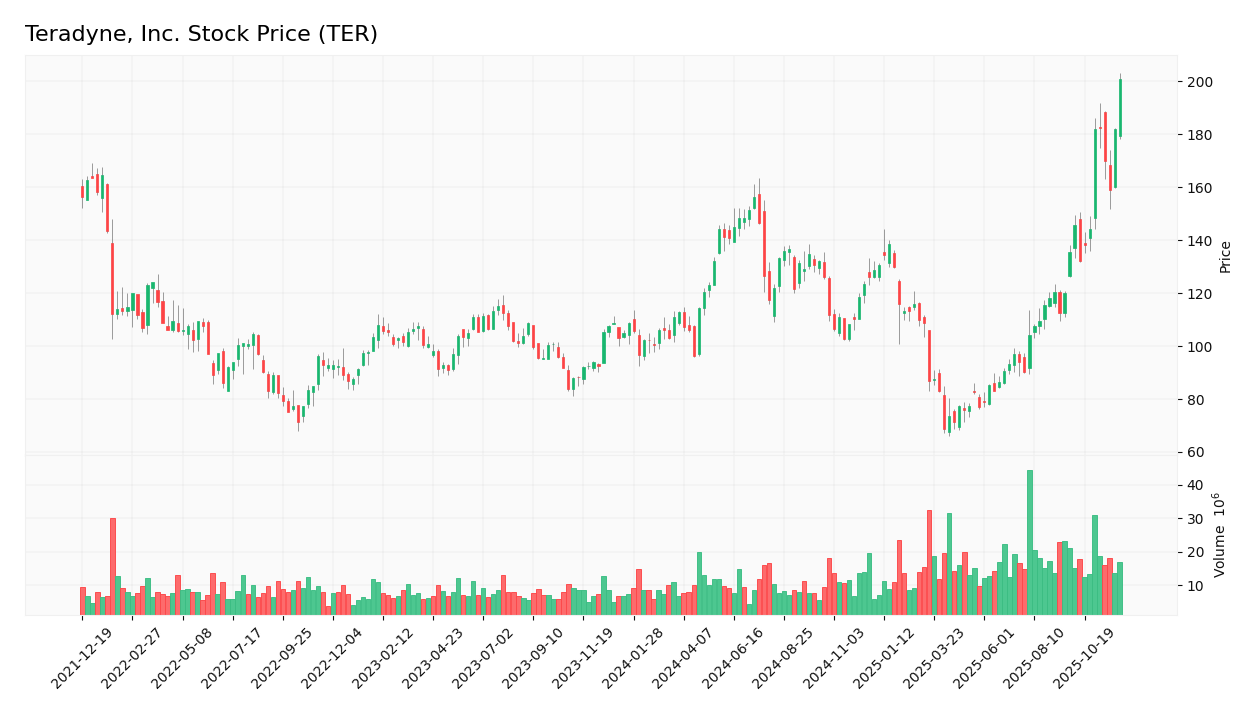
Over the past year, Teradyne, Inc. (TER) has experienced significant price movements, reflecting key trading dynamics that indicate a robust bullish trend.
Trend Analysis
In analyzing the stock’s performance over the last 12 months, Teradyne has shown a remarkable price change of +91.56%. This substantial increase confirms a bullish trend. Notably, the stock reached a high of 200.77 and a low of 68.72, indicating considerable volatility with a standard deviation of 25.88. The trend is characterized by acceleration, suggesting that the upward momentum is gaining strength, which could be appealing for potential investors.
Volume Analysis
Examining the trading volumes over the last three months reveals a total volume of approximately 1.5B shares, with buyer-driven activity accounting for 60.22% of this volume. The volume trend is increasing, with recent data indicating a strong buyer dominance at 76.14% during the latest period analyzed. This sustained buyer activity suggests positive investor sentiment and heightened market participation, which may support further price appreciation in the coming weeks.
Analyst Opinions
Recent recommendations for Teradyne, Inc. (TER) indicate a consensus to hold, with a B+ rating from analysts. Key arguments for this stance include strong returns on equity (4) and assets (5), highlighting the company’s solid financial health. However, lower scores in price-to-earnings (2) and price-to-book (1) suggest caution regarding valuation. Analysts emphasize a balanced approach, advising investors to monitor market conditions closely before making significant decisions. Overall, the prevailing sentiment leans towards a cautious hold rather than a buy or sell for the current year.
Stock Grades
Recent stock ratings for Teradyne, Inc. (TER) indicate a positive shift in sentiment among analysts, particularly with a notable upgrade.
| Grading Company | Action | New Grade | Date |
|---|---|---|---|
| Stifel | upgrade | Buy | 2025-12-02 |
| Citigroup | maintain | Buy | 2025-11-12 |
| Evercore ISI Group | maintain | Outperform | 2025-10-30 |
| JP Morgan | maintain | Neutral | 2025-10-30 |
| UBS | maintain | Buy | 2025-10-30 |
| Goldman Sachs | maintain | Sell | 2025-10-30 |
| Evercore ISI Group | maintain | Outperform | 2025-10-28 |
| Stifel | maintain | Hold | 2025-10-28 |
| UBS | maintain | Buy | 2025-10-20 |
| Morgan Stanley | maintain | Equal Weight | 2025-10-14 |
Overall, there is a positive trend with multiple analysts maintaining or upgrading their ratings, especially with Stifel’s recent upgrade to “Buy,” reflecting an optimistic outlook for Teradyne. However, Goldman Sachs continues to maintain a “Sell” rating, indicating some caution in certain segments of the market.
Target Prices
The consensus target price for Teradyne, Inc. (TER) reflects a balanced outlook from analysts.
| Target High | Target Low | Consensus |
|---|---|---|
| 225 | 136 | 184.44 |
Overall, analysts expect a target price around 184.44, indicating a moderate growth potential for the stock.
Consumer Opinions
Consumer sentiment towards Teradyne, Inc. (TER) reveals a balanced mix of praise and criticism, reflecting a variety of experiences with the company’s products and services.
| Positive Reviews | Negative Reviews |
|---|---|
| “Excellent product quality and reliability.” | “Customer support could be improved.” |
| “Innovative technology that meets our needs.” | “Pricing is higher than competitors.” |
| “Fast delivery and responsive service.” | “Updates are sometimes slow to roll out.” |
Overall, consumer feedback indicates that Teradyne excels in product quality and innovation but faces challenges in customer support and pricing competitiveness.
Risk Analysis
Understanding the risks associated with investing in Teradyne, Inc. (TER) is crucial for informed decision-making. Below is a table summarizing the key risks to consider:
| Category | Description | Probability | Impact |
|---|---|---|---|
| Market Volatility | Fluctuations in the semiconductor market can affect revenues. | High | High |
| Supply Chain | Disruptions in supply chains can delay production and delivery. | Medium | High |
| Regulatory | Changes in regulations impacting technology and exports. | Medium | Medium |
| Competition | Increased competition from emerging tech companies may erode market share. | High | Medium |
| Economic Downturn | A global recession may lead to reduced capital spending by customers. | Medium | High |
In summary, market volatility and supply chain disruptions pose the most significant risks to Teradyne, with high probabilities of occurrence and substantial impacts on performance. As the technology sector evolves, staying alert to these factors is essential for investors.
Should You Buy Teradyne, Inc.?
Teradyne, Inc. (TER) demonstrates strong profitability with a net income of 542M and a net profit margin of 19.23% for FY 2024, indicating effective cost management. The company creates value, as it has a return on invested capital (ROIC) of 17.25%, exceeding its weighted average cost of capital (WACC) of 12.42%. Additionally, Teradyne maintains a low total debt of 76.6M, translating to a debt-to-equity ratio of 0.0023, which reflects a solid balance sheet. The overall rating is B+, suggesting a generally favorable outlook, though investor caution is advised given its beta of 1.848, indicating higher volatility compared to the market.
Favorable signals
Teradyne, Inc. shows several favorable elements in its financial evaluation. The gross margin stands at a positive 58.48%, indicating efficient cost management. Additionally, the company has experienced a gross profit growth of 7.3% and an EBIT margin of 21.73%, both of which are favorable indicators of operational strength. The net margin is also impressive at 19.23%, with a growth rate of 14.71%. Furthermore, the company benefits from a current ratio of 2.91 and a quick ratio of 1.84, demonstrating solid liquidity.
Unfavorable signals
However, there are some unfavorable elements to consider. The return on invested capital (ROIC) is at 17.25%, which is lower than the weighted average cost of capital (WACC) at 12.42%, indicating value destruction. Additionally, the price-to-earnings (P/E) ratio of 36.93 and price-to-book (P/B) ratio of 7.11 suggest that the stock may be overvalued. Lastly, the dividend yield stands at a low 0.38%, which may be disappointing for income-focused investors.
Conclusion
In summary, while Teradyne, Inc. displays strong operational metrics and liquidity, the presence of value destruction and potential overvaluation signals caution. Therefore, it might be prudent to wait for a clearer trend before making investment decisions, particularly given the recent seller volume being less than the buyer volume.
Disclaimer: This article is not financial advice. Each investor is responsible for their own investment decisions.
Additional Resources
- Teradyne (TER) Is Considered a Good Investment by Brokers: Is That True? – Finviz (Dec 05, 2025)
- Teradyne (TER) Is Up 8.8% After Stifel’s AI Test Upgrade – What’s Changed – Yahoo Finance (Dec 04, 2025)
- Stifel Upgrades Teradyne (TER) – Nasdaq (Dec 02, 2025)
- Boston Family Office LLC Has $5.30 Million Position in Teradyne, Inc. $TER – MarketBeat (Dec 01, 2025)
- Teradyne (NASDAQ:TER) Nasdaq Today Tech Advancements – Kalkine Media (Dec 04, 2025)
For more information about Teradyne, Inc., please visit the official website: teradyne.com