Home > Analyses > Financial Services > Synchrony Financial
Synchrony Financial powers everyday purchases for millions of Americans through its extensive credit and financing solutions. As a dominant player in consumer financial services, it leads with private-label and co-branded credit cards, innovative installment loans, and specialized payment platforms across diverse industries. Known for its adaptability and customer-centric approach, Synchrony shapes how consumers interact with credit. The critical question now is whether its financial strength and growth prospects justify its current market valuation in a shifting economic landscape.

Table of contents
Business Model & Company Overview
Synchrony Financial, founded in 1932 and headquartered in Stamford, Connecticut, stands as a key player in the financial credit services sector. It operates a comprehensive ecosystem of credit solutions including private label, co-brand, and general purpose credit cards, alongside consumer installment loans. This diverse portfolio anchors its mission to deliver tailored financing options across retail, healthcare, and specialty markets.
The company’s revenue engine balances interest income from credit products with fees from deposit services and ancillary offerings such as debt cancellation and point-of-sale financing. Synchrony commands a strategic presence across the US, serving a broad range of industries from healthcare to luxury retail. Its competitive advantage lies in deep partnerships and multi-channel distribution, solidifying its economic moat against rising fintech disruptors.
Financial Performance & Fundamental Metrics
I analyze Synchrony Financial’s income statement, key financial ratios, and dividend payout policy to assess its operational efficiency and shareholder returns.
Income Statement
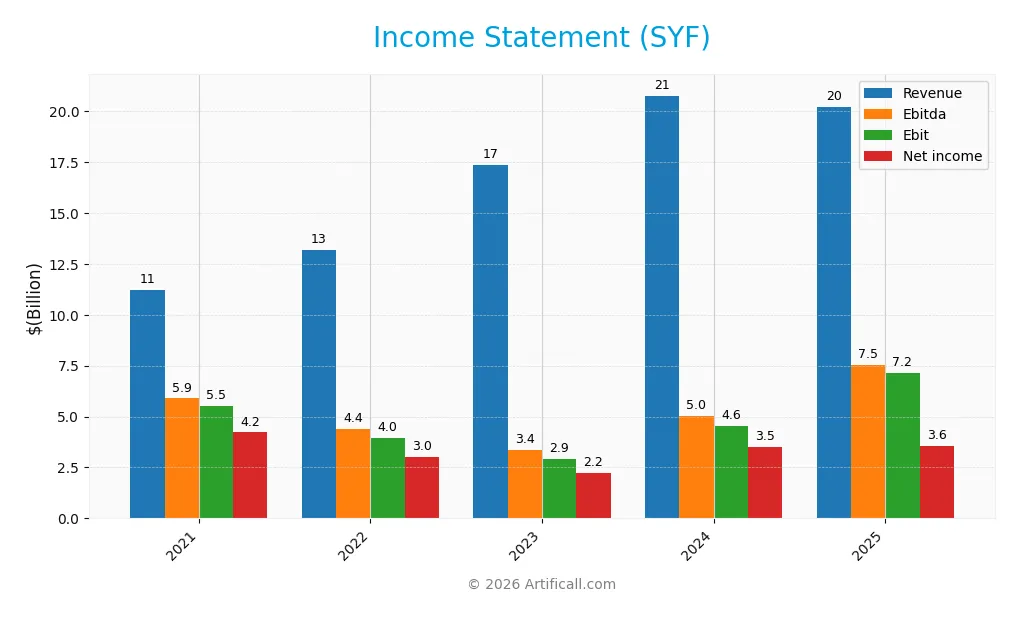
The table below summarizes key income statement metrics for Synchrony Financial (SYF) over the past five fiscal years.
| 2021 | 2022 | 2023 | 2024 | 2025 | |
|---|---|---|---|---|---|
| Revenue | 11.2B | 13.2B | 17.3B | 20.8B | 20.2B |
| Cost of Revenue | 1.8B | 4.9B | 9.7B | 11.4B | 7.9B |
| Operating Expenses | 4.0B | 4.3B | 4.8B | 4.8B | 5.1B |
| Gross Profit | 9.5B | 8.3B | 7.7B | 9.4B | 12.3B |
| EBITDA | 5.9B | 4.4B | 3.4B | 5.0B | 7.5B |
| EBIT | 5.5B | 4.0B | 2.9B | 4.6B | 7.2B |
| Interest Expense | 1.0B | 1.5B | 3.7B | 4.6B | 4.1B |
| Net Income | 4.2B | 3.0B | 2.2B | 3.5B | 3.6B |
| EPS | 7.40 | 6.19 | 5.21 | 8.64 | 9.35 |
| Filing Date | 2022-02-10 | 2023-02-09 | 2024-02-08 | 2025-02-07 | 2026-01-27 |
Income Statement Evolution
Synchrony Financial’s revenue grew 80% from 2021 to 2025 but declined 2.6% in the latest year. Gross profit surged 31% last year, boosting gross margins to a favorable 60.8%. EBIT expanded 57%, lifting EBIT margin to 35.4%, while net income fell 16% over the full period and net margins contracted by over 53%.
Is the Income Statement Favorable?
In 2025, the company posted a net margin of 17.6%, supported by strong gross and EBIT margins. However, interest expenses remain high at 20.5% of revenue, weighing on profitability. Despite a slight revenue dip, EPS rose 8.7%, reflecting improved operational efficiency. Overall, fundamentals appear favorable but warrant monitoring due to elevated interest costs.
Financial Ratios
The following table summarizes key financial ratios for Synchrony Financial (SYF) from 2021 to 2025, providing a clear view of profitability, leverage, liquidity, and valuation metrics:
| Ratios | 2021 | 2022 | 2023 | 2024 | 2025 |
|---|---|---|---|---|---|
| Net Margin | 37.61% | 22.86% | 12.91% | 16.86% | 17.58% |
| ROE | 30.91% | 23.43% | 16.10% | 21.10% | 21.19% |
| ROIC | 14.99% | 11.14% | 6.16% | 9.36% | -91.64% |
| P/E | 6.21 | 5.23 | 7.19 | 7.37 | 8.41 |
| P/B | 1.92 | 1.23 | 1.16 | 1.55 | 1.78 |
| Current Ratio | 0.20 | 0.20 | 0.22 | 0.22 | 0.00 |
| Quick Ratio | 0.20 | 0.20 | 0.22 | 0.22 | 0.00 |
| D/E | 1.06 | 1.10 | 1.15 | 0.93 | 0.91 |
| Debt-to-Assets | 15.15% | 13.57% | 13.60% | 12.94% | 12.75% |
| Interest Coverage | 5.33 | 2.60 | 0.78 | 0.98 | 1.73 |
| Asset Turnover | 0.12 | 0.13 | 0.15 | 0.17 | 0.17 |
| Fixed Asset Turnover | 0.00 | 0.00 | 0.00 | 0.00 | 0.00 |
| Dividend Yield | 2.07% | 3.02% | 2.79% | 1.82% | 1.38% |
Evolution of Financial Ratios
Return on Equity (ROE) remained robust, hovering around 21% in 2025, reflecting consistent profitability. The Current Ratio showed instability, dropping to zero in 2025, signaling liquidity concerns. Debt-to-Equity Ratio stabilized near 0.9, indicating moderate leverage and controlled debt usage. Profit margins improved slightly, with net margin rising to 17.58%.
Are the Financial Ratios Favorable?
Profitability ratios like ROE (21.19%) and net margin (17.58%) are favorable, showing strong earnings generation. Liquidity ratios are unfavorable, with current and quick ratios at zero, indicating potential short-term risk. Leverage appears neutral to favorable; debt-to-assets is low at 12.75%, but interest coverage at 1.73 is weak. Asset turnover and fixed asset turnover are also unfavorable. Overall, the ratio profile is slightly unfavorable.
Shareholder Return Policy
Synchrony Financial maintains a modest dividend payout ratio near 12%, with a stable dividend per share around $1.15 in 2025 and a yield of approximately 1.38%. The company also engages in share buybacks, balancing capital returns with cash preservation.
This dividend and repurchase strategy appears sustainable given Synchrony’s healthy net margins and cash reserves. However, the relatively low yield and payout suggest cautious capital allocation, supporting long-term shareholder value without risking over-distribution.
Score analysis
The radar chart below illustrates Synchrony Financial’s key valuation and financial performance scores:
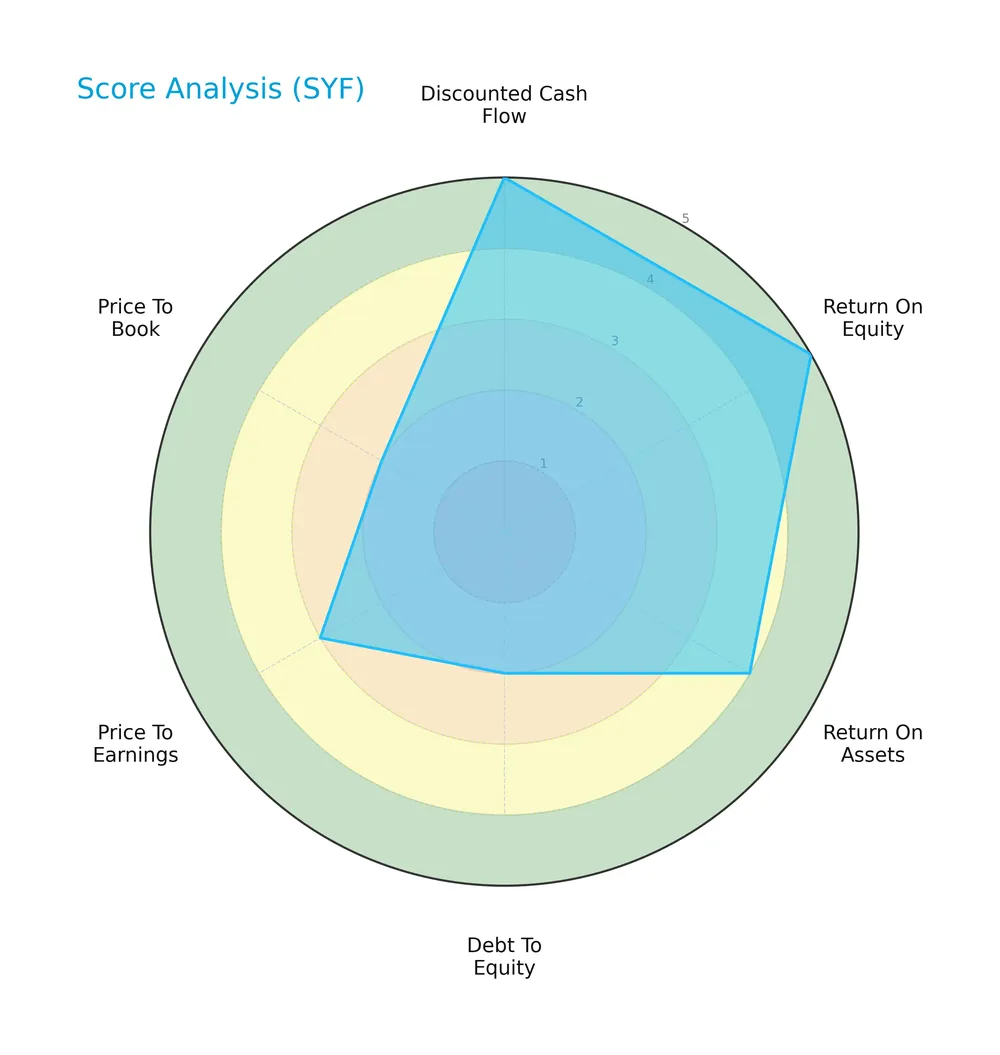
Synchrony scores very favorably on discounted cash flow and return on equity, indicating strong profitability and valuation support. Return on assets is also favorable. However, debt-to-equity and price-to-book ratios show weaknesses, signaling potential leverage and valuation concerns. Price-to-earnings is moderate.
Analysis of the company’s bankruptcy risk
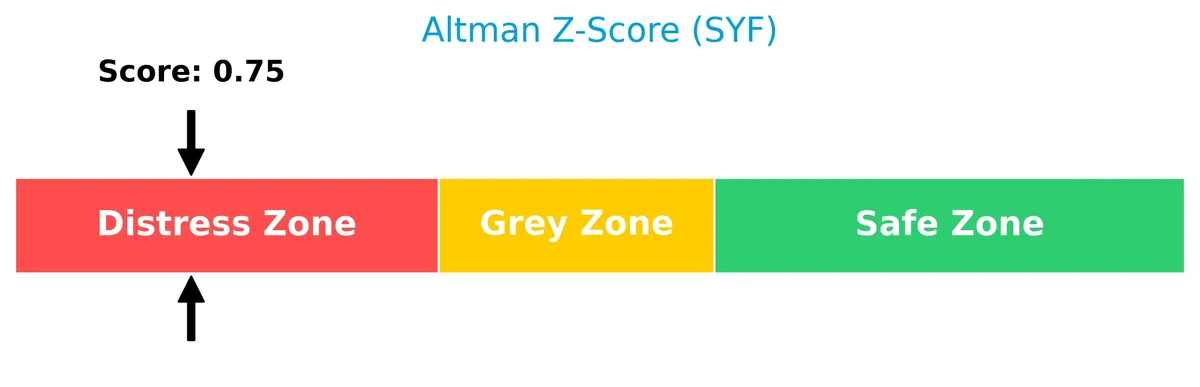
The Altman Z-Score places Synchrony Financial in the distress zone, indicating a high risk of financial distress and potential bankruptcy:
Is the company in good financial health?
The Piotroski Score diagram below highlights Synchrony Financial’s strong financial health based on nine fundamental criteria:

With a very strong Piotroski Score of 8, the company demonstrates robust profitability, leverage management, and operational efficiency, suggesting solid financial strength despite other risk factors.
Competitive Landscape & Sector Positioning
This sector analysis examines Synchrony Financial’s strategic positioning, revenue segments, key products, and main competitors. I will assess whether Synchrony Financial holds a competitive advantage within the financial credit services industry.
Strategic Positioning
Synchrony Financial concentrates its operations in the U.S. consumer financial services sector, offering a diversified product portfolio including credit cards, installment loans, and deposit products. It partners with national and regional retailers and serves varied industries such as healthcare, retail, and specialty sectors, maintaining a focused yet broad market reach.
Key Products & Brands
The table below outlines Synchrony Financial’s primary credit and deposit products and associated brand offerings:
| Product | Description |
|---|---|
| Private Label Credit Cards | Credit cards issued for specific retailers, providing consumer financing and loyalty benefits. |
| Dual Cards | Credit cards combining private label and general purpose functionality for flexible consumer use. |
| Co-brand Credit Cards | Cards offered in partnership with national and regional retailers, combining brand recognition and credit. |
| General Purpose Credit Cards | Traditional credit cards usable anywhere, supporting broad consumer spending needs. |
| Installment Loans | Short- and long-term loans for consumers, enabling structured repayment across diverse sectors. |
| Deposit Products | Certificates of deposit, IRAs, money market, and savings accounts accessible to retail and commercial clients. |
| Debt Cancellation Products | Services offering protection from debt obligations on credit cards via multiple digital channels. |
| Healthcare Payments and Financing | Solutions branded under CareCredit, Pets Best, and Walgreens, supporting medical and pet care expenses. |
| Point-of-Sale Financing | Consumer credit options at retail locations for audiology, dental, and specialty retail sectors. |
| Payments and Financing Solutions | Industry-specific financing in apparel, outdoor, music, luxury, and other specialty retail markets. |
Synchrony Financial’s portfolio spans diversified credit and deposit products, with strong emphasis on retail partnerships and healthcare financing. Its branded offerings cater to niche markets, supporting consumer spending through flexible credit solutions.
Main Competitors
There are 6 competitors in total, with the table listing the top 6 leaders by market capitalization:
| Competitor | Market Cap. |
|---|---|
| Visa Inc. | 672.3B |
| Mastercard Incorporated | 505.7B |
| American Express Company | 260.1B |
| Capital One Financial Corporation | 157.6B |
| PayPal Holdings, Inc. | 54.4B |
| Synchrony Financial | 32.1B |
Synchrony Financial ranks 6th among its competitors, holding just 4.03% of Visa’s market cap. The company sits below both the average market cap of the top 10 (280.4B) and the median sector market cap (208.8B). It enjoys a significant 100.95% market cap gap above its nearest competitor, highlighting a sizeable scale difference within this peer group.
Does SYF have a competitive advantage?
Synchrony Financial does not present a competitive advantage, as it is shedding value with a declining ROIC far below its cost of capital. This signals weakening profitability and inefficient capital use over the 2021-2025 period.
Looking ahead, Synchrony’s portfolio of credit products and healthcare financing solutions offers potential market opportunities. However, the company must address its value destruction trend to capitalize effectively on new products and expanding industries.
Comparisons with competitors
Check out how we compare the company to its competitors:
SWOT Analysis
This SWOT analysis highlights key internal and external factors shaping Synchrony Financial’s strategic outlook.
Strengths
- strong gross margin at 60.8%
- favorable EBIT margin of 35.4%
- robust ROE at 21.2%
Weaknesses
- negative ROIC indicating value destruction
- weak liquidity ratios (current and quick ratio at 0)
- high interest expense at 20.5%
Opportunities
- expanding digital and healthcare financing markets
- potential growth in private-label credit cards
- improving EPS growth trend at 8.7%
Threats
- declining revenue growth recently (-2.6%)
- rising interest rates increasing funding costs
- intense competition in credit services
Synchrony Financial leverages strong profitability and a solid market position but struggles with capital efficiency and liquidity. The company must address value destruction and manage rising interest expenses to capitalize on growth in digital finance and healthcare sectors.
Stock Price Action Analysis
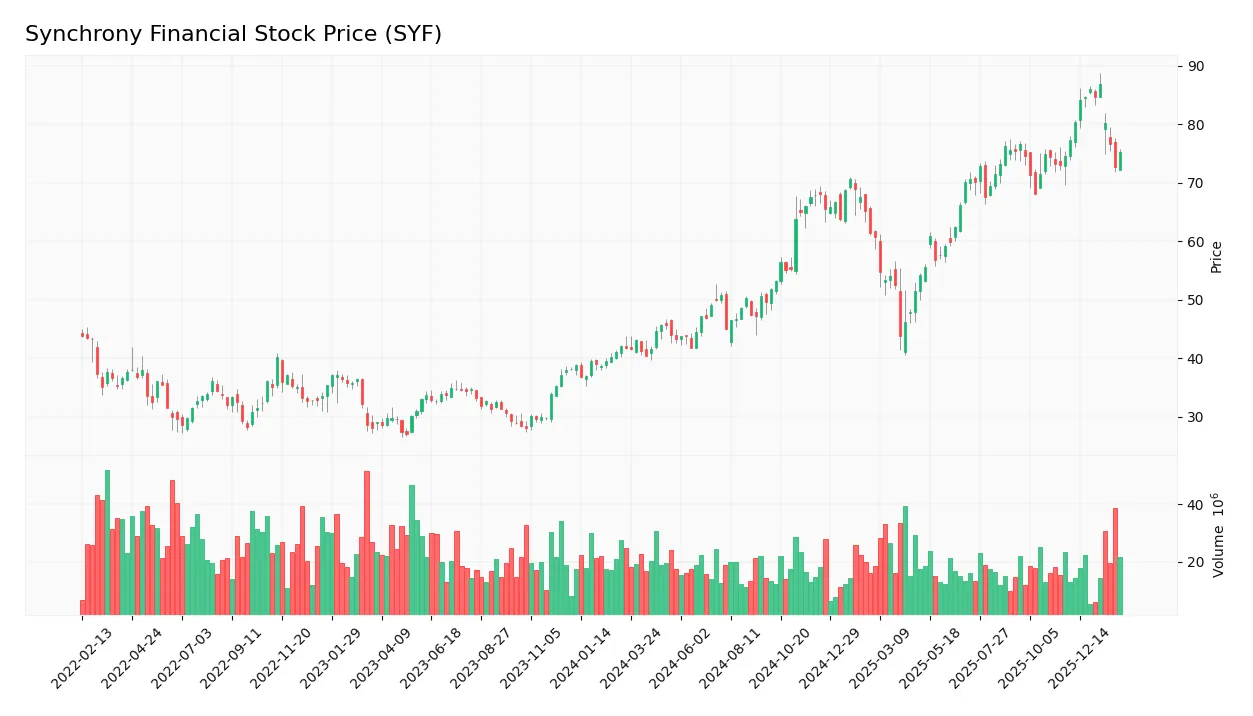
The weekly stock chart below illustrates Synchrony Financial’s price movement and key support and resistance levels over the past 12 months:
Trend Analysis
Over the past 12 months, Synchrony Financial’s stock price rose by 79.89%, indicating a strong bullish trend. The price ranged from a low of 40.41 to a high of 86.89, with volatility measured by a 12.88 standard deviation. However, recent months show a deceleration in momentum despite the overall upward trend.
Volume Analysis
Trading volume over the last three months shows a buyer-driven pattern, with buyers accounting for 58.15% of the activity. Volume is decreasing, suggesting waning market participation. This decline may indicate cautious investor sentiment despite continued buyer dominance.
Target Prices
Analysts set a solid target consensus for Synchrony Financial, reflecting cautious optimism.
| Target Low | Target High | Consensus |
|---|---|---|
| 81 | 100 | 90 |
The target range suggests moderate upside potential. Analysts expect steady performance aligned with industry trends.
Analyst & Consumer Opinions
This section reviews Synchrony Financial’s analyst grades and consumer feedback to assess market sentiment and reputation.

Don’t Let Luck Decide Your Entry Point
Optimize your entry points with our advanced ProRealTime indicators. You’ll get efficient buy signals with precise price targets for maximum performance. Start outperforming now!
Stock Grades
Here are the latest verified stock grades for Synchrony Financial from established analyst firms:
| Grading Company | Action | New Grade | Date |
|---|---|---|---|
| Truist Securities | Maintain | Hold | 2026-01-29 |
| BTIG | Maintain | Buy | 2026-01-28 |
| Barclays | Maintain | Overweight | 2026-01-28 |
| RBC Capital | Maintain | Sector Perform | 2026-01-28 |
| JP Morgan | Maintain | Neutral | 2026-01-28 |
| JP Morgan | Maintain | Neutral | 2026-01-12 |
| TD Cowen | Maintain | Buy | 2026-01-08 |
| Barclays | Maintain | Overweight | 2026-01-06 |
| Wells Fargo | Maintain | Overweight | 2026-01-05 |
| Keefe, Bruyette & Woods | Maintain | Outperform | 2026-01-02 |
The consensus shows a strong bias toward Buy and Overweight ratings, with most firms maintaining their positive outlook. Hold and Neutral grades suggest some caution, but outright Sell recommendations are notably absent.
Consumer Opinions
Consumer sentiment around Synchrony Financial reflects a mix of satisfaction and frustration, painting a nuanced picture of its service quality.
| Positive Reviews | Negative Reviews |
|---|---|
| “Great rewards program and cashback offers.” | “Customer service wait times are too long.” |
| “Easy-to-use mobile app enhances convenience.” | “High interest rates on some credit products.” |
| “Consistent and reliable billing processes.” | “Occasional technical glitches in online payments.” |
Overall, consumers praise Synchrony’s rewards and user-friendly digital tools. However, complaints about customer support delays and interest rates suggest areas needing improvement to bolster loyalty.
Risk Analysis
Below is a summary of key risks facing Synchrony Financial, highlighting their likelihood and potential impact:
| Category | Description | Probability | Impact |
|---|---|---|---|
| Financial Health | Altman Z-Score at 0.75 signals high bankruptcy risk, indicating financial distress. | High | Severe |
| Profitability | Negative ROIC (-91.64%) versus WACC (14.17%) shows poor capital efficiency and value erosion. | Medium | High |
| Liquidity | Current and quick ratios at zero warn of weak short-term liquidity, raising solvency concerns. | Medium | Moderate |
| Interest Burden | Interest coverage at 1.73 is low, risking difficulties meeting debt obligations in downturns. | Medium | High |
| Leverage | Debt-to-equity ratio near 0.91 reflects moderate leverage but with some financial risk. | Medium | Moderate |
| Market Volatility | Beta of 1.4 shows above-market volatility, exposing stock to amplified market swings. | High | Moderate |
The Altman Z-score places Synchrony deep in the distress zone, the most alarming factor. Despite a strong Piotroski score of 8, signaling operational strength, the poor ROIC and liquidity ratios raise red flags. Interest coverage is thin, increasing vulnerability to rising rates. These risks demand cautious portfolio exposure.
Should You Buy Synchrony Financial?
Synchrony Financial appears to be delivering robust profitability and operational efficiency, yet its competitive moat seems very unfavorable due to declining ROIC and value destruction. Despite a manageable leverage profile, the overall rating of A- suggests a cautiously favorable investment case.
Strength & Efficiency Pillars
Synchrony Financial posts robust operational margins, with a gross margin of 60.82% and an EBIT margin of 35.41%. Its net margin of 17.58% and return on equity (ROE) of 21.19% underscore efficient profitability. However, the return on invested capital (ROIC) stands at -91.64%, well below the weighted average cost of capital (WACC) of 14.17%, signaling value destruction rather than creation. While operational efficiency is strong, capital allocation remains a critical weakness.
Weaknesses and Drawbacks
The company is in financial distress, with an Altman Z-Score of 0.75 placing it firmly in the Distress Zone, indicating a high risk of bankruptcy. This solvency risk outweighs other metrics. Additional concerns include an unfavorable interest coverage ratio of 1.73 and zero current and quick ratios, reflecting liquidity strains. Though the price-to-earnings ratio is attractive at 8.41, the price-to-book ratio and debt-to-equity metrics are less favorable, suggesting valuation and leverage risks amid ongoing financial instability.
Our Final Verdict about Synchrony Financial
Despite operational strengths, Synchrony Financial’s distress-level Altman Z-Score signals serious solvency risk. This profile remains highly speculative and too risky for conservative capital. Investors might view the operational margins positively, but the looming bankruptcy risk overshadows these strengths and warrants extreme caution.
Disclaimer: This content is for informational purposes only and does not constitute financial, investment, or other professional advice. Investing in financial markets involves a significant risk of loss, and past performance is not indicative of future results.
Additional Resources
- Truist Lowers Synchrony Financial (SYF) PT to $84 Following Cautious Credit Outlook, Adjusted 2026 Guidance – Yahoo Finance (Feb 04, 2026)
- Principal Financial Group Inc. Grows Stock Position in Synchrony Financial $SYF – MarketBeat (Feb 06, 2026)
- Is There Still An Opportunity In Synchrony Financial (SYF) After Recent Share Price Pullback – simplywall.st (Feb 03, 2026)
- Price Over Earnings Overview: Synchrony Financial – Sahm (Feb 04, 2026)
- A Look At Synchrony Financial (SYF) Valuation After Q4 Earnings, Buyback Plan And Mixed 2026 Outlook – simplywall.st (Feb 01, 2026)
For more information about Synchrony Financial, please visit the official website: synchrony.com