Home > Analyses > Healthcare > GE HealthCare Technologies Inc.
GE HealthCare Technologies transforms patient care through cutting-edge imaging and diagnostic solutions that touch millions worldwide daily. It commands industry respect with its advanced MRI, CT, ultrasound, and molecular imaging products. The company’s reputation for innovation and comprehensive healthcare technology solutions drives global market influence. As GEHC evolves, I question whether its current fundamentals support its valuation and growth prospects in a rapidly advancing medical technology landscape.

Table of contents
Business Model & Company Overview
GE HealthCare Technologies Inc., founded in 2022 and headquartered in Chicago, IL, stands as a leader in the Medical – Healthcare Information Services sector. Its core business weaves together advanced imaging, ultrasound, patient care, and pharmaceutical diagnostics into a seamless ecosystem that supports patient diagnosis, treatment, and monitoring worldwide. With 53K employees, the company delivers critical healthcare innovations that span radiology to maternal care.
The company drives revenue through a balanced mix of hardware, consumables, and digital services across the Americas, Europe, and Asia. Its segments—Imaging, Ultrasound, Patient Care Solutions, and Pharmaceutical Diagnostics—combine product sales with recurring revenue from pharmaceuticals and digital monitoring solutions. This diversified model builds a robust economic moat, reinforcing GE HealthCare’s role in shaping the future of global medical technology.
Financial Performance & Fundamental Metrics
I analyze GE HealthCare Technologies Inc.’s income statement, key financial ratios, and dividend payout policy to assess its core financial health and shareholder value.
Income Statement
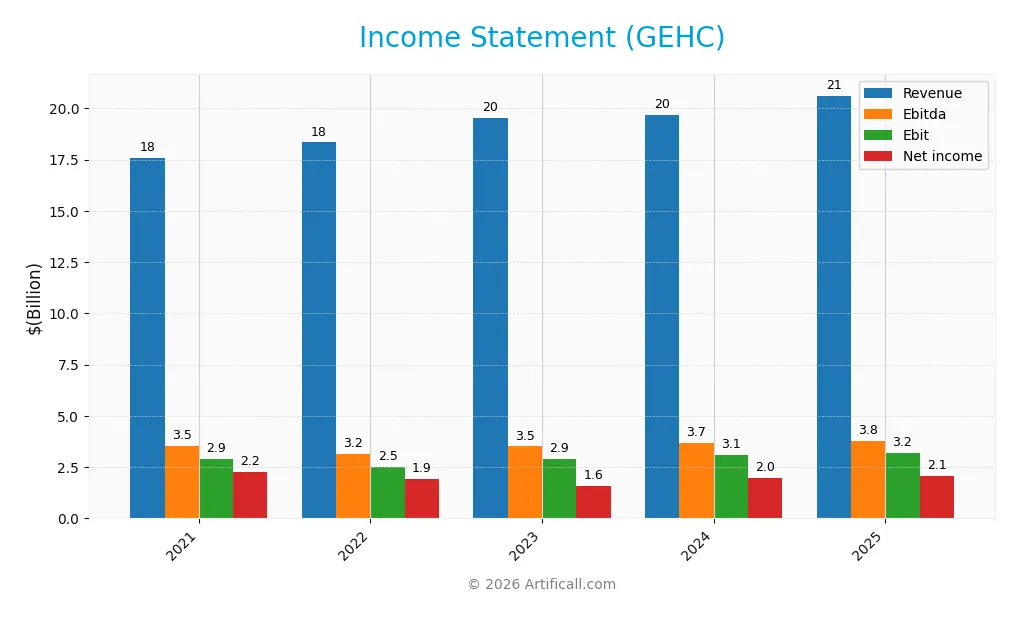
Below is the clear income statement overview for GE HealthCare Technologies Inc. over the last five fiscal years.
| 2021 | 2022 | 2023 | 2024 | 2025 | |
|---|---|---|---|---|---|
| Revenue | 17.6B | 18.3B | 19.6B | 19.7B | 20.6B |
| Cost of Revenue | 10.4B | 11.6B | 11.6B | 11.5B | 12.4B |
| Operating Expenses | 4.4B | 4.7B | 5.5B | 5.6B | 5.5B |
| Gross Profit | 7.2B | 7.2B | 7.9B | 8.2B | 8.2B |
| EBITDA | 3.5B | 3.2B | 3.5B | 3.7B | 3.8B |
| EBIT | 2.9B | 2.5B | 2.9B | 3.1B | 3.2B |
| Interest Expense | 40M | 86M | 542M | 505M | 450M |
| Net Income | 2.2B | 1.9B | 1.6B | 2.0B | 2.1B |
| EPS | 4.9 | 4.2 | 3.0 | 4.4 | 3.7 |
| Filing Date | 2021-12-31 | 2023-02-15 | 2024-02-06 | 2025-02-13 | 2026-02-04 |
Income Statement Evolution
GE HealthCare Technologies’ revenue increased steadily from 17.6B in 2021 to 20.6B in 2025, marking a 17.3% growth over five years. However, net income declined by 7.3% during the same period, pressured by shrinking net margins. Gross margins remained stable near 40%, while EBIT margins hovered around 15.5%, signaling consistent operational efficiency.
Is the Income Statement Favorable?
In 2025, fundamentals show a generally favorable profile. The company posted a 10.1% net margin and maintained a low interest expense ratio of 2.18%. Revenue growth of 4.8% was neutral, yet net income and EPS declined slightly, highlighting margin compression risks. Operating expenses grew in line with revenue, supporting controlled cost management despite margin headwinds.
Financial Ratios
The table below presents key financial ratios for GE HealthCare Technologies Inc. from 2021 to 2025, illustrating profitability, liquidity, leverage, and valuation metrics:
| Ratios | 2021 | 2022 | 2023 | 2024 | 2025 |
|---|---|---|---|---|---|
| Net Margin | 12.78% | 10.45% | 8.02% | 10.13% | 8.57% |
| ROE | 13.49% | 20.48% | 21.98% | 23.59% | 16.19% |
| ROIC | 11.25% | 9.56% | 6.79% | 8.29% | 8.46% |
| P/E | 12.14 | 13.83 | 22.44 | 17.89 | 22.29 |
| P/B | 1.64 | 2.83 | 4.93 | 4.22 | 3.61 |
| Current Ratio | 0.97 | 1.09 | 1.00 | 1.00 | 1.18 |
| Quick Ratio | 0.68 | 0.79 | 0.78 | 0.79 | 0.93 |
| D/E | 0.03 | 0.92 | 1.38 | 1.11 | 0.96 |
| Debt-to-Assets | 1.66% | 31.36% | 30.39% | 28.34% | 27.10% |
| Interest Coverage | 69.88 | 29.33 | 4.49 | 5.20 | 5.78 |
| Asset Turnover | 0.67 | 0.67 | 0.60 | 0.59 | 0.53 |
| Fixed Asset Turnover | 7.87 | 7.93 | 7.82 | 7.71 | 6.34 |
| Dividend Yield | 0.00% | 0.00% | 0.12% | 0.15% | 0.17% |
Evolution of Financial Ratios
Return on Equity (ROE) improved from 13.49% in 2021 to 16.19% in 2025, signaling stronger profitability. The Current Ratio trended upward, rising from 0.97 to 1.18, indicating improving liquidity. Debt-to-Equity Ratio declined from 1.38 in 2023 to 0.96 in 2025, reflecting reduced financial leverage and enhanced balance sheet stability.
Are the Financial Ratios Fovorable?
In 2025, profitability is neutral with an 8.57% net margin but favorable ROE at 16.19%, slightly above the WACC of 8.33%. Liquidity ratios are neutral; the Current Ratio sits at 1.18, and the Quick Ratio at 0.93. Leverage is balanced with a Debt-to-Equity of 0.96 and favorable interest coverage of 7.13. Valuation metrics show mixed signals: an unfavorable Price-to-Book at 3.61 and dividend yield at 0.17% contrast with a neutral Price-to-Earnings of 22.29.
Shareholder Return Policy
GE HealthCare Technologies Inc. pays a modest dividend, with a payout ratio around 3-4% and a dividend yield near 0.17% in 2025. The dividend per share has grown steadily, supported by free cash flow coverage exceeding 75%. The company also engages in share buybacks.
This balanced approach of dividends and repurchases aligns with sustainable long-term value creation. The low payout ratio mitigates risks linked to unsustainable distributions, while buybacks offer flexibility in capital allocation. Overall, the policy suggests prudent shareholder returns consistent with financial health.
Score analysis
The radar chart below summarizes the key valuation and financial health scores for GE HealthCare Technologies Inc.:
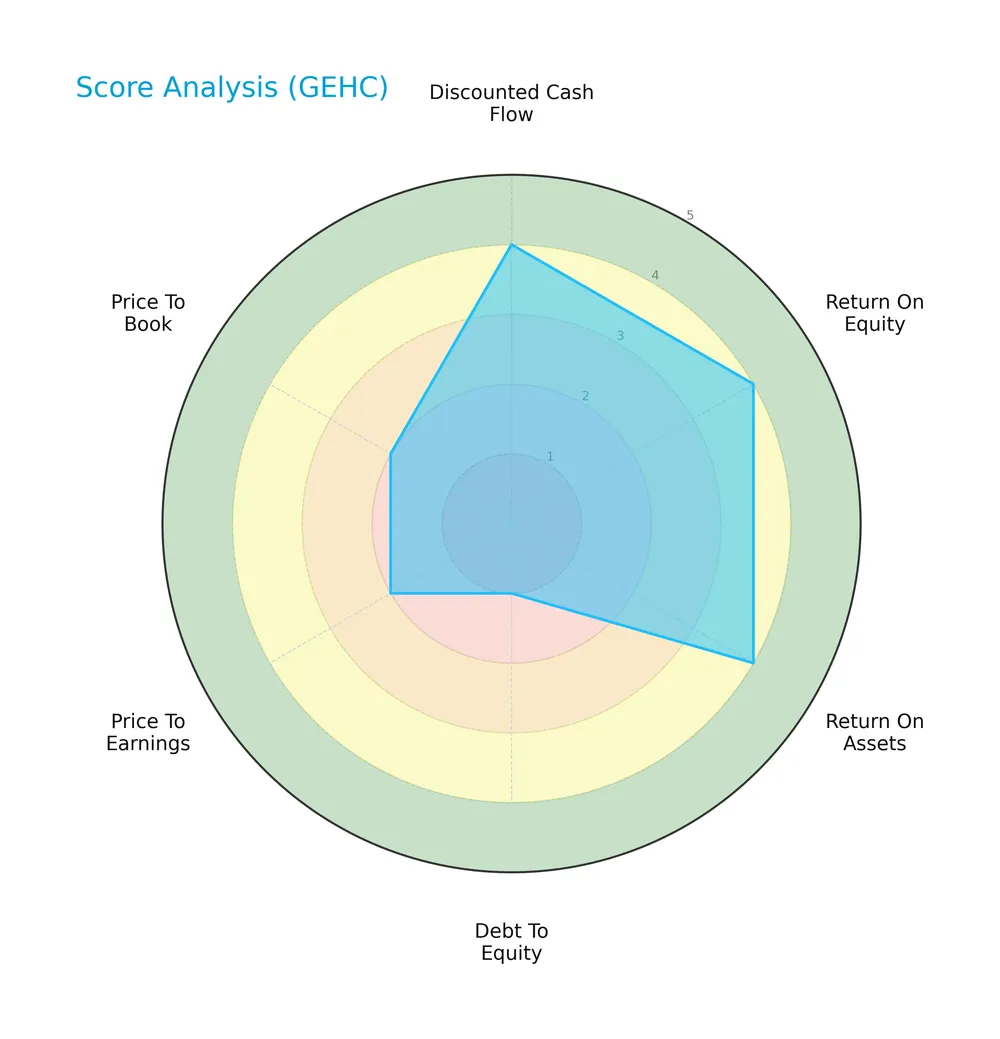
GEHC shows strong fundamentals with favorable scores in discounted cash flow, ROE, and ROA, all at 4. However, its debt-to-equity score is very unfavorable at 1, indicating leverage concerns. Valuation multiples remain moderate with P/E and P/B scores at 2.
Analysis of the company’s bankruptcy risk
The Altman Z-Score places GEHC in the grey zone, suggesting a moderate risk of financial distress and bankruptcy:

Is the company in good financial health?
The Piotroski Score diagram highlights GEHC’s strong financial health, scoring 7 out of 9:

A score of 7 indicates robust profitability, liquidity, and efficiency, supporting the company’s overall solid financial condition despite some leverage concerns.
Competitive Landscape & Sector Positioning
This analysis explores GE HealthCare Technologies Inc.’s strategic positioning, revenue streams, and product portfolio. I will assess whether GEHC holds a competitive advantage within its healthcare information services industry.
Strategic Positioning
GE HealthCare Technologies Inc. maintains a diversified product portfolio across four key segments: Imaging, Patient Care Solutions, Pharmaceutical Diagnostics, and Ultrasound. Geographically, it balances significant revenue streams from the United States, China, and other international markets, reflecting broad global exposure.
Revenue by Segment
This pie chart illustrates GE HealthCare Technologies Inc.’s revenue distribution by segment for fiscal year 2025, highlighting the relative size of each business unit.
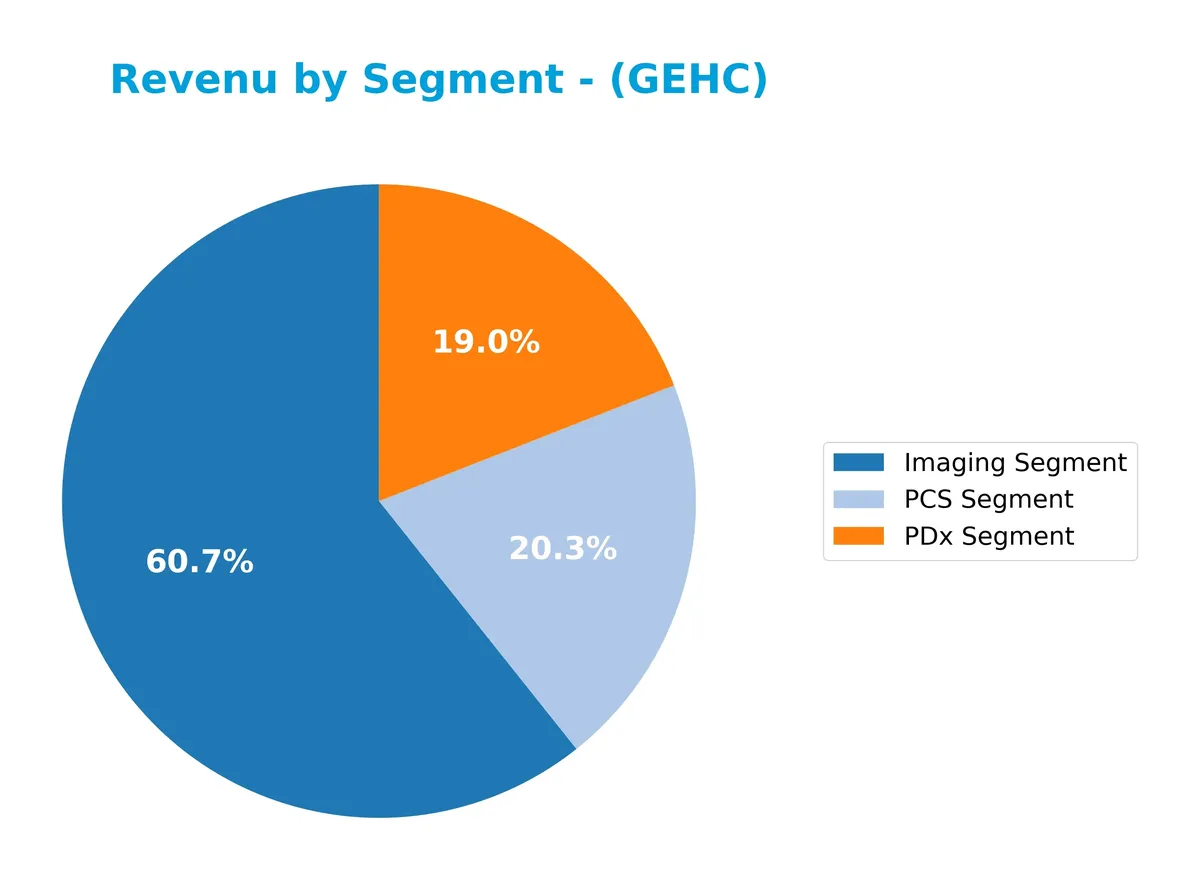
In 2025, the Imaging Segment remains the dominant revenue driver at 9.2B, though it shows a modest decline from 10.6B in 2023. PCS and PDx segments contributed 3.1B and 2.9B respectively, with PDx accelerating notably from 2.3B in 2023. The absence of the Ultrasound segment in 2024-25 suggests strategic shifts or reclassification, concentrating revenue more heavily in Imaging and diagnostic solutions.
Key Products & Brands
The table below summarizes GE HealthCare Technologies Inc.’s key products and brands by business segment:
| Product | Description |
|---|---|
| Imaging Segment | Offers molecular imaging, CT, MR, image-guided therapy, X-ray systems, and women’s health products. |
| Ultrasound Segment | Provides screening, diagnosis, treatment, and monitoring via radiology, primary care, cardiovascular, and handheld ultrasound. |
| Patient Care Solutions | Supplies medical devices, consumables, and digital solutions for patient monitoring, anesthesia, respiratory care, and cardiology. |
| Pharmaceutical Diagnostics | Delivers diagnostic agents and contrast media for CT, angiography, MR, nuclear medicine, and molecular imaging agents. |
GE HealthCare’s portfolio spans advanced imaging technologies and patient care devices. It combines hardware with digital solutions and diagnostic pharmaceuticals, reflecting a diversified approach to healthcare technology.
Main Competitors
There are 2 competitors in total; the table below lists the top 10 leaders by market capitalization:
| Competitor | Market Cap. |
|---|---|
| GE HealthCare Technologies Inc. | 37.8B |
| Tempus AI, Inc. | 10.1B |
GE HealthCare Technologies Inc. ranks 1st among its 2 competitors. Its market cap is 99.21% of the top player, effectively making it the leader. The company trades above both the average market cap of the top 10 (24B) and the median sector capitalization (24B). It holds a significant gap from Tempus AI, its nearest competitor, with a market cap difference of over 270%.
Comparisons with competitors
Check out how we compare the company to its competitors:
Does GEHC have a competitive advantage?
GE HealthCare Technologies Inc. currently lacks a clear competitive advantage, as it has a declining ROIC and is shedding value relative to its cost of capital. Its profitability trends downward, signaling challenges in sustaining economic profits over time.
Looking ahead, GEHC’s diverse product portfolio in imaging, ultrasound, patient care, and pharmaceutical diagnostics supports expansion into multiple global markets. Continued innovation and digital solution integration offer growth opportunities across the U.S., China, and other international regions.
SWOT Analysis
This SWOT analysis highlights GE HealthCare Technologies Inc.’s core strengths, weaknesses, opportunities, and threats to inform strategic decisions.
Strengths
- Diverse global footprint
- Strong brand in medical imaging
- Favorable EBIT margin of 15.55%
Weaknesses
- Declining ROIC trend
- Negative EPS growth over 5 years
- Moderate liquidity ratios
Opportunities
- Expansion in emerging markets
- Growth in digital health solutions
- Increasing demand for diagnostic imaging
Threats
- Intense competition in healthcare tech
- Regulatory risks globally
- Currency and geopolitical exposure
GE HealthCare’s strong brand and diverse segments provide solid footing. However, declining profitability and EPS call for cautious capital allocation. Growth hinges on innovation and emerging markets, but regulatory and competitive pressures remain critical risks.
Stock Price Action Analysis
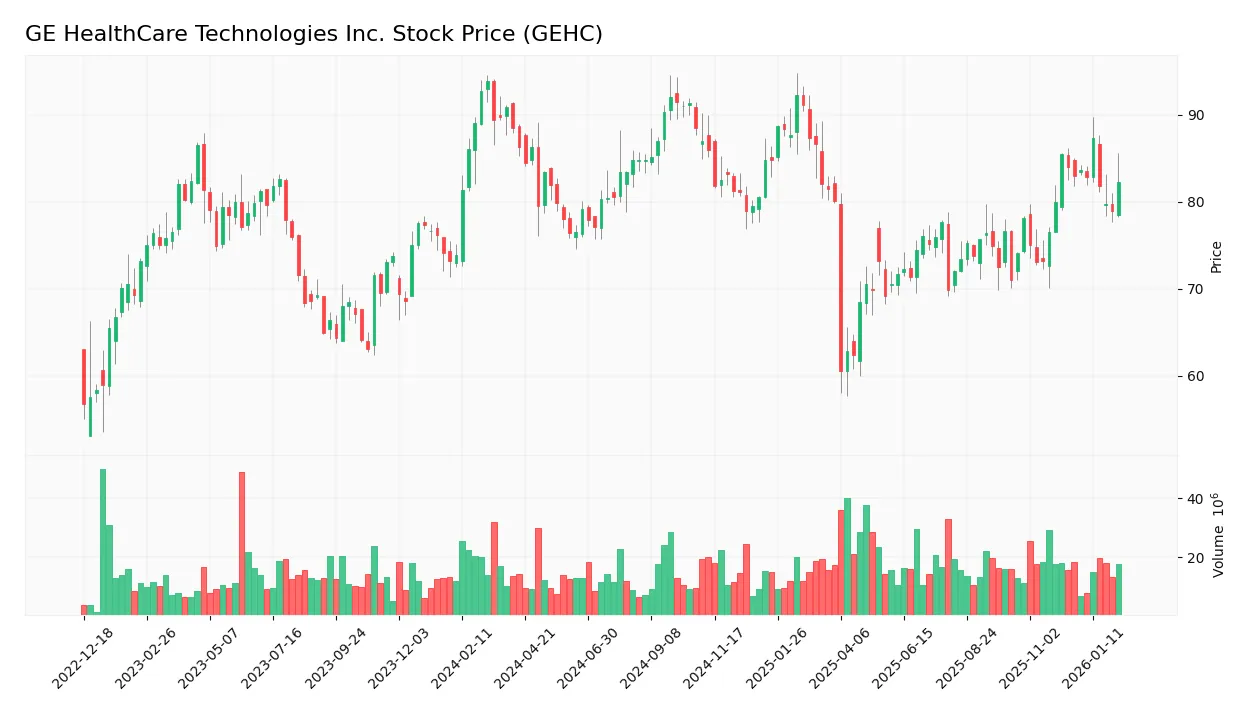
The following weekly chart illustrates GE HealthCare Technologies Inc.’s stock price movement over the past 12 months:
Trend Analysis
Over the past 12 months, GEHC’s stock declined by 8.04%, confirming a bearish trend with accelerating downward momentum. The price ranged between 60.51 and 92.21, showing significant volatility with a 6.92 standard deviation. Recent months reversed slightly with a 7.55% gain, indicating a nascent recovery phase.
Volume Analysis
Trading volume has increased, with buyers accounting for 52.1% of total activity, signaling balanced but slightly buyer-driven participation. In the recent three-month span, buyer dominance remains neutral at 52.82%, reflecting cautious optimism without strong directional conviction among investors.
Target Prices
Analysts present a moderately optimistic target consensus for GE HealthCare Technologies Inc.
| Target Low | Target High | Consensus |
|---|---|---|
| 77 | 105 | 91.6 |
The target range suggests upside potential from current levels, with consensus signaling steady confidence in the stock’s prospects.

Don’t Let Luck Decide Your Entry Point
Optimize your entry points with our advanced ProRealTime indicators. You’ll get efficient buy signals with precise price targets for maximum performance. Start outperforming now!
Analyst & Consumer Opinions
This section examines the latest analyst ratings and consumer feedback related to GE HealthCare Technologies Inc. (GEHC).
Stock Grades
Here are the latest verified grades for GE HealthCare Technologies Inc. from major financial institutions:
| Grading Company | Action | New Grade | Date |
|---|---|---|---|
| Wells Fargo | Maintain | Overweight | 2026-02-05 |
| Morgan Stanley | Maintain | Equal Weight | 2026-02-05 |
| Evercore ISI Group | Maintain | Outperform | 2026-02-05 |
| Stifel | Maintain | Buy | 2026-02-05 |
| BTIG | Maintain | Buy | 2026-02-04 |
| Piper Sandler | Maintain | Overweight | 2026-01-30 |
| UBS | Downgrade | Sell | 2026-01-15 |
| Stifel | Maintain | Buy | 2026-01-07 |
| B of A Securities | Maintain | Neutral | 2026-01-05 |
| Jefferies | Maintain | Buy | 2025-12-11 |
The consensus leans strongly toward a Buy rating, with most firms maintaining positive outlooks. UBS’s recent downgrade to Sell stands out as a notable exception amid broad investor confidence.
Consumer Opinions
Consumers express mixed sentiments about GE HealthCare Technologies Inc., reflecting both strong product reliability and concerns about customer service.
| Positive Reviews | Negative Reviews |
|---|---|
| “GEHC’s medical imaging devices deliver clear, consistent results.” | “Customer support response times are often slow and frustrating.” |
| “The technology integration in their equipment improves workflow efficiency.” | “High maintenance costs reduce overall value.” |
| “Their innovative approach keeps GEHC ahead in healthcare tech.” | “Software updates sometimes cause compatibility issues.” |
Overall, users praise GEHC for its cutting-edge technology and reliable imaging quality. However, recurring complaints focus on service delays and maintenance expenses, suggesting areas for operational improvement.
Risk Analysis
Below is a detailed table outlining the key risks facing GE HealthCare Technologies Inc. as of 2026:
| Category | Description | Probability | Impact |
|---|---|---|---|
| Market Volatility | GEHC’s beta of 1.23 indicates above-average sensitivity to market swings, increasing share price volatility. | High | Medium |
| Leverage Risk | Debt-to-equity stands near 1.0, signaling elevated leverage and potential liquidity strain. | Medium | High |
| Valuation Concerns | Price-to-book ratio at 3.61 is unfavorable, suggesting possible overvaluation risk. | Medium | Medium |
| Dividend Yield | Low dividend yield of 0.17% may disappoint income-focused investors, affecting demand. | Low | Low |
| Financial Distress | Altman Z-Score of 1.88 places GEHC in the “grey zone,” indicating moderate bankruptcy risk. | Medium | High |
| Operational Risks | Exposure to global healthcare regulations and supply chain disruptions could impair growth. | Medium | Medium |
The most concerning risks are the moderate bankruptcy risk flagged by the Altman Z-Score and the high leverage level. These factors warrant careful monitoring, especially given recent global healthcare supply chain challenges. While valuation appears stretched, profitability metrics remain stable, supporting a cautiously optimistic outlook.
Should You Buy GE HealthCare Technologies Inc.?
GE HealthCare Technologies appears to be a moderately profitable company with declining operational efficiency and a slightly unfavorable moat, as it sheds value. Despite a manageable leverage profile, its debt metrics raise caution. The overall B rating suggests a very favorable but cautiously balanced investment profile.
Strength & Efficiency Pillars
GE HealthCare Technologies Inc. exhibits solid profitability, with a return on equity (ROE) of 16.19% and a net margin of 8.57%, reflecting efficient operations. Its Altman Z-score of 1.88 places it in the grey zone, indicating moderate financial risk but not distress. The Piotroski score of 7 supports strong financial health. Although the return on invested capital (ROIC) at 8.46% slightly exceeds the weighted average cost of capital (WACC) of 8.33%, the margin is narrow, suggesting limited value creation. Financial leverage remains moderate with a debt-to-assets ratio of 27.1%.
Weaknesses and Drawbacks
Several red flags temper the investment case. The price-to-book ratio of 3.61 signals an elevated valuation relative to book value, which might deter value-focused investors. The current ratio of 1.18 and quick ratio of 0.93 indicate only modest liquidity buffers, raising caution about short-term obligations. The stock has faced an 8.04% price decline overall, with a bearish trend dominating, reflecting market pressure. Additionally, the dividend yield is low at 0.17%, offering limited income appeal. The debt-to-equity score remains neutral but warrants monitoring given the financial structure.
Our Verdict about GE HealthCare Technologies Inc.
The company’s fundamental profile appears moderately favorable, supported by consistent profitability and strong financial scores. Despite a bearish overall trend and recent market pressure, buyer dominance in the latest period hints at cautious optimism. Given the narrow ROIC-WACC spread and valuation concerns, the stock might suggest a wait-and-see approach for a better entry point. Long-term investors could find appeal if the company reverses its profitability decline and strengthens its value creation.
Disclaimer: This content is for informational purposes only and does not constitute financial, investment, or other professional advice. Investing in financial markets involves a significant risk of loss, and past performance is not indicative of future results.
Additional Resources
- GE HealthCare Technologies Pops, And The Upside Isn’t Over Yet (NASDAQ:GEHC) – Seeking Alpha (Feb 05, 2026)
- GE HealthCare Technologies Inc. (GEHC) Shares Rise as Robust 2026 Outlook Offsets Tariff-Driven Margin Squeeze – AlphaStreet (Feb 05, 2026)
- Is GE HealthCare Technologies (GEHC) Offering Value After Recent Share Price Weakness – Yahoo Finance (Feb 05, 2026)
- Decoding GE HealthCare Technologies Inc (GEHC): A Strategic SWOT Insight – GuruFocus (Feb 05, 2026)
- GE HealthCare Technologies Inc. (NASDAQ:GEHC) Q4 2025 Earnings Call Transcript – Insider Monkey (Feb 05, 2026)
For more information about GE HealthCare Technologies Inc., please visit the official website: gehealthcare.com