Home > Analyses > Industrials > RTX Corporation
RTX Corporation powers the aerospace and defense landscape with cutting-edge technologies that protect and connect millions worldwide. Its three pillars—Collins Aerospace, Pratt & Whitney, and Raytheon—drive innovation in aircraft systems, engines, and advanced threat detection. Renowned for quality and scale, RTX shapes military and commercial aviation alike. As geopolitical tensions and technological demands evolve, I ask: does RTX’s robust foundation still justify its premium valuation and growth outlook?
Table of contents
Business Model & Company Overview
RTX Corporation, founded in 1934 and headquartered in Arlington, Virginia, stands as a dominant aerospace and defense powerhouse. It integrates three major segments—Collins Aerospace, Pratt & Whitney, and Raytheon—into a cohesive ecosystem serving commercial, military, and government clients worldwide. This alignment delivers comprehensive solutions from aircraft systems to threat detection, underscoring its core mission to advance aerospace technology and defense capabilities.
The company’s revenue engine balances product sales with a robust aftermarket services portfolio that ensures recurring income. Collins Aerospace focuses on aerospace systems and support, Pratt & Whitney drives value through aircraft engines and power units, while Raytheon leads in defense technologies. RTX’s strategic presence spans the Americas, Europe, and Asia, reinforcing its global footprint. Its economic moat lies in its integrated capabilities and entrenched relationships shaping the future of aerospace and defense.
Financial Performance & Fundamental Metrics
I analyze RTX Corporation’s income statement, key financial ratios, and dividend payout policy to reveal its core profitability and shareholder value dynamics.
Income Statement
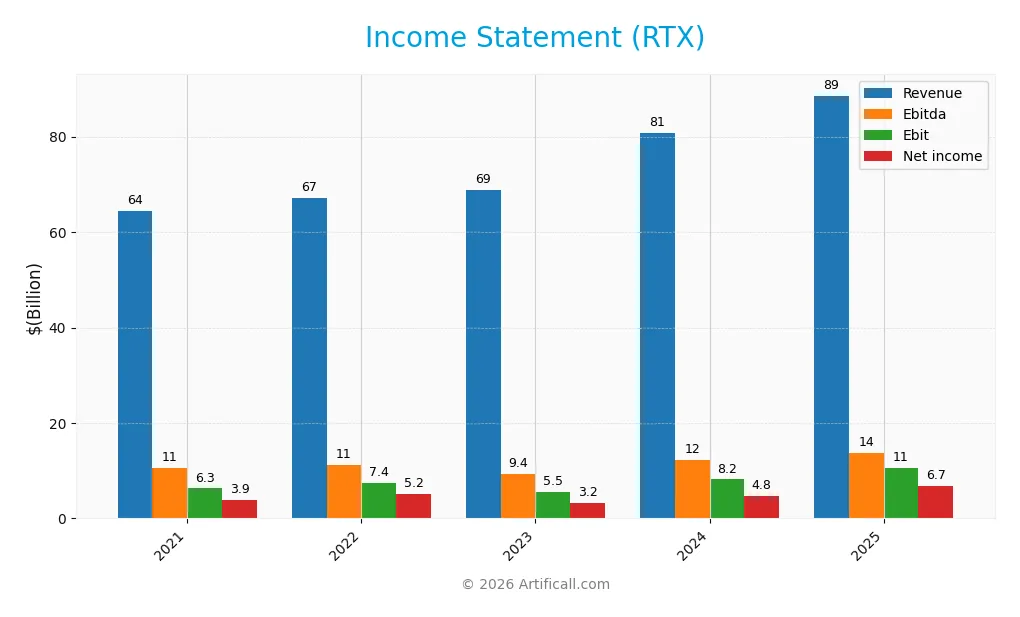
This table summarizes RTX Corporation’s annual income statement figures from 2021 to 2025, showing key profitability and expense metrics in USD.
| 2021 | 2022 | 2023 | 2024 | 2025 | |
|---|---|---|---|---|---|
| Revenue | 64.36B | 67.07B | 68.92B | 80.74B | 88.60B |
| Cost of Revenue | 51.86B | 53.41B | 56.83B | 65.33B | 70.81B |
| Operating Expenses | 7.83B | 8.28B | 8.61B | 8.74B | 8.90B |
| Gross Profit | 12.50B | 13.67B | 12.09B | 15.41B | 17.79B |
| EBITDA | 10.56B | 11.17B | 9.37B | 12.16B | 13.78B |
| EBIT | 6.29B | 7.42B | 5.49B | 8.16B | 10.56B |
| Interest Expense | 1.33B | 1.30B | 1.65B | 1.97B | 1.83B |
| Net Income | 3.86B | 5.20B | 3.20B | 4.77B | 6.73B |
| EPS | 2.57 | 3.52 | 2.24 | 3.58 | 5.03 |
| Filing Date | 2022-02-11 | 2023-02-07 | 2024-02-05 | 2025-02-03 | 2026-01-27 |
Income Statement Evolution
RTX Corporation’s revenue grew steadily from $64.4B in 2021 to $88.6B in 2025, a 37.7% increase. Net income expanded even faster, rising 74.2% over the same period, reflecting improved operational efficiency. Margins strengthened, with gross margin reaching 20.1% and net margin 7.6%, signaling better cost control and profitability.
Is the Income Statement Favorable?
In 2025, RTX posted $88.6B revenue and $6.7B net income, showing solid top- and bottom-line expansion. The EBIT margin hit 11.9%, supported by manageable interest expenses at 2.1% of revenue. Earnings per share surged nearly 40% year-over-year. These fundamentals indicate a robust income statement with favorable growth and margin trends.
Financial Ratios
This table summarizes key financial ratios for RTX Corporation over the last five fiscal years to assist in performance comparison and trend analysis:
| Ratios | 2021 | 2022 | 2023 | 2024 | 2025 |
|---|---|---|---|---|---|
| Net Margin | 6.0% | 7.7% | 4.6% | 5.9% | 7.6% |
| ROE | 5.3% | 7.2% | 5.3% | 7.9% | 10.3% |
| ROIC | 3.1% | 3.9% | 2.6% | 4.7% | 6.2% |
| P/E | 33.4 | 28.7 | 37.6 | 32.3 | 36.6 |
| P/B | 1.77 | 2.05 | 2.01 | 2.56 | 3.78 |
| Current Ratio | 1.19 | 1.09 | 1.04 | 0.99 | 1.03 |
| Quick Ratio | 0.93 | 0.81 | 0.78 | 0.74 | 0.80 |
| D/E | 0.45 | 0.46 | 0.76 | 0.71 | 0.63 |
| Debt-to-Assets | 20.5% | 21.1% | 27.9% | 26.3% | 24.0% |
| Interest Coverage | 3.5 | 4.1 | 2.1 | 3.4 | 4.9 |
| Asset Turnover | 0.40 | 0.42 | 0.43 | 0.50 | 0.52 |
| Fixed Asset Turnover | 3.80 | 3.95 | 3.96 | 4.50 | 4.72 |
| Dividend Yield | 2.3% | 2.1% | 2.7% | 2.1% | 1.4% |
Evolution of Financial Ratios
Return on Equity (ROE) improved steadily from 5.3% in 2023 to 10.3% in 2025, reflecting enhanced profitability. The Current Ratio remained stable around 1.0, indicating consistent liquidity. Debt-to-Equity Ratio declined from 0.76 in 2023 to 0.63 in 2025, signaling a moderate reduction in leverage and improved financial stability.
Are the Financial Ratios Favorable?
Profitability ratios such as net margin (7.6%) and ROE (10.3%) are neutral, suggesting moderate efficiency. Liquidity metrics show a neutral current ratio (1.03) but an unfavorable quick ratio (0.8), hinting at limited liquid assets. Leverage ratios are mostly favorable, with debt-to-assets at 24% and interest coverage strong at 5.77. Market valuation ratios like P/E (36.6) and P/B (3.78) appear unfavorable. Overall, the financial ratios are slightly favorable.
Shareholder Return Policy
RTX Corporation maintains a dividend payout ratio around 53%, with a steady rise in dividends per share reaching $2.66 in 2025. The annual yield hovers near 1.45%, supported by share buybacks, and dividends remain covered by free cash flow, reflecting disciplined capital allocation.
This balanced approach supports sustainable shareholder returns without straining cash flows or leverage. The company’s dividend and repurchase policies align with prudent long-term value creation, avoiding excessive distributions amid moderate profitability and stable operating cash flow.
Score analysis
The following radar chart displays key financial scores that reflect RTX Corporation’s valuation and profitability metrics:
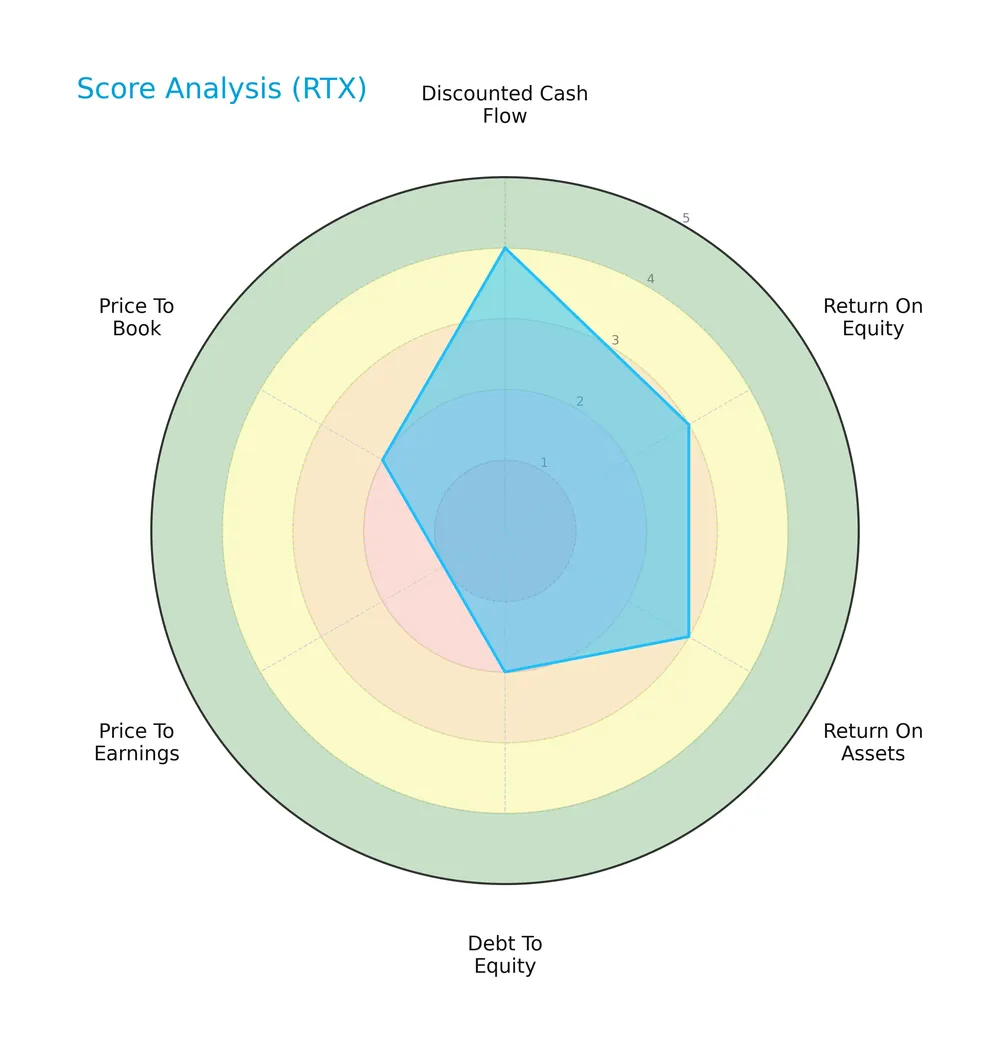
RTX shows a favorable discounted cash flow score of 4, indicating solid intrinsic value. Return on equity and assets scores are moderate at 3 each, reflecting average profitability. Debt-to-equity and price-to-book scores are moderate, while the price-to-earnings score is very unfavorable at 1, suggesting valuation concerns.
Analysis of the company’s bankruptcy risk
RTX’s Altman Z-Score places it in the grey zone, indicating a moderate risk of bankruptcy and financial caution is warranted:

Is the company in good financial health?
The Piotroski Score chart offers insight into RTX’s financial strength based on profitability, leverage, and efficiency metrics:
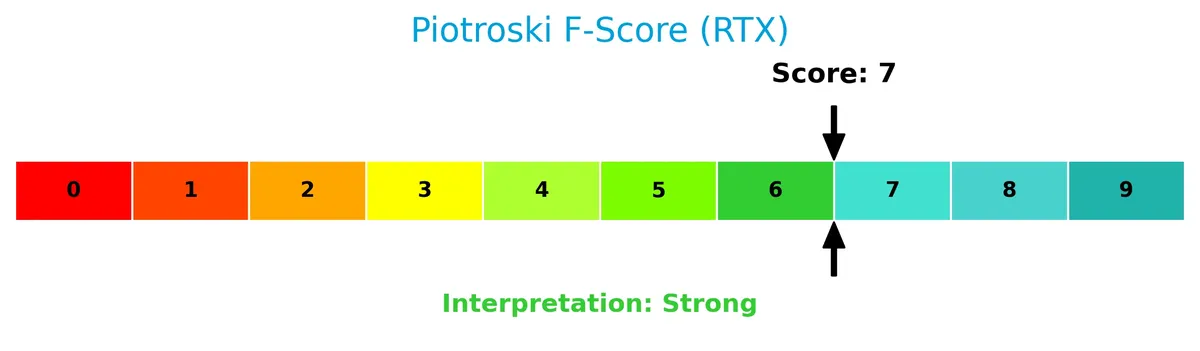
With a strong Piotroski Score of 7, RTX demonstrates solid financial health, signaling effective management and operational stability despite some market valuation challenges.
Competitive Landscape & Sector Positioning
This section examines RTX Corporation’s strategic positioning, revenue segments, key products, and competitors. I will assess whether RTX holds a competitive advantage over its rivals.
Strategic Positioning
RTX Corporation maintains a diversified portfolio across aerospace and defense, with three balanced segments generating roughly $28B each in 2024. Geographically, it concentrates heavily in the U.S. market with $46B revenue but sustains significant exposure in Europe ($16B) and Asia Pacific ($11B), reflecting broad international reach.
Revenue by Segment
This pie chart illustrates RTX Corporation’s revenue distribution across its major business segments for the fiscal year 2024.
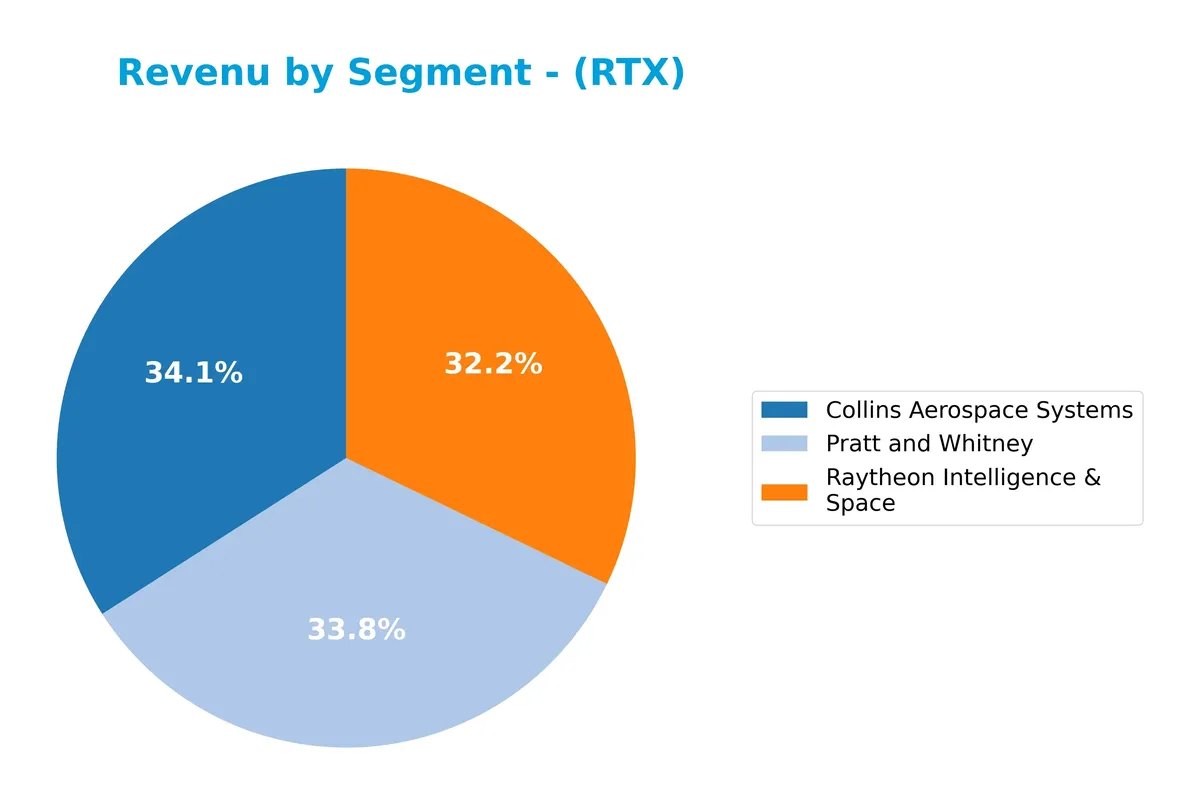
In 2024, Collins Aerospace Systems leads with $28.3B, closely followed by Pratt and Whitney at $28.1B and Raytheon Intelligence & Space at $26.7B. Collins Aerospace and Pratt and Whitney have shown strong growth since 2023, signaling a shift towards aerospace propulsion and systems. Raytheon’s slight decline suggests potential concentration risks in defense intelligence, but the segment remains a core revenue pillar.
Key Products & Brands
The table below summarizes RTX Corporation’s primary products and brands with their descriptions:
| Product | Description |
|---|---|
| Collins Aerospace Systems | Aerospace and defense products plus aftermarket services for civil, military, and commercial aircraft, including cabin interiors. |
| Pratt and Whitney | Manufacturer of aircraft engines for commercial, military, business jets, and general aviation, including auxiliary power units. |
| Raytheon Intelligence & Space | Defensive and offensive threat detection, tracking, and mitigation systems for government and commercial clients. |
RTX Corporation operates through three main segments, each addressing specific aerospace and defense market needs. Collins Aerospace focuses on aircraft systems and services. Pratt and Whitney specializes in propulsion technologies. Raytheon Intelligence & Space delivers advanced defense solutions.
Main Competitors
There are 12 competitors in total, with the table listing the top 10 leaders by market capitalization:
| Competitor | Market Cap. |
|---|---|
| GE Aerospace | 338B |
| RTX Corporation | 251B |
| The Boeing Company | 171B |
| Lockheed Martin Corporation | 116B |
| General Dynamics Corporation | 93B |
| Northrop Grumman Corporation | 84B |
| TransDigm Group Incorporated | 77B |
| L3Harris Technologies, Inc. | 57B |
| Axon Enterprise, Inc. | 44B |
| BWX Technologies, Inc. | 17B |
RTX Corporation ranks 2nd among its 12 competitors with a market cap 77.7% the size of the leader, GE Aerospace. It stands above both the average market cap of the top 10 competitors (125B) and the sector median (80B). RTX holds a 28.8% premium over its closest rival, Boeing, highlighting a solid competitive position.
Comparisons with competitors
Check out how we compare the company to its competitors:
Does RTX have a competitive advantage?
RTX Corporation currently does not demonstrate a clear competitive advantage, as its ROIC remains below its WACC, indicating value is being shed despite growing profitability. The company shows a slightly favorable moat status, reflecting improving returns on invested capital but insufficient to confirm a durable edge.
Looking ahead, RTX benefits from its diversified aerospace and defense segments, including Collins Aerospace, Pratt & Whitney, and Raytheon. Expanding international markets and ongoing investments in advanced aerospace technologies present opportunities for growth and potential enhancement of its competitive positioning.
SWOT Analysis
This SWOT analysis highlights RTX Corporation’s core competitive position and strategic challenges.
Strengths
- diversified aerospace & defense portfolio
- strong revenue growth (38% over 5 years)
- favorable operating margins (~12%)
Weaknesses
- high P/E ratio (36.6) indicating premium valuation
- quick ratio below 1 signals liquidity pressure
- ROIC below WACC, shedding value currently
Opportunities
- expansion in global defense spending
- growth in commercial aerospace aftermarket
- innovation in advanced aerospace technologies
Threats
- geopolitical risks affecting defense contracts
- supply chain disruptions
- intense competition from peers
RTX demonstrates solid growth and operational strength but faces valuation and liquidity concerns. Its strategy should balance innovation and financial discipline to sustain competitive advantage amid global uncertainties.
Stock Price Action Analysis
The weekly stock chart below illustrates RTX Corporation’s price movements over the past 12 months:
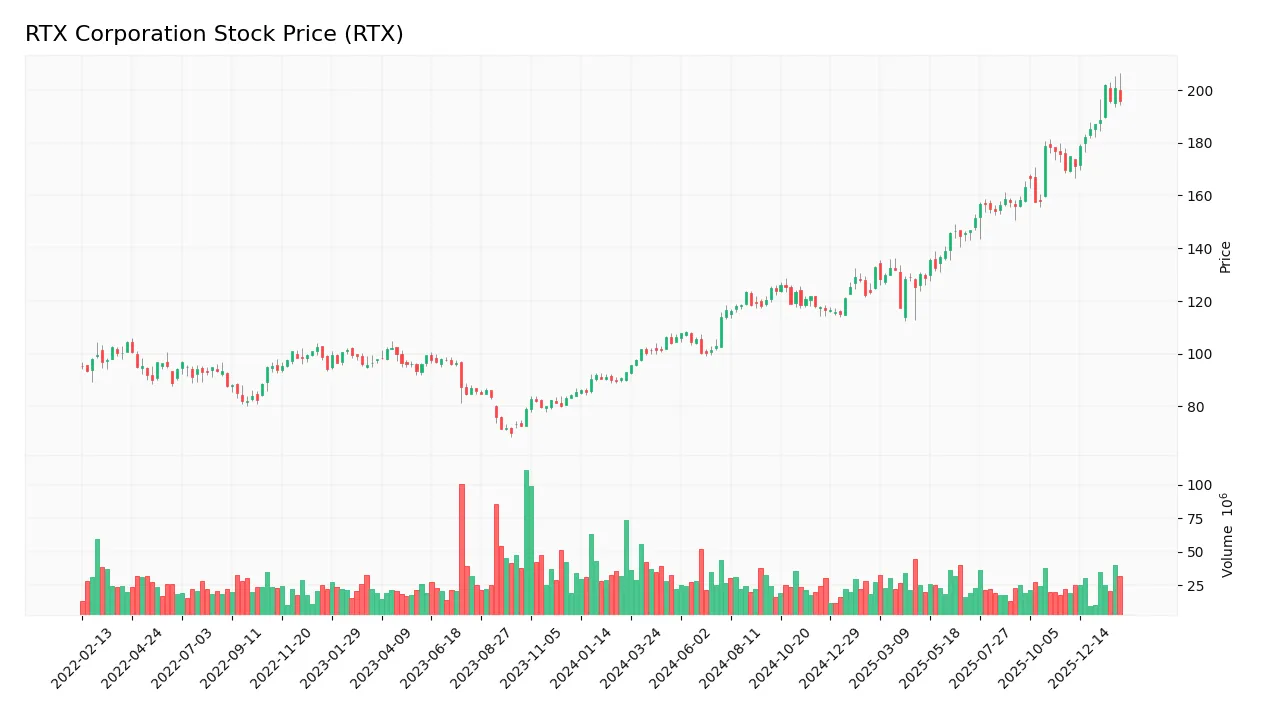
Trend Analysis
RTX stock gained 110.88% over the past year, indicating a strong bullish trend with accelerating momentum. Price volatility is notable with a 27.61 standard deviation. The stock ranged between 92.93 and 201.92, confirming robust upward dynamics.
Volume Analysis
Over the last three months, trading volume decreased despite buyer dominance at 66.1%. This suggests cautious but confident participation, with buyers controlling market direction amid lower overall activity.
Target Prices
Analysts set a confident target consensus for RTX Corporation, reflecting strong growth expectations.
| Target Low | Target High | Consensus |
|---|---|---|
| 168 | 235 | 214.7 |
The target range from 168 to 235 indicates a bullish outlook. The consensus price of 214.7 suggests substantial upside potential relative to current levels.

Don’t Let Luck Decide Your Entry Point
Optimize your entry points with our advanced ProRealTime indicators. You’ll get efficient buy signals with precise price targets for maximum performance. Start outperforming now!
Analyst & Consumer Opinions
This section examines analyst ratings and consumer feedback to provide a balanced view of RTX Corporation’s market perception.
Stock Grades
Here are the latest verified analyst grades for RTX Corporation from leading financial institutions:
| Grading Company | Action | New Grade | Date |
|---|---|---|---|
| JP Morgan | Maintain | Overweight | 2026-01-28 |
| RBC Capital | Maintain | Outperform | 2026-01-28 |
| UBS | Maintain | Neutral | 2026-01-28 |
| Citigroup | Maintain | Buy | 2026-01-13 |
| UBS | Downgrade | Neutral | 2026-01-05 |
| JP Morgan | Maintain | Overweight | 2025-12-19 |
| B of A Securities | Maintain | Buy | 2025-10-27 |
| Susquehanna | Maintain | Positive | 2025-10-22 |
| Goldman Sachs | Maintain | Neutral | 2025-10-22 |
| UBS | Maintain | Buy | 2025-10-22 |
The consensus reflects a predominantly positive outlook, with most firms maintaining Buy or Outperform ratings. UBS’s recent downgrade to Neutral signals some caution, but overall sentiment remains constructive.
Consumer Opinions
Consumer sentiment on RTX Corporation reveals a mix of strong product loyalty and areas needing improvement.
| Positive Reviews | Negative Reviews |
|---|---|
| Reliable performance across products | Customer service response times lag |
| Innovative technology drives value | Pricing feels high for some buyers |
| Strong brand reputation in defense | Complexity of product setup |
| Consistent quality and durability | Limited availability in certain regions |
Overall, consumers praise RTX’s innovation and product reliability, but criticize customer support and pricing. These patterns suggest RTX excels in engineering yet must enhance service and accessibility.
Risk Analysis
Below is a concise overview of key risks facing RTX Corporation, categorized by type, likelihood, and potential impact:
| Category | Description | Probability | Impact |
|---|---|---|---|
| Market Valuation | High P/E ratio of 36.64 signals overvaluation risk amid market corrections or sector rotation. | Medium | High |
| Liquidity | Quick ratio at 0.8 suggests weaker short-term liquidity, raising concerns in tight credit. | Medium | Medium |
| Operational | Dependence on government contracts exposes RTX to policy shifts and budget cuts. | High | High |
| Competitive Threats | Intense aerospace & defense competition pressures margins and innovation cycles. | Medium | Medium |
| Financial Health | Altman Z-Score in grey zone (2.77) indicates moderate bankruptcy risk if conditions worsen. | Low | High |
| Economic Cycles | Aerospace sector cyclical demand fluctuations can impact revenue and cash flow stability. | High | High |
The most salient risks for RTX are operational and economic cycle-related. Government spending cuts or geopolitical shifts could sharply reduce contract awards. Additionally, the aerospace sector’s cyclicality magnifies sensitivity to economic downturns. While liquidity and valuation risks warrant caution, RTX’s strong Piotroski score (7) and favorable debt metrics provide some cushion. Investors should watch for worsening liquidity and any macroeconomic signals affecting defense budgets.
Should You Buy RTX Corporation?
RTX appears to be improving profitability with a slightly favorable moat, indicating growing operational efficiency despite shedding value. Its leverage profile shows moderate debt risks while the overall B- rating suggests a stable but cautious investment profile.
Strength & Efficiency Pillars
RTX Corporation posts solid profitability with a net margin of 7.6% and return on equity at 10.32%. Its ROIC is 6.22%, slightly above the WACC of 5.43%, indicating modest value creation. Financial health shows resilience, with an Altman Z-score of 2.77 placing it in the grey zone, while a strong Piotroski score of 7 reinforces robust fundamentals. The company’s gross margin of 20.08% and interest coverage ratio of 5.77 demonstrate efficient cost control and manageable debt servicing.
Weaknesses and Drawbacks
Valuation metrics raise caution: RTX trades at a high P/E of 36.64 and a P/B of 3.78, reflecting an elevated premium that may strain future returns. Liquidity poses risks with a quick ratio of 0.8, below the ideal threshold, signaling potential short-term cash constraints. Although debt-to-equity stands moderate at 0.63, the neutral current ratio of 1.03 suggests tight working capital. These factors indicate vulnerability to market volatility and pressure on operational flexibility.
Our Verdict about RTX Corporation
RTX’s long-term fundamentals appear favorable, supported by improving profitability and a strong Piotroski score. The bullish overall trend combined with buyer dominance (66.1% buyers recently) suggests positive momentum. This profile may appear attractive for long-term exposure, though investors should remain cautious of the stretched valuation and liquidity risks. A measured entry could benefit from monitoring further operational consistency and market conditions.
Disclaimer: This content is for informational purposes only and does not constitute financial, investment, or other professional advice. Investing in financial markets involves a significant risk of loss, and past performance is not indicative of future results.
Additional Resources
- RTX’s Raytheon completes successful ballistic test for U.S. Army’s Next Generation Short Range Interceptor – rtx.com (Feb 02, 2026)
- RTX Corporation (RTX) Is a Trending Stock: Facts to Know Before Betting on It – Yahoo Finance (Feb 05, 2026)
- RTX Corporation $RTX Shares Sold by Thrivent Financial for Lutherans – MarketBeat (Feb 05, 2026)
- RTX to boost U.S. missile output: Tomahawks to exceed 1,000 a year – stocktitan.net (Feb 04, 2026)
- News | RTX’s Raytheon selected by DARPA to develop advanced maritime defense technologies – rtx.com (Feb 02, 2026)
For more information about RTX Corporation, please visit the official website: rtx.com