Home > Analyses > Technology > PTC Inc.
PTC Inc. is at the forefront of revolutionizing how businesses digitally innovate and manage product lifecycles. Through cutting-edge platforms like ThingWorx and Vuforia, PTC seamlessly integrates augmented reality and IoT into enterprise workflows, enhancing design and operational efficiency. Renowned for its robust software solutions and steady innovation in product development tools, PTC commands respect in the software application industry. As we analyze its current fundamentals, the key question remains: does PTC’s market valuation fully reflect its future growth potential?
Table of contents
Business Model & Company Overview
PTC Inc., founded in 1985 and headquartered in Boston, Massachusetts, is a leading player in the software application industry. The company’s core mission revolves around a comprehensive ecosystem of digital transformation tools, including platforms like ThingWorx and Vuforia, which enable businesses to innovate through augmented reality and IoT. Its portfolio also includes Onshape, Arena, Creo, and Windchill, positioning PTC as a pioneer in integrating design, collaboration, and product lifecycle management.
The company’s revenue engine is driven by a balanced mix of software products and professional services, including consulting, cloud, and support offerings. PTC’s strategic presence spans the Americas, Europe, and Asia Pacific, allowing it to capitalize on diverse market dynamics. This global footprint, combined with a robust SaaS model, establishes a strong economic moat, solidifying PTC’s role in shaping the future of industrial innovation and digital transformation.
Financial Performance & Fundamental Metrics
In this section, I analyze PTC Inc.’s income statement, key financial ratios, and dividend payout policy to assess its overall financial health and investment potential.
Income Statement
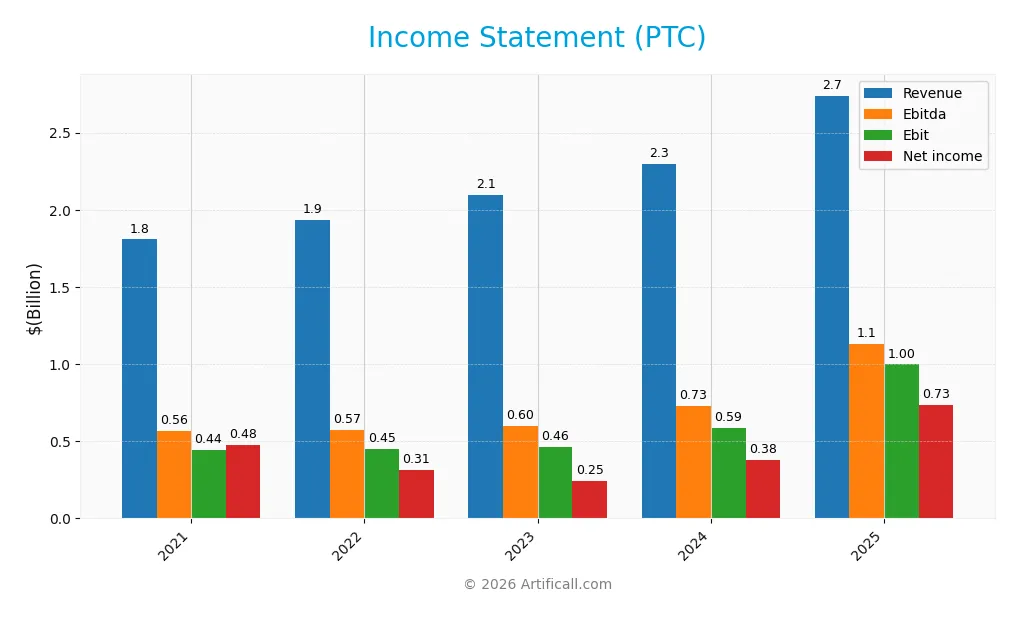
The table below summarizes PTC Inc.’s key income statement figures for fiscal years 2021 through 2025, presented in USD and scaled to millions for clarity.
| 2021 | 2022 | 2023 | 2024 | 2025 | |
|---|---|---|---|---|---|
| Revenue | 1.81B | 1.93B | 2.10B | 2.30B | 2.74B |
| Cost of Revenue | 371M | 386M | 441M | 445M | 445M |
| Operating Expenses | 1.06B | 1.10B | 1.20B | 1.27B | 1.31B |
| Gross Profit | 1.44B | 1.55B | 1.66B | 1.85B | 2.29B |
| EBITDA | 565M | 573M | 599M | 730M | 1.13B |
| EBIT | 442M | 451M | 462M | 589M | 997M |
| Interest Expense | 50M | 54M | 129M | 120M | 77M |
| Net Income | 477M | 313M | 246M | 376M | 734M |
| EPS | 4.08 | 2.67 | 2.07 | 3.14 | 6.18 |
| Filing Date | 2021-11-22 | 2022-11-15 | 2023-11-20 | 2024-11-14 | 2025-11-21 |
Income Statement Evolution
From 2021 to 2025, PTC Inc. demonstrated consistent revenue growth, rising from 1.81B to 2.74B, a 51.58% increase. Net income more than doubled, growing 53.9% to 734M in 2025. Margins improved or remained stable, with a gross margin at 83.76% and net margin at 26.8%, reflecting efficient cost management and profitability expansion over the period.
Is the Income Statement Favorable?
The 2025 income statement shows strong fundamentals: revenue surged 19.18% year-over-year to 2.74B, while net income increased 63.66%, reaching 734M. EBIT margin stood at a favorable 36.4%, supported by controlled interest expenses at 2.81% of revenue. The EPS nearly doubled, growing 96.79%, underscoring robust earnings growth. Overall, the income statement metrics present a favorable financial position for 2025.
Financial Ratios
The following table summarizes key financial ratios for PTC Inc. over the last five fiscal years, offering insight into profitability, valuation, liquidity, leverage, and efficiency metrics:
| Ratios | 2021 | 2022 | 2023 | 2024 | 2025 |
|---|---|---|---|---|---|
| Net Margin | 26% | 16% | 12% | 16% | 27% |
| ROE | 23% | 14% | 9% | 12% | 19% |
| ROIC | 10% | 9% | 7% | 9% | 14% |
| P/E | 29.3 | 39.2 | 68.3 | 57.5 | 33.2 |
| P/B | 6.87 | 5.34 | 6.26 | 6.73 | 6.37 |
| Current Ratio | 1.38 | 1.35 | 0.76 | 0.78 | 1.12 |
| Quick Ratio | 1.38 | 1.35 | 0.76 | 0.78 | 1.12 |
| D/E | 0.81 | 0.67 | 0.71 | 0.60 | 0.36 |
| Debt-to-Assets | 37% | 33% | 30% | 30% | 21% |
| Interest Coverage | 7.54 | 8.24 | 3.54 | 4.91 | 12.76 |
| Asset Turnover | 0.40 | 0.41 | 0.33 | 0.36 | 0.41 |
| Fixed Asset Turnover | 7.15 | 8.20 | 9.06 | 11.02 | 15.58 |
| Dividend Yield | 0% | 0% | 0% | 0% | 0% |
Evolution of Financial Ratios
Over the period from 2021 to 2025, PTC Inc.’s Return on Equity (ROE) showed a notable improvement from 23.4% in 2021 to 19.2% in 2025, despite some fluctuations. The Current Ratio rose from around 0.76 in 2023 to 1.12 in 2025, signaling an enhancement in short-term liquidity. The Debt-to-Equity Ratio decreased significantly from 0.81 in 2021 to 0.36 in 2025, indicating reduced leverage and improved financial stability.
Are the Financial Ratios Favorable?
In 2025, PTC Inc. exhibits favorable profitability with a net margin of 26.8% and ROE at 19.18%. Liquidity ratios are generally positive, with a quick ratio of 1.12 marked favorable, while the current ratio is neutral at 1.12. Leverage appears well-managed, as reflected by a debt-to-equity ratio of 0.36 and an interest coverage ratio of nearly 13. However, valuation ratios such as price-to-earnings (33.2) and price-to-book (6.37) are considered unfavorable, and asset turnover at 0.41 is weak, pointing to some operational efficiency concerns. Overall, the majority of ratios present a favorable financial position.
Shareholder Return Policy
PTC Inc. does not pay dividends, reflecting a strategy likely focused on reinvestment or growth rather than immediate shareholder payouts. Despite no dividend distribution, the company maintains free cash flow coverage near 99%, indicating solid cash generation capacity.
There is no evidence of share buyback programs in recent years. This distribution approach suggests prioritizing internal funding sources and growth investments, which may support sustainable long-term value creation if effectively managed.
Score analysis
The following radar chart illustrates the company’s performance across key financial metrics for a comprehensive overview:
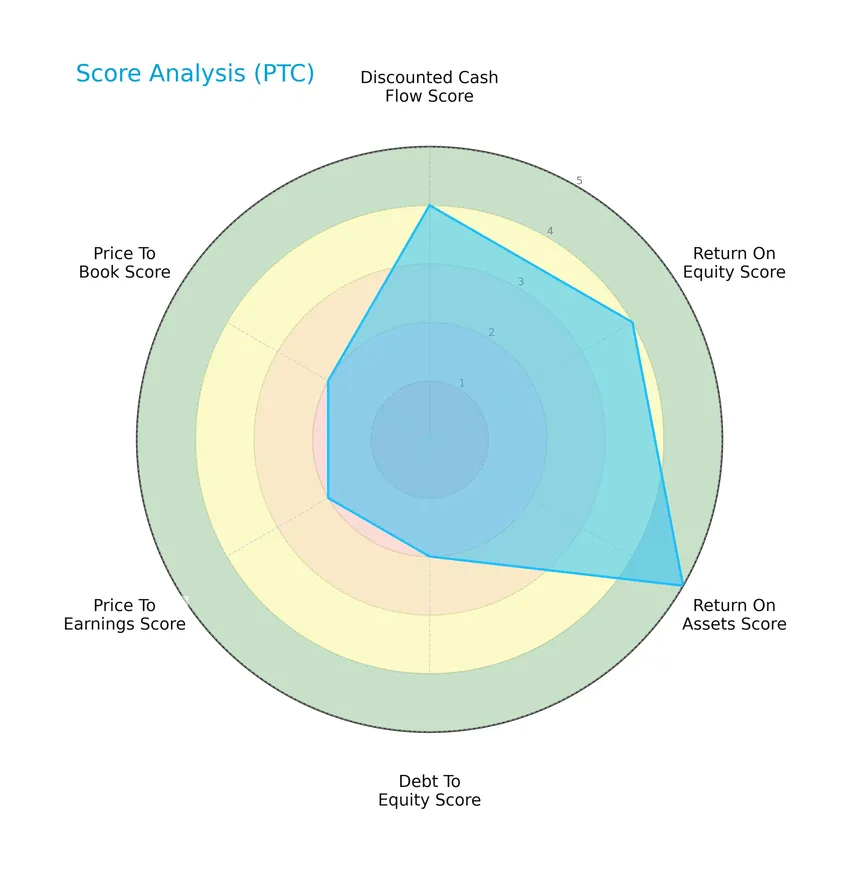
PTC Inc. shows favorable scores in discounted cash flow and return on equity, with a very favorable return on assets score. However, debt to equity, price to earnings, and price to book ratios are moderate, indicating balanced financial metrics overall.
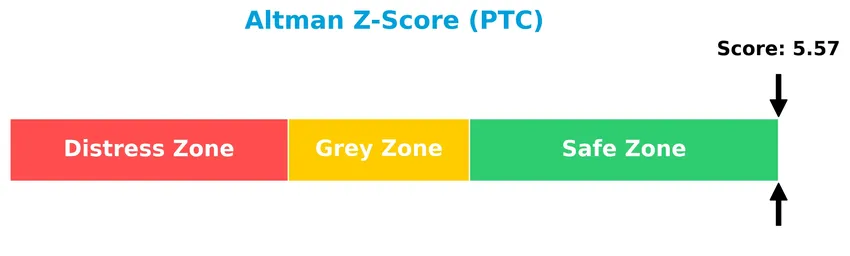
Analysis of the company’s bankruptcy risk
The Altman Z-Score indicates that PTC Inc. is in the safe zone, suggesting a low risk of bankruptcy and strong financial stability:
Is the company in good financial health?
The Piotroski diagram below provides insights into the company’s financial strength based on nine criteria:

With a Piotroski score of 8, PTC Inc. demonstrates very strong financial health, reflecting solid profitability, efficient use of assets, and good leverage and liquidity positions.
Competitive Landscape & Sector Positioning
This sector analysis will explore PTC Inc.’s strategic positioning, revenue by segment, key products, main competitors, and overall market context. I will assess whether PTC holds a competitive advantage relative to its industry peers based on these factors.
Strategic Positioning
PTC Inc. has a diversified product portfolio across software licenses, technology services, and support/cloud services, with FY2025 revenues of $1.16B, $107M, and $1.47B respectively. Geographically, it operates broadly across the Americas ($1.33B), Europe ($995M), and Asia Pacific ($417M), reflecting a balanced international presence.
Revenue by Segment
This pie chart illustrates PTC Inc.’s revenue distribution by segment for the fiscal year 2025, highlighting License, Technology Service, and Support And Cloud Services.
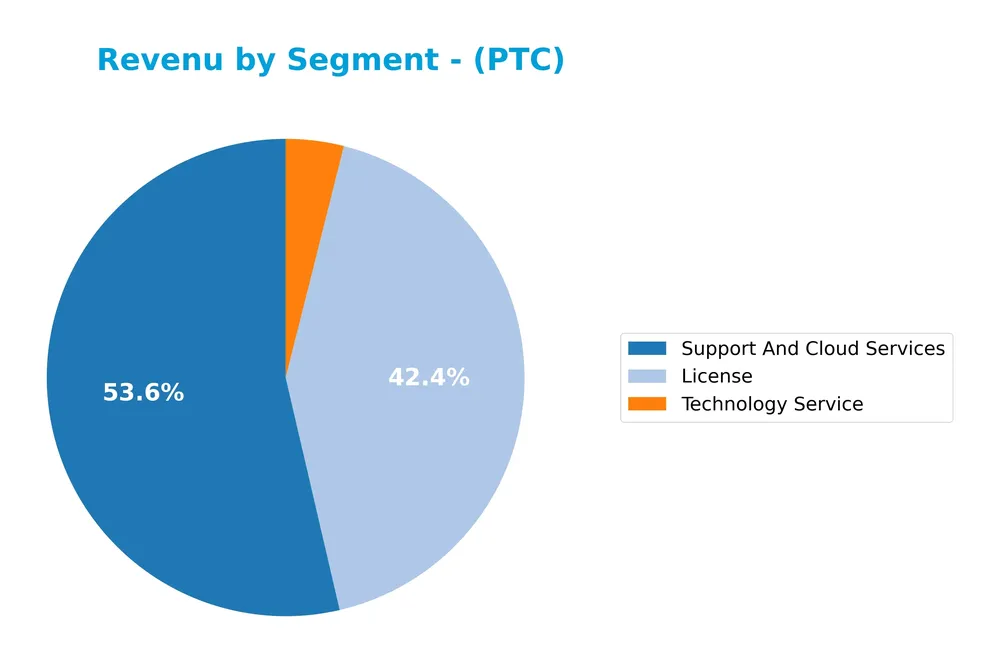
In 2025, Support And Cloud Services led PTC’s revenue with 1.47B, followed by License at 1.16B, and Technology Service at 107M. The steady growth in cloud services underscores a strategic shift toward subscription and service-based models. License revenue shows strong acceleration compared to prior years, suggesting robust demand and potential concentration risk if cloud growth slows. Technology Service remains a smaller, stable contributor.
Key Products & Brands
The table below presents PTC Inc.’s main products and brands along with their core descriptions:
| Product | Description |
|---|---|
| ThingWorx | Platform enabling enterprises to digitally transform business with scalable, easy-to-implement innovative solutions. |
| Vuforia | Augmented reality (AR) technology for visualizing digital information within physical environments. |
| Onshape | SaaS product development platform combining CAD, data management, collaboration, and real-time analytics. |
| Arena | Product lifecycle management (PLM) solution facilitating virtual collaboration among product teams. |
| Creo | 3D CAD technology for digital design, testing, and modification of product models. |
| Windchill | Product lifecycle management software supporting product development processes. |
| Integrity | Application lifecycle management solution. |
| Servigistics | Service parts management solution. |
| Consulting, Implementation, Training, Cloud, License and Support Services | Professional services supporting software products and customer adoption. |
PTC Inc.’s product suite emphasizes digital transformation tools, including CAD, PLM, and lifecycle management solutions, supported by professional services that enhance implementation and customer support.
Main Competitors
There are 33 competitors in total, with the table below listing the top 10 leaders by market capitalization:
| Competitor | Market Cap. |
|---|---|
| Salesforce, Inc. | 242.5B |
| Shopify Inc. | 209.6B |
| AppLovin Corporation | 209.0B |
| Intuit Inc. | 175.2B |
| Uber Technologies, Inc. | 172.2B |
| ServiceNow, Inc. | 153.0B |
| Cadence Design Systems, Inc. | 84.5B |
| Snowflake Inc. | 73.4B |
| Autodesk, Inc. | 61.2B |
| Workday, Inc. | 54.9B |
PTC Inc. ranks 15th among 33 competitors in the Technology sector within the Software – Application industry. Its market capitalization is about 8.0% of the leader, Salesforce, Inc. PTC stands below the average market cap of the top 10 competitors (143.6B) but above the sector median (18.8B). The company maintains a significant 105.7% market cap gap to the next competitor above it.
Comparisons with competitors
Check out how we compare the company to its competitors:
Does PTC have a competitive advantage?
PTC Inc. demonstrates a durable competitive advantage, supported by a very favorable moat status, with ROIC exceeding WACC by 6.06% and a growing ROIC trend of 42.39% over 2021-2025. This indicates efficient use of invested capital and consistent value creation.
Looking ahead, PTC’s outlook includes expanding its digital transformation solutions through platforms like ThingWorx, augmented reality with Vuforia, and SaaS offerings such as Onshape and Arena, aiming to capture opportunities across the Americas, Europe, and Asia Pacific markets.
SWOT Analysis
This SWOT analysis highlights the key internal and external factors impacting PTC Inc., helping investors understand its strategic position.
Strengths
- strong profitability with 26.8% net margin
- robust revenue growth of 19.18% in 2025
- durable competitive advantage with growing ROIC
Weaknesses
- relatively high PE ratio at 33.19
- elevated price-to-book ratio at 6.37
- no dividend yield to attract income investors
Opportunities
- expanding digital transformation market
- growth in AR and SaaS platforms
- geographic revenue growth in Americas and Asia Pacific
Threats
- intense competition in software industry
- rapid technology changes requiring continuous innovation
- macroeconomic risks affecting enterprise IT budgets
PTC Inc. demonstrates strong financial health and a durable moat, supporting a growth-focused strategy centered on innovation and market expansion. However, its valuation and lack of dividends require cautious risk management for investors.
Stock Price Action Analysis
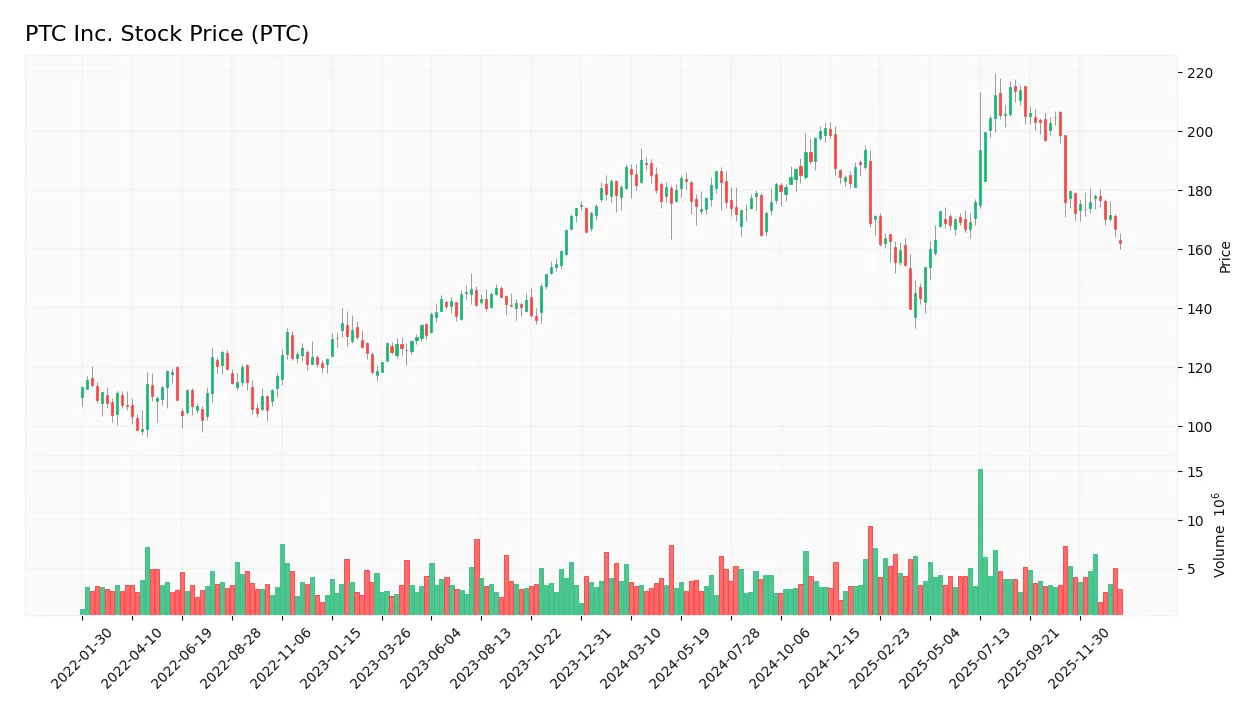
The weekly chart of PTC Inc. stock price over the past 12 months highlights key fluctuations and overall trend direction:
Trend Analysis
Over the past 12 months, PTC’s stock price declined by 13.65%, indicating a bearish trend. The price moved between a high of 215.05 and a low of 139.77, with deceleration in the downward trend. The standard deviation is high at 15.59, reflecting notable volatility during this period.
Volume Analysis
In the last three months, trading volume has increased overall. However, seller volume slightly exceeded buyer volume, with buyers accounting for 45.95%, indicating a mildly seller-dominant market. This suggests cautious investor sentiment and moderate market participation amid recent price declines.
Target Prices
The consensus target prices for PTC Inc. indicate a generally optimistic outlook among analysts.
| Target High | Target Low | Consensus |
|---|---|---|
| 255 | 120 | 213.25 |
Analysts expect the stock to trade within a wide range but generally lean towards a strong upside potential, reflecting confidence in the company’s growth prospects.

Don’t Let Luck Decide Your Entry Point
Optimize your entry points with our advanced ProRealTime indicators. You’ll get efficient buy signals with precise price targets for maximum performance. Start outperforming now!
Analyst & Consumer Opinions
This section reviews recent analyst ratings and consumer feedback to provide insights on PTC Inc.’s market perception.
Stock Grades
The following table summarizes recent verified stock grades from reputable financial institutions for PTC Inc.:
| Grading Company | Action | New Grade | Date |
|---|---|---|---|
| Piper Sandler | Maintain | Neutral | 2025-11-07 |
| Rosenblatt | Maintain | Buy | 2025-11-06 |
| Rosenblatt | Maintain | Buy | 2025-10-30 |
| Oppenheimer | Maintain | Outperform | 2025-07-31 |
| Barclays | Maintain | Overweight | 2025-07-31 |
| Rosenblatt | Maintain | Buy | 2025-07-31 |
| Piper Sandler | Maintain | Neutral | 2025-07-31 |
| RBC Capital | Maintain | Outperform | 2025-07-31 |
| Stifel | Maintain | Buy | 2025-07-31 |
| Keybanc | Maintain | Overweight | 2025-07-31 |
The consensus among these grading companies reflects a generally positive outlook with multiple Buy and Outperform ratings, while a few maintain Neutral positions. This indicates a stable sentiment leaning towards growth potential with cautious optimism.
Consumer Opinions
Consumers of PTC Inc. express a mix of enthusiasm and constructive criticism, reflecting a balanced perspective on the company’s offerings and service quality.
| Positive Reviews | Negative Reviews |
|---|---|
| “PTC’s software solutions are highly intuitive and robust, boosting our operational efficiency significantly.” | “Customer support response times can be slow during peak periods.” |
| “The integration capabilities of their products save us considerable development time.” | “Pricing is on the higher side for small to medium enterprises.” |
| “Regular updates and innovative features keep the platform ahead of competitors.” | “Some users find the initial setup process complex without expert help.” |
| “Strong focus on IoT and AR technology positions PTC as a future-ready partner.” |
Overall, consumers appreciate PTC’s innovation and product reliability, while commonly noting areas for improvement in customer support and accessibility for smaller businesses.
Risk Analysis
The following table summarizes PTC Inc.’s key risk categories, their descriptions, likelihood, and potential impact on the company’s performance:
| Category | Description | Probability | Impact |
|---|---|---|---|
| Market Valuation | Elevated price-to-earnings (33.19) and price-to-book (6.37) ratios may lead to valuation risk | Medium | High |
| Competitive Risk | Intense competition in software and digital transformation markets could pressure growth | Medium | Medium |
| Technology Risk | Rapid technological changes require continuous innovation and platform updates | High | High |
| Liquidity Risk | Moderate current ratio (1.12) and debt metrics imply manageable but notable liquidity risks | Low | Medium |
| Dividend Policy | No dividend yield may deter income-focused investors | Low | Low |
PTC’s most significant risks are related to technology disruption and market valuation. The company’s strong Altman Z-score (5.57, safe zone) and high Piotroski score (8, very strong) indicate financial stability, but the relatively high P/E and P/B ratios suggest caution due to potential overvaluation. Continuous innovation remains critical to maintain competitive advantage.
Should You Buy PTC Inc.?
PTC Inc. appears to be delivering improving profitability with a durable competitive moat supported by a growing ROIC that suggests strong value creation. Despite moderate leverage, the company’s overall rating of B+ reflects a very favorable profile with solid operational efficiency and financial strength.
Strength & Efficiency Pillars
PTC Inc. presents a robust profitability profile with a net margin of 26.8%, an impressive return on equity (ROE) of 19.18%, and a return on invested capital (ROIC) of 14.43%. Notably, its ROIC significantly exceeds its weighted average cost of capital (WACC) at 8.37%, confirming the company as a clear value creator. Financial health is solid, supported by an Altman Z-score of 5.57, safely in the safe zone, and a very strong Piotroski score of 8, indicating strong operational efficiency and low bankruptcy risk. These metrics highlight durable competitive advantages and increasing profitability.
Weaknesses and Drawbacks
Despite its strengths, PTC faces valuation challenges with a price-to-earnings (P/E) ratio at 33.19 and a price-to-book (P/B) ratio of 6.37, both marked as unfavorable, suggesting the stock trades at a premium that could temper upside potential. The asset turnover ratio is low at 0.41, indicating less efficient use of assets in generating sales. Additionally, the stock exhibits bearish technical trends with a recent price decline of 7.93% and slightly seller-dominant volume (buyer dominance at 45.95%), signaling near-term market pressure that could impact entry timing.
Our Verdict about PTC Inc.
PTC Inc.’s long-term fundamental profile appears favorable, driven by strong profitability, value creation, and financial stability. However, recent technical trends show slight seller dominance and bearish price momentum. Despite the company’s underlying strength, this market pressure suggests a cautious, wait-and-see approach to identify a more attractive entry point. The profile may appear compelling for investors prioritizing solid fundamentals over short-term volatility.
Disclaimer: This content is for informational purposes only and does not constitute financial, investment, or other professional advice. Investing in financial markets involves a significant risk of loss, and past performance is not indicative of future results.
Additional Resources
- Rakuten Investment Management Inc. Invests $1.96 Million in PTC Inc. $PTC – MarketBeat (Jan 24, 2026)
- PTC Onshape Helps Reditus Space Accelerate Reusable Reentry Capsule – Yahoo Finance (Jan 21, 2026)
- PTC’s Onshape Selected by Reditus Space to Accelerate Development of Reusable Orbital Reentry Capsule – PR Newswire (Jan 20, 2026)
- PTC’s Space Contract And AI Upgrades Add Context To Valuation Story – Sahm (Jan 22, 2026)
- PTC Inc. (NASDAQ:PTC) Given Consensus Rating of “Moderate Buy” by Analysts – MarketBeat (Jan 24, 2026)
For more information about PTC Inc., please visit the official website: ptc.com